Wai-Fah Chen.The Civil Engineering Handbook
Подождите немного. Документ загружается.


27
-6
The Civil Engineering Handbook, Second Edition
Dilatometer Testing
The flat plate dilatometer test [Marchetti, 1980; Schmertmann, 1986] was originally introduced to provide
an easy method for determining the horizontal soil pressures acting on laterally loaded piles. The present
design of the dilatometer blade consists of a flat blade 1.5 cm thick by 9.6 cm wide with a 6.0 cm diameter
membrane on one face, as shown in Fig. 27.4. The test is performed by advancing the blade by quasi-
static push at a rate of 2 cm/s. At regular intervals, typically every 20 cm, two or three pressure readings
are obtained. The A pressure reading is a membrane liftoff pressure and is obtained just as the membrane
begins to move. The B pressure reading is the pressure required to cause the center of the membrane to
move 1.1 mm into the soil mass. If desired, a C pressure reading may be obtained by controlling the rate
of deflation of the membrane and finding the pressure at which the membrane once again comes in
contact with its seat. The A and B pressure readings, corrected for membrane stiffness to
P
1
and
P
0
,
respectively, are used to define a number of dilatometer indices:
The C pressure reading, corrected for membrane stiffness, is thought to provide an upper bound to
the induced pore pressures.
Using these dilatometer indices and numerous correlations which have been developed, a large number
of soil parameters can be estimated. The principal advantages and disadvantages of dilatometer testing
are summarized in Table 27.9.
Pressuremeter Testing
The pressuremeter test [Baguelin et al., 1978] typically consists of placing an inflatable cylindrical probe
in a predrilled borehole and recording the changes in pressure and volume as the probe is inflated. The
standard test procedure (ASTM D4719) uses probes with typical diameters ranging between 4.4 and
TABLE 27.5
Assessment of
In Situ
Testing
Advantages Disadvantages
Rapid No sample recovered (except SPT)
Inexpensive Indirect measurement related through calibration
Difficult deposits can be tested Complex data reduction
In situ
stress, pore fluid, temperature conditions Relies heavily on empirical correlations
Real-time measurements Unknown boundary conditions
Reproducible results Unknown drainage conditions
Large volume of soil tested Strain-rate effects
Continuous or semicontinuous profiling Nonuniform strains applied
Specialized equipment and skilled operators often required
TA BLE 27.6
Assessment of Standard Penetration Testing
Advantages Disadvantages
Commonly available Based on empirical correlations
Applicable to most soils Significant operator/equipment
influences (See Navfac DM7.1)
Sample (disturbed) recovered Not useful in gravels, cobbles
Rapid/inexpensive Not useful in sensitive clays
Dilatometer index E
D
, 34.7 P
1
P
0
–()=
Horizontal stress index K
D
, P
1
U
0
–()
s
¢
v0
()§=
Material index I
D
, P
1
P
0
–()P
0
U
0
–()§=
© 2003 by CRC Press LLC
In Situ Subsurface Characterization
27
-7
7.4 cm while the length of the inflatable portion of the probe on which the soil response is based varies
between about 30 and 60 cm depending on whether the unit is a single-cell type or has guard cells at
either end of the measuring cell. The probe can be expanded using equal pressure increments or equal
volume increments. A schematic of a typical test arrangement is shown in Fig. 27.5. Pressuremeter
soundings consist of tests performed at 1 m intervals, although clearly this is a function of the site geology
and the purpose of the investigation. The test results, appropriately corrected for membrane stiffness and
hydrostatic pressure between the control unit and the probe, are plotted as shown in Fig. 27.6, from
which the pressuremeter modulus,
E
PM
, and the limit pressure,
P
L
, are determined. Using these pres-
suremeter indices and numerous correlations which have been developed, a large number of soil param-
eters can be estimated. The principal advantages and disadvantages of pressuremeter testing are
summarized in Table 27.10.
One of the key factors which affects the results of the pressuremeter test is the amount of stress relief
which occurs before the probe is expanded. To minimize this problem, guidelines for borehole sizes and
FIGURE 27.2
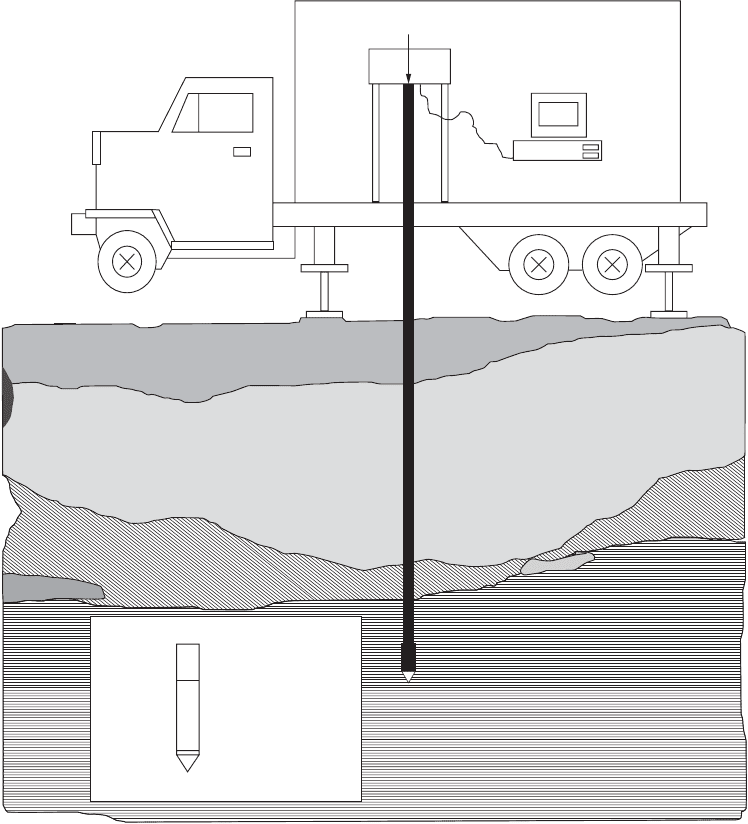
Cone penetration test system.
Electronic Piezocone
Hydraulic Loading
Ram
Data Acquisition
System
Sleeve Friction, f
s
Pore Pressure, u
Tip Resistance, q
c
© 2003 by CRC Press LLC
27
-8
The Civil Engineering Handbook, Second Edition
the test sequence are given in ASTM D4719 for probes requiring a predrilled borehole. Alternatively, self-
boring devices can be used to reduce the impact of stress relief.
Vane Shear Test
The vane shear test consists of placing a four-bladed vane in the undisturbed soil at the bottom of a
boring and determining the torsional force required to cause a cylindrical surface to be sheared by the
vane [Becker et al., 1987]. The test is applicable for cohesive soils. The standard test procedure [ASTM
D2573] uses vanes with typical diameters ranging between 3.8 and 9.2 cm and lengths of 7.6 to 18.4 cm,
as shown in Fig. 27.7. Selection of the vane size depends on the soil type with larger vanes used in softer
FIGURE 27.3
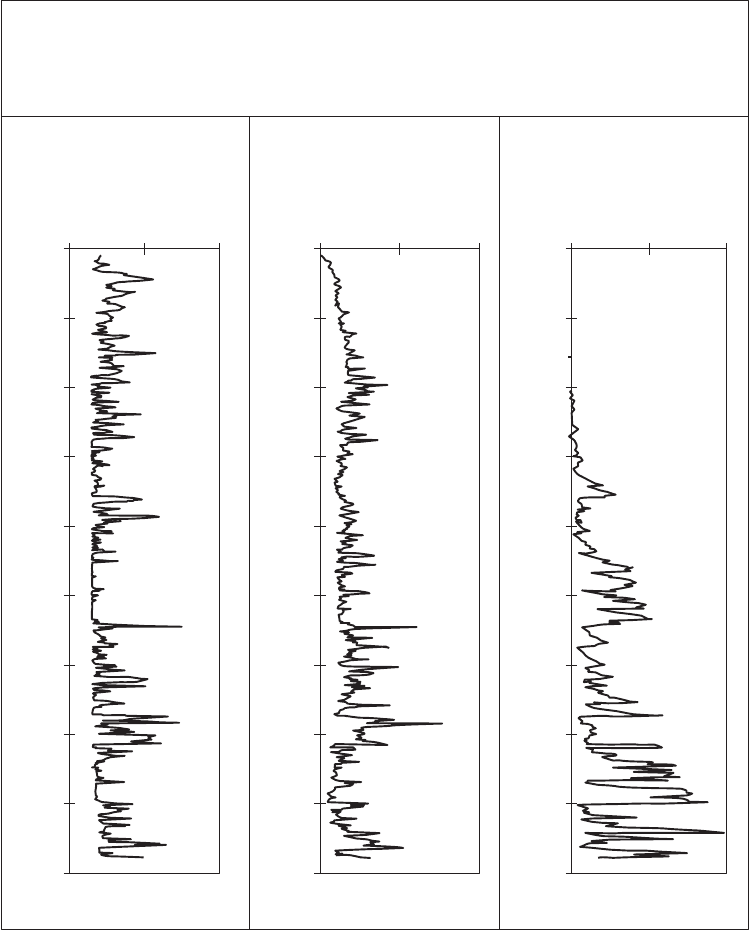
Typical cone penetrometer record.
PIEZOCONE PENETROMETER DATA
SOUNDINGS PERFORMED FOR CE6254
Corrected Tip
Resistance (tsf)
Depth (ft)
Depth (ft)
Depth (ft)
Sleeve Friction
(tsf)
Pore Pressure
(tsf)
SCHOOL OF CIVIL ENGINEERING
GEORGIA INSTITUTE OF TECHNOLOGY
Date: 3/17/94 Drill Rig: CME77 Predrill: 1' Filter: Behind Tip
Test Site: Atlanta, GA Test No.: CONE1 GWT: n/a Operators: S. Burns
Location: New Dorm Site Y. Hegazy
0
0
10
20
30
40
50
60
70
80
90
0
10
20
30
40
50
60
70
80
90
0
10
20
30
40
50
60
70
80
90
50 100 0 1 2 0 5 10
© 2003 by CRC Press LLC

In Situ Subsurface Characterization
27
-9
clays so as to provide measured torque values of a reasonable magnitude. The torque is applied at a
relatively slow rate of the order of 0.1˚/s which results in times to failure of 2 to 10 minutes depending
on soil type. The shear strength of the soil is calculated as the product of the torque applied and a constant
depending on the geometry of the vane. The principal advantages and disadvantages of vane shear testing
are summarized in Table 27.11.
Geophysical Testing
Geophysical testing techniques [Woods, 1978] for investigating subsurface conditions have become a
frequently used tool by engineers. They offer a number of advantages over other investigation techniques,
including the noninvasive nature of the methods and the volume of soil for which properties are
determined. The most common methods are seismic reflection and seismic refraction. The basis of these
methods is that the time for seismic waves to travel between a source and receiver can be used to interpret
information about the material through which it travels. Depending on the arrangement of the source
and receivers, the subsurface environment can thus be characterized. In general, the methods require a
subsurface profile where the layer stiffnesses and hence wave velocities increase with depth. Advantages
and disadvantages of geophysical test methods are given in Table 27.12.
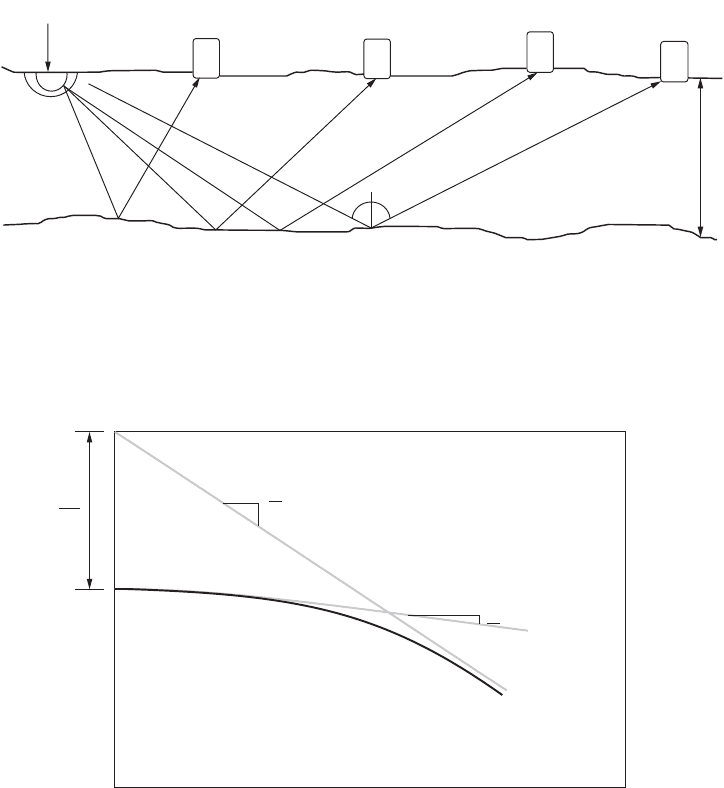
Seismic Reflection
Seismic reflection is used to describe methods where the time for the reflection of a seismic wave induced
at the surface is recorded. A typical test configuration is shown in Fig. 27.8. This method involves study
of complete wave trains from multiple receivers to characterize the subsurface; thus, interpretation of
the test results can be subjective.
Seismic Refraction
Seismic refraction is used to describe methods where the time for seismic waves which are refracted when
they encounter a stiffer material in the subsurface are recorded. A typical test configuration is shown in
Fig. 27.9. Unlike reflection methods, refraction methods only rely on the time for first arrivals; thus,
interpretation of the results can be more straightforward.
TABLE 27.7 Assessment of Cone Penetration Testing
Advantages Disadvantages
Rapid/inexpensive No sample recovered
Reproducible results Penetration depth limited to 150–200 ft
Continuous tip resistance, sleeve friction, and pore pressure
(piezocone) profile
Normally cannot push through gravel
Accurate, detailed subsurface stratigraphy/identification of problem
soils
Requires special equipment and skilled operators
Real-time measurements Most analysis based on correlations
Pore pressure dissipation tests allow prediction of permeability and
C
h
Models available to predict strength, stress history, compressibility
TABLE 27.8 Specialized Cone Penetrometers
Sensor Application
Accelerometer Measurement of seismic wave velocity
Nuclear moisture content sensors Measurement of soil moisture content
Resistivity electrodes Identification of pore characteristics and fluids
Laser-induced fluorescence Hydrocarbon detection
Te m p e r ature Measurement of cone body temperature
Hydrocarbon sensors Detection of BTEX chemicals in pore fluid and vadose zone
© 2003 by CRC Press LLC
27-10 The Civil Engineering Handbook, Second Edition
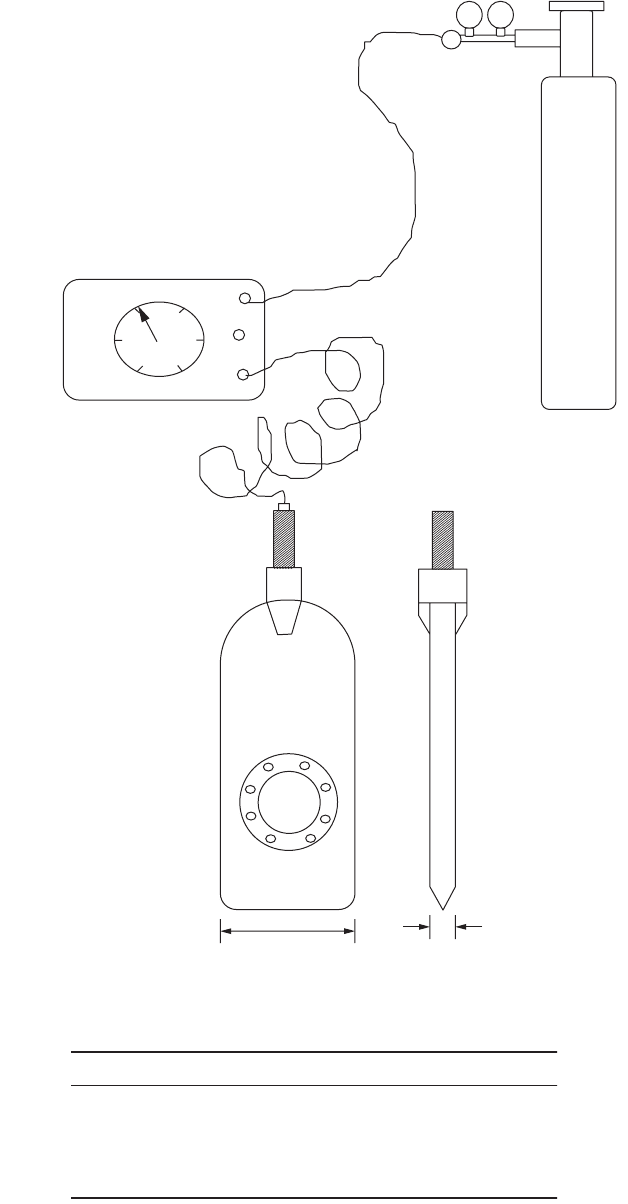
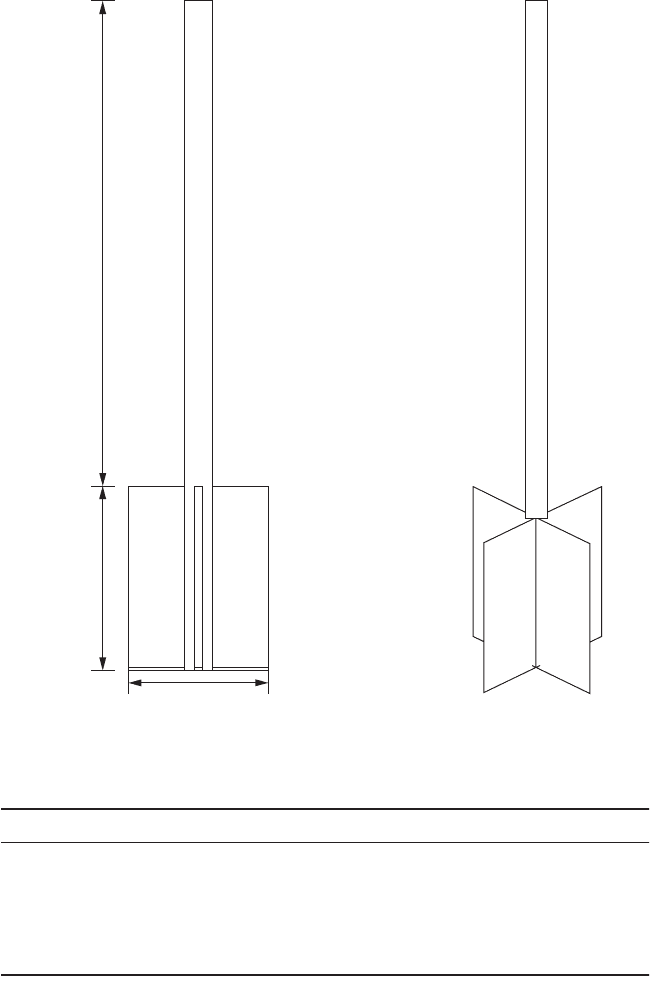
FIGURE 27.4 Dilatometer test system.
TA BLE 27.9
Assessment of Dilatometer Testing
Advantages Disadvantages
Rapid/inexpensive Not applicable in gravels
Does not require skilled operators No sample recovered
Semicontinuous profile Based on empirical correlations
Estimates of horizontal stress and OCR
Rapid data reduction
Control
Panel
Pressurized
Nitrogen Gas
15 mm
96 mm
60 mm diameter
membrane
© 2003 by CRC Press LLC
In Situ Subsurface Characterization 27-11
Crosshole Testing
Crosshole seismic testing differs from the methods described above in that the source and receiver are
located at the same depth in adjacent boreholes and the time for seismic waves to travel between these
instruments is recorded. The standard test procedure for crosshole testing [ASTM D4428] involves drilling
a minimum of three boreholes in line spaced about 3 m apart. A PVC casing is then grouted in place to
ensure a good couple between the source/receiver and the PVC casing and between the PVC casing and
the surrounding soil. A typical configuration is shown in Fig. 27.10.
Other Testing Techniques
While the specific test methods described above represent those that are most frequently used, there are
a large number of other devices and methods that are available and should be considered by the engineer
designing a site investigation program. A number of these methods are used extensively in geo-environ-
mental site characterization programs while others are still in development or are available only for use
on a limited basis. Nevertheless, since the efficiency and quality of any foundation design is directly
dependent on the quality of the subsurface information available, the engineer should be aware of all
possible investigation tools available and select those which can best suit the project at hand. Recognition
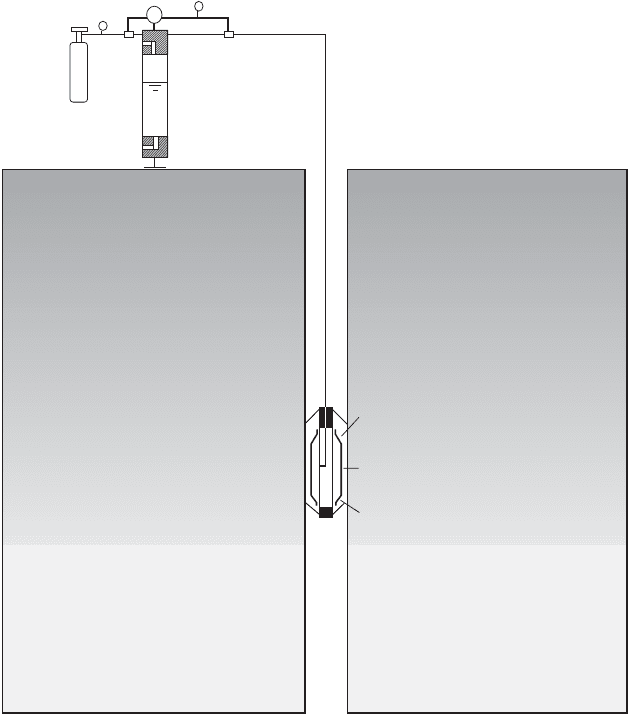
FIGURE 27.5 Pressuremeter test system.
Guard Cell
Pressure
Control
System
Measuring Cell
Guard Cell
© 2003 by CRC Press LLC
27-12 The Civil Engineering Handbook, Second Edition
of the simple fact that the expenditure of an additional few thousand dollars at the site investigation
stage could result in the savings of many thousands or even millions of dollars as a result of an inefficient
design or, worse, a failed foundation system, is important. Accordingly, Table 27.13 contains a listing of
several other testing techniques which should be considered.
27.4 Shipping and Storage of Samples
Use of the best available techniques for drilling and sampling can be negated if appropriate procedures
are not used for shipping and storing samples. Accordingly, an integral part of the planning of any site
investigation program should be the identification of procedures required for shipping samples to a
laboratory and for their subsequent storage prior to testing. Typical details of procedures and containers
appropriate for maintaining subsurface samples in a condition as close as possible to their undisturbed
state are available [for example, ASTM D3213, ASTM D4220, ASTM D5079].
Defining Terms
Geophysical testing — Test procedures which involve the application and recording of the travel of
relatively low frequency, high amplitude waves in the subsurface.
Invasive — Test procedure which involves physical insertion of a test instrument into the subsurface.
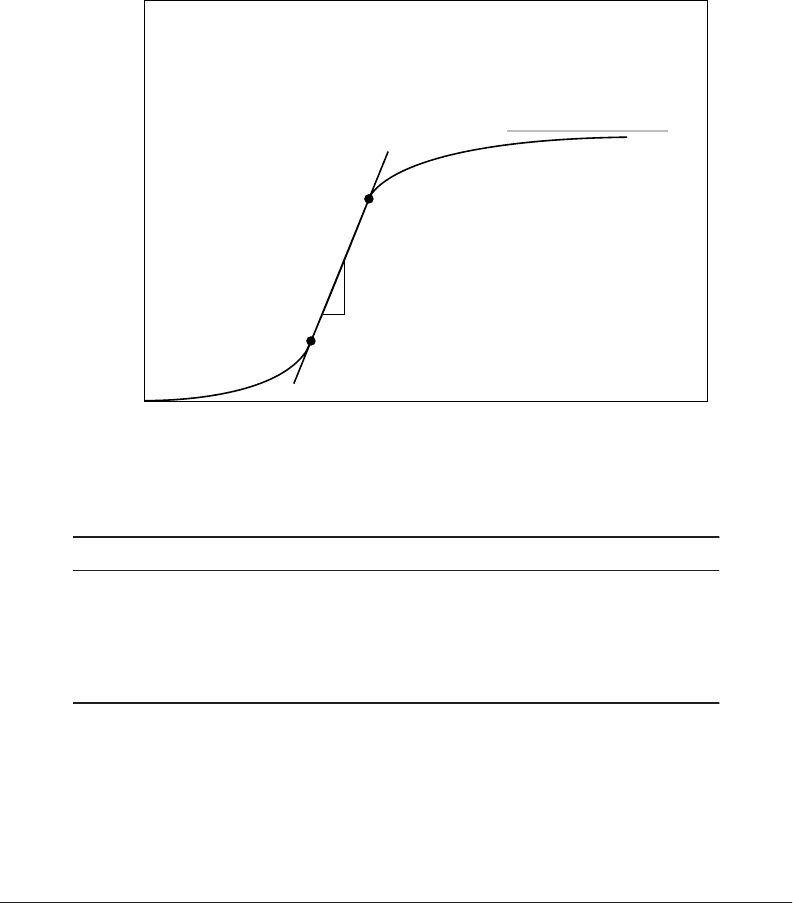
FIGURE 27.6 Typical pressuremeter test result.
TABLE 27.10
Assessment of Pressuremeter Testing
Advantages Disadvantages
Applicable in most soils Expensive
In situ measurements of horizontal stresses,
deformability, strength
Specialized equipment and skilled operators required
Prediction of modulus Delicate equipment
Independent soil characterization required
Prebored hole may be required
Limit Pressure
p
L
p
f
p
o
E
pm
Pressure
Volume
© 2003 by CRC Press LLC
In Situ Subsurface Characterization 27-13
Noninvasive — Test procedure which does not involve physical insertion of a test instrument into the
subsurface.
Penetration testing — Test procedures which involve the performance of a controlled application and
recording of loads and/or deformations as a device is being advanced into the subsurface.
Subsurface — Matrix of soil, rock, groundwater, and pores from which earth structures will be made
and on which buildings will be supported.
Undisturbed sampling — Retrieval of samples from subsurface for subsequent laboratory evaluation
and testing with minimum of disturbance.
FIGURE 27.7 Vane shear test system.
TA BLE 27.11
Assessment of Vane Shear Testing
Advantages Disadvantages
Rapid/inexpensive Only applicable in soft clays
Applicable to sensitive clays Point measurement
Theoretical basis Generally only undrained shear strength measurements
Measurement of shear strength, remolded
shear strength, and sensitivity
No sample recovered
Prebored hole may be required
Independent soil characterization required
D
H=2D
Rectangular Vane
L=10D
© 2003 by CRC Press LLC

27-14 The Civil Engineering Handbook, Second Edition
TA BLE 27.12 Assessment of Geophysical Testing
Method Advantages Disadvantages
Downhole Only one borehole required Attenuation with depth
Relatively inexpensive Invasive
Measurement of seismic soil properties No sample recovered
Limited by depth of borehole
Crosshole Minimum of two boreholes required Expensive
No attenuation with depth Invasive
Measurement of seismic soil properties Possible refraction interference
No sample recovered
Limited by depth of borehole
Surface Noninvasive Complex data analysis
Inexpensive
Measurement of seismic soil properties
Special equipment and skilled operators required
No boreholes required No sample recovered
Environmental applications due to
limited contaminant exposure
Attenuation with depth
Refraction method applicable only when velocities
increase with depth
Possible refraction interference
TA BLE 27.13 Alternative Testing Techniques
Test Usage Reference
Iowa stepped blade Lateral stress measurement Handy et al., 1982
Borehole shear test Shear strength measurement Handy
et al., 1967
Screwplate In situ determination of modulus Schmertmann, 1970
Plate load test Incremental loading of a plate model of a
foundation to predict ultimate bearing capacity
Marsland, 1972
Field direct shear Strength of fissured soils Marsland, 1971
Field hydraulic conductivity test In situ measurement of hydraulic conductivity Daniel, 1989
© 2003 by CRC Press LLC
In Situ Subsurface Characterization 27-15
FIGURE 27.8 Seismic reflection test configuration.
V
1
Source
Receiver Receiver
Receiver
Receiver
H
i
Reflected Wave Arrival
Distance
Reflected Wave
Time
Refracted Wave
Direct Wave
i
V
2
(V
1
< V
2
)
1
V
2
1
V
1
2H
V
1
© 2003 by CRC Press LLC