Westermeier R., Naven T., H?pker H.-R. Proteomics in Practice: A Guide to Successful Experimental Design
Подождите немного. Документ загружается.


373
Step 7: Image Analysis and Evaluation of DIGE Gels
As already mentioned above in the overview part in section 1.6.2,
image analysis and evaluation is the bottle neck in the traditional 2-D
electrophoresis workflow. For the conventional one sample per gel ana-
lysis and evaluation there are various software packages on the mar-
ket, which follow different philosophies. The general concept is
described in this section.
Also DIGE gels can – in principle – be evaluated with several differ-
ent algorithms. However, in order to get the full advantage of all fea-
tures of the DIGE concept, it is highly recommended to apply the
DeCyder 2-D software package, which is dedicated to this type of ana-
lysis.
In the following section the workflow for image analysis of Differ-
ence Gel electrophoresis gels with DeCyder software is described.
The scanned images are saved as 16 bit tiff files in two formats:
*.ds and *.gel. They carry the suffixes Cy2, Cy3, or Cy5 according to
the scanning channel, the internal standard channel additionally the
suffix STANDARD. The *.ds files allow the scanned images to be
overlaid in ImageQuant.
7.1
Cropping of Images
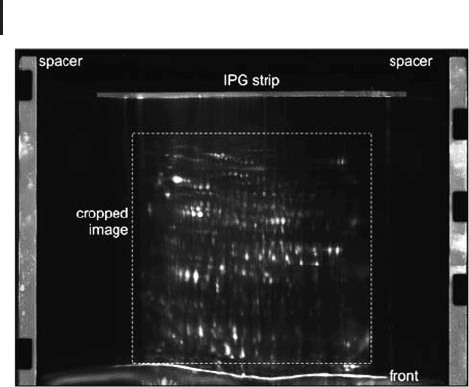
The images of the different channels are overlaid with ImageQuant
or PaintShop Pro and inspected in a false color image. It is impor-
tant to crop the overlay images as *.ds file to exclude the marginal
areas of the pattern. The cut-away areas usually show disturbances,
the IPG strip and the spacers, and will not contribute any useful
information for the 2-D pattern evaluation (see Figure 7.1).
Proteomics in Practice. A Guide to Successful Experimental Design 2
nd
Ed.
Reiner Westermeier, Tom Naven, and Hans-Rudolf Hçpker
Copyright 2008 WILEY-VCH Verlag GmbH & Co. KGaA, Weinheim
ISBN: 978-3-527-31941-1
The DIGE concept with
DeCyder image analysis consid-
erably accelerates and improves
the evaluation of 2-D gels.
Cropping the overlay will guar-
antee identical cropping of all
channels.
Step 7: Image Analysis and Evaluation of DIGE Gels374
Fig. 7.1: Raw scan image (*.ds file) of a DIGE gel, indicating
the cropped area for further evaluation.
The raw images provide some valuable information:
.
The tracking number of the IPG strip;
.
Whether there are proteins which did not leave
the IPG strip;
.
Quality of the separation.
The images can now be analyzed using appropriate software, which
supports spots co-detection and the use of the pooled internal stan-
dard.
7.2
Image Loading
Up to 500 gels can be loaded into one experiment.
.
Create groups according to the experiment
design.
.
Move images into the relevant groups.
7.3
Difference Analysis Within a Gel
This type of analysis can be applied for small sample sets up to three
samples, which are run together in one gel. It can easily be employed
for a spot volume ratio calculation of up- and down-regulated pro-
For sample tracing.
Important for methodical opti-
mization
Important for optimization of
sample preparation and
labeling
Similar to a Windows explorer
system

7.3 Difference Analysis Within a Gel 375
teins. With triple spot co-detection information from three channels
is acquired together, which improves detection of weak spots and
splitting. Corresponding spots have the same boundary. This ensures
exact spot volume ratios. In most practical cases a gradual increase or
decrease of a protein will happen.
In some situations, however, a protein spot can be completely miss-
ing in one of the images. If a protein spot is completely absent in one
sample, the volume ratio calculation will always be based on a small
volume of the background (> 10 counts).
However, in most cases difference analysis within one gel serves as
a preliminary analysis for setting the correct parameters later on in
the batch processor. An experiment will usually consist of more than
two samples, therefore in the real analysis several gels will be ana-
lyzed together.
.
Enter the number of estimated spots, e.g. 3,000.
.
Start calculation “difference in gel analysis
(DIA)”of the Cy3 and the Cy5 image.
At this stage the spot patterns will be normalized on the basis of total
included spots. The logarithms of the spot ratios of the standard and
the sample are used. The use of logarithms tightens the data enabling
accurate fitting of a Gaussian normal distribution curve. The log
ratios follow a normal distribution, assuming that the majority of pro-
teins between two samples remain unchanged. This normalization
measure eliminates variations from different total protein loads, scan
settings, and dye intensities.
.
After the first DIA calculation a divided screen
can be selected as displayed in Figure 7.2. All the
screen areas are linked together.
.
Adjust parameters:
– Setting the threshold to a higher value reduces
the number of up- and down-regulated spots.
The software also calculates the two-model
standard deviation (2 SD). The value is dis-
played close to the graph view as indicated in
Figure 7.2 with a red ellipse. The value dis-
played should provide a base for the threshold
minimum level. For instance, if a 2 SD of 1.93
is shown, select 2.0 for threshold.
– Excluding spots with a very small area (num-
ber of pixels < 100), small volume (< 30,000),
strong slope, and low peak height reduces the
number of detected spots.
A division through 0 cannot
occur.
In order to obtain usable
results, several biological repli-
cates need to be analyzed.
Spot detection is done fully
automatically.
See also the graph area in
Figure 7.2
Small area and high slope indi-
cate a dust particle.
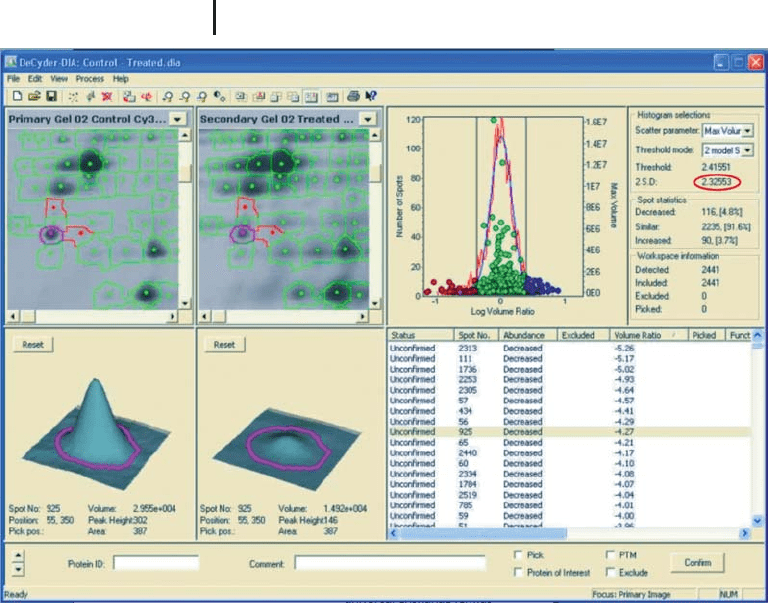
Step 7: Image Analysis and Evaluation of DIGE Gels376
Fig. 7.2: Computer screen of DeCyder difference analysis within
a gel. Clockwise, this is divided into: the gel view of both images
(enlargement of a certain area), the graph area showing spots plotted
over the log volume ratios (green is equal; red is down-, blue is
up-regulated), a data table indicating similar and differing spots,
and a three-dimensional representation of a selected spot with
the spot boundary, which is identical within a gel.
– When the number of spots is modified by
such a filtering process, the normalization is
newly recalculated and is now based on the
new – reduced – spot pattern.
The major applications of the DIA tool are:
.
Semi-quantitative evaluation of up to three sam-
ples;
.
Determination of the optimal number of esti-
mated spot;
.
Checking of correct cropping;
.
Determination of appropriate filter parameters.
For instance for optimization of
sample preparation

7.4 Multi-gel Analysis with a Batch Processor 377
However, these filtering functions do not need to be employed too
extensively, because dust signals are filtered out during spot match-
ing.
7.4
Multi-gel Analysis with a Batch Processor
This is the quantitative evaluation of the images, performed with the
batch processor. The internal standard images of the different gels
are matched, and statistical analysis of the spots across multiple gels
is performed. For this analysis the pooled internal standard plays a
very important role for spot matching and spot volume normalization
(the second normalization step). This normalization to the internal
standard eliminates gel-to-gel variations.
Univariate statistical analysis tools like Student’s t-test and ANOVA
are very important for the automatic selection of spots with signifi-
cant changes. At the same time the statistical confidence for the
changes is given.
When Typhoon or Edi is employed for image acquisition, in the
“DIGE naming format” Cy2 should be selected as internal standard,
to which the spots of the internal standard images of the other gels
will be matched.
.
Select the groups to be analyzed.
.
Enter the parameters found in the preliminary
difference analysis within one gel.
.
Select the desired statistical tests.
.
Start the automated evaluation of the batch pro-
cessor.
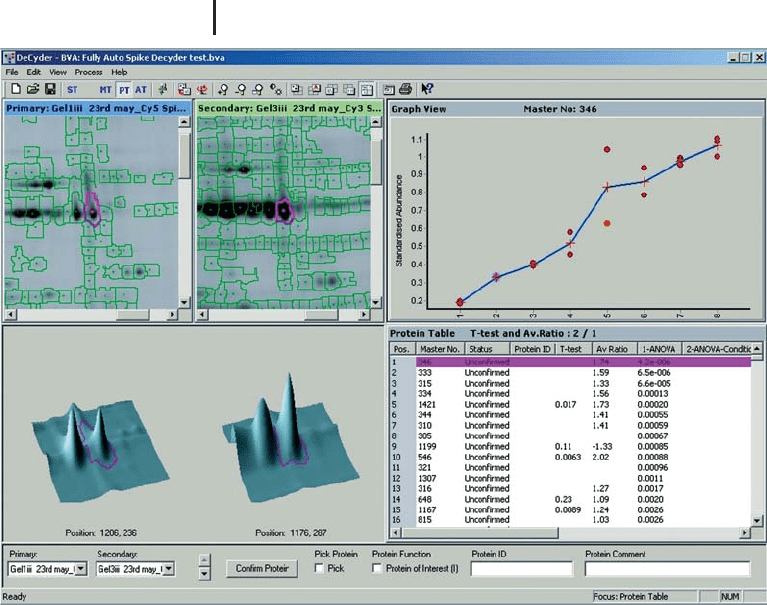
Figure 7.3 shows the computer screen with the views of two selected
gels, a graph indicating the abundances of a selected spot across all
the analyzed gels, this spot’s data highlighted in the data table and its
three-dimensional view. By clicking on another spot, all the views are
changed and the data related to this spot is displayed.
Dust particles will not match,
because they are positioned in
randomly scattered positions.
Step 7: Image Analysis and Evaluation of DIGE Gels378
Fig. 7.3: Computer screen of DeCyder biological variation
analysis across multiple gels. Clockwise, this is divided into: the
gel view of two selected images (enlargement of a certain area),
the graph area showing protein abundances of a time course, a
data table indicating spot abundance ratios and their statistical
values, and a three-dimensional representation of a selected spot
with its spot boundary, which varies from gel to gel.
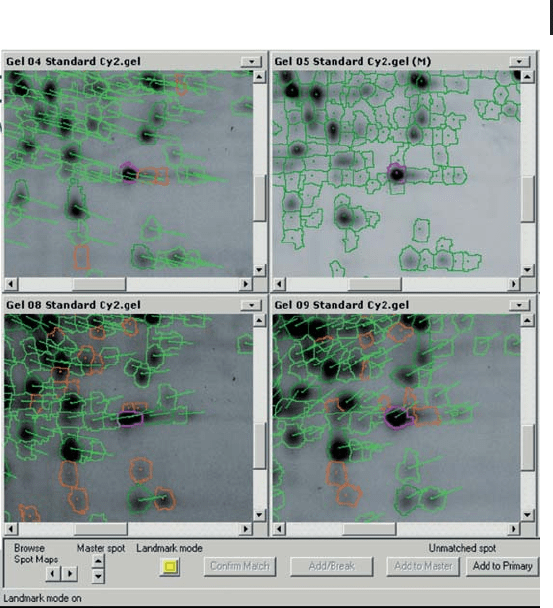
.
Check the automatic matches by visual inspec-
tion in the MT mode. Matching vectors (lines
between spots) indicate which spots are related
to the master spots.
.
If the matching vectors are crossed over or do
not point into similar directions, the matching
process can be manually edited. After introdu-
cing one or a few landmarks the matching pro-
cess can be repeated with a result shown in Fig-
ure 7.4.
7.5 Preparation for Spot Picking 379
Fig. 7.4: Partial computer screen of DeCyder showing matching
vectors across four gels in the gel view. In this case a second matching
has been performed after manually introducing a landmark (purple
boundary). The broken matches are kept as negative landmarks
(orange boundary).
7.5
Preparation for Spot Picking
With a pick filter protein spots for further downstream analysis with
mass spectrometry are chosen, see Figure 7.5. The spot coordinates
are exported together with the coordinates of the reference markers
to a file, which is uploaded to the spot picking computer.
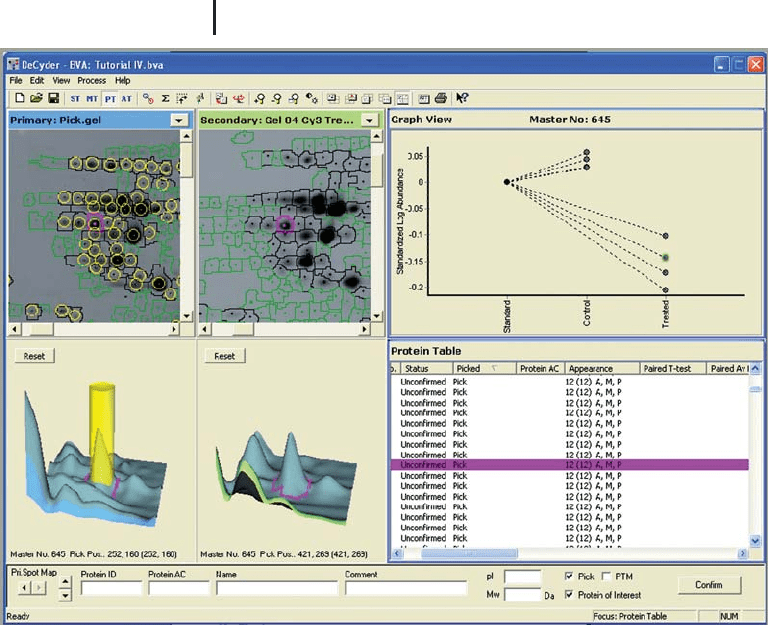
Step 7: Image Analysis and Evaluation of DIGE Gels380
Fig. 7.5: Computer screen of DeCyder for the preparation of
spot picking. Clockwise, this is divided into: the gel view of two
selected images showing the spots selected for picking in one gel
(enlargement of a certain area), the graph view showing protein
abundances after normalization against the standard, a data table
indicating similar spots selected for picking, and a three-dimensional
representation of a selected spot showing the portion to be picked.
7.6
Further Data Analysis
Add-on software packages like DeCyder EDA (Extended data analysis)
can be employed to answer remaining questions, for instance:
.
Grouping of results.
.
Controling appropriate sample annotation
.
Finding spots which are characteristic for a bio-
logical state.
2-D results are usually quite
complex.
When working with a high
number of samples the impor-
tance of such a control should
not be underestimated.

7.6 Further Data Analysis 381
.
Finding proteins with similar expression pro-
files.
.
Finding proteins which serve as biomarkers,
drug targets, classifiers, etc.
.
Finding how many different groups are in an
experiment in an unbiased way.
.
Linking data from multiple experiments.
.
Linking data with data from other experimental
techniques.
The major multivariate statistical tools employed for these tasks are:
.
Principal component analysis (PCA);
.
K-means;
.
Heuristic clustering (supervised and unsuper-
vised);
.
Discriminant analysis.
A very useful feature of DeCyder EDA is the direct linkage between
the images of the results and the 2-D DIGE experiment: by clicking
on a PCA spot or a band on the heat map of heuristic clustering the
original experimental data are directly available with a hyperlink. In
this way the result can be traced back to the separation and the sam-
ple.
Those need to be validated
subsequently by a different
experiment, like Western blot-
ting.
Examples are shown on page
136.

383
Step 8: Spot Excision
Following the selection of the spots of interest, the protein spots have
to be excised from the gel. This step is performed manually or auto-
matically with commercially available spot pickers.
The procedure must be performed in clean environment such as a
Laminar flow hood in order to minimize or most preferably exclude
contaminating proteins such as keratin entering the protein identifi-
cation workflow at this stage. The keratin(s) will be digested in the
same way as the target protein(s), with keratin peptides included in
the PMF spectrum, complicating the subsequent dataset. This is par-
ticularly problematic for low abundant samples. See Tables 8.1–8.4
for lists of keratin peptides commonly observed in MALDI peptide
mass fingerprinting (courtesy of www.matrixscience.com).
Keratin contamination can be introduced into the workflow by poor
sample handling at any stage between conclusion of the electrophor-
esis step and digestion of the target protein. Furthermore, keratin
contamination is almost certainly present in the starting acrylamide
solutions and solvents; all of which need to be filtered before use.
Even the staining unit should be used solely for applications leading
to mass spectrometric analysis. All eppendorf tubes to be used should
be rinsed with MilliQ water (or at least doubly distilled water), espe-
cially if the tubes have been in lying around in drawers before use.
This step will remove any residual dust from the tubes, which may
contain keratins.
& All possible measures need to be taken to avoid
keratin contamination.
Peptides from four common keratins have been reported to contami-
nate many mass spectra. The commonly observed keratin tryptic pep-
tides from these four keratin proteins are tabulated below.
Proteomics in Practice. A Guide to Successful Experimental Design 2
nd
Ed.
Reiner Westermeier, Tom Naven, and Hans-Rudolf Hçpker
Copyright 2008 WILEY-VCH Verlag GmbH & Co. KGaA, Weinheim
ISBN: 978-3-527-31941-1