Anderson D.R., Sweeney D.J., Williams T.A. Essentials of Statistics for Business and Economics
Подождите немного. Документ загружается.


12.7 Computer Solution 525
The regression equation is
Y = 20.0 + 7.21 X
Predictor Coef SE Coef T
Constant 20.000 3.2213 6.21
X 7.210 1.3626 5.29
Analysis of Variance
SOURCE DF SS
Regression 1 41587.3
Residual Error 7
Total 8 51984.1
The regression equation is
Y = 6.1092 + .8951 X
Predictor Coef SE Coef
Constant 6.1092 0.9361
X 0.8951 0.1490
Analysis of Variance
SOURCE DF SS MS
Regression 1 1575.76 1575.76
Residual Error 8 349.14 43.64
Total 9 1924.90
a. How many apartment buildings were in the sample?
b. Write the estimated regression equation.
c. What is the value of
d. UsetheFstatistictotestthesignificanceoftherelationshipata.05levelofsignificance.
e. Estimate the selling price of an apartment building with gross annual rents of $50,000.
41. Following is a portion of the computer output for a regression analysis relating y main-
tenance expense (dollars per month) to x usage (hours per week) of a particular brand
of computer terminal.
s
b
1
?
a. Write the estimated regression equation.
b. Use a t test to determine whether monthly maintenance expense is related to usage at
the .05 level of significance.
c. Use the estimated regression equation to predict monthly maintenance expense for any
terminal that is used 25 hours per week.
42. Aregression model relating x, number of salespersons at a branch office, to y, annual sales
at the office (in thousands of dollars), provided the following computer output from a re-
gression analysis of the data.
CH012.qxd 8/16/10 6:59 PM Page 525
Copyright 2010 Cengage Learning. All Rights Reserved. May not be copied, scanned, or duplicated, in whole or in part. Due to electronic rights, some third party content may be suppressed from the eBook and/or eChapter(s).
Editorial review has deemed that any suppressed content does not materially affect the overall learning experience. Cengage Learning reserves the right to remove additional content at any time if subsequent rights restrictions require it.

526 Chapter 12 Simple Linear Regression
a. Write the estimated regression equation.
b. How many branch offices were involved in the study?
c. Compute the F statistic and test the significance of the relationship at a .05 level of
significance.
d. Predict the annual sales at the Memphis branch office. This branch employs 12
salespersons.
43. Out-of-state tuition and fees at the top graduate schools of business can be very expensive, but
the starting salary and bonus paid to graduates from many of these schools can be substantial.
The following data show the out-of-state tuition and fees (rounded to the nearest $1000) and
the average starting salary and bonus paid to recent graduates (rounded to the nearest $1000)
for a sample of 20 graduate schools of business (U.S. News & World Report 2009 Edition
America’s Best Graduate Schools).
The regression equation is
Y = 80.0 + 50.00 X
Predictor Coef SE Coef T
Constant 80.0 11.333 7.06
X 50.0 5.482 9.12
Analysis of Variance
SOURCE DF SS MS
Regression 1 6828.6 6828.6
Residual Error 28 2298.8 82.1
Total 29 9127.4
Tuition & Salary & Bonus
School Fees ($1000s) ($1000s)
Arizona State University 28 98
Babson College 35 94
Cornell University 44 119
Georgetown University 40 109
Georgia Institute of Technology 30 88
Indiana University—Bloomington 35 105
Michigan State University 26 99
Northwestern University 44 123
Ohio State University 35 97
Purdue University—West Lafayette 33 96
Rice University 36 102
Stanford University 46 135
University of California—Davis 35 89
University of Florida 23 71
University of Iowa 25 78
University of Minnesota—Twin Cities 37 100
University of Notre Dame 36 95
University of Rochester 38 99
University of Washington 30 94
University of Wisconsin—Madison 27 93
file
W
EB
BusinessSchools
a. Develop a scatter diagram with salary and bonus as the dependent variable.
b. Does there appear to be any relationship between these variables? Explain.
CH012.qxd 8/16/10 6:59 PM Page 526
Copyright 2010 Cengage Learning. All Rights Reserved. May not be copied, scanned, or duplicated, in whole or in part. Due to electronic rights, some third party content may be suppressed from the eBook and/or eChapter(s).
Editorial review has deemed that any suppressed content does not materially affect the overall learning experience. Cengage Learning reserves the right to remove additional content at any time if subsequent rights restrictions require it.

12.8 Residual Analysis: Validating Model Assumptions 527
c. Develop an estimated regression equation that can be used to predict the starting salary
and bonus paid to graduates given the cost of out-of-state tuition and fees at the school.
d. Test for a significant relationship at the .05 level of significance. What is your
conclusion?
e. Did the estimated regression equation provide a good fit? Explain.
f. Suppose that we randomly select a recent graduate of the University of Virginia grad-
uate school of business. The school has an out-of-state tuition and fees of $43,000.
Estimate the starting salary and bonus for this graduate.
44. Automobile racing, high-performance driving schools, and driver education programs run
by automobile clubs continue to grow in popularity. All these activities require the partic-
ipant to wear a helmet that is certified by the Snell Memorial Foundation, a not-for-profit
organization dedicated to research, education, testing, and development of helmet safety
standards. Snell “SA” (Sports Application) rated professional helmets are designed for
auto racing and provide extreme impact resistance and high fire protection. One of the
key factors in selecting a helmet is weight, since lower weight helmets tend to place less
stress on the neck. The following data show the weight and price for 18 SA helmets
(SoloRacer website, April 20, 2008).
Helmet Weight (oz) Price ($)
Pyrotect Pro Airflow 64 248
Pyrotect Pro Airflow Graphics 64 278
RCi Full Face 64 200
RaceQuip RidgeLine 64 200
HJC AR-10 58 300
HJC Si-12 47 700
HJC HX-10 49 900
Impact Racing Super Sport 59 340
Zamp FSA-1 66 199
Zamp RZ-2 58 299
Zamp RZ-2 Ferrari 58 299
Zamp RZ-3 Sport 52 479
Zamp RZ-3 Sport Painted 52 479
Bell M2 63 369
Bell M4 62 369
Bell M4 Pro 54 559
G Force Pro Force 1 63 250
G Force Pro Force 1 Grafx 63 280
file
W
EB
RaceHelmets
a. Develop a scatter diagram with weight as the independent variable.
b. Does there appear to be any relationship between these two variables?
c. Develop the estimated regression equation that could be used to predict the price given
the weight.
d. Test for the significance of the relationship at the .05 level of significance.
e. Did the estimated regression equation provide a good fit? Explain.
12.8 Residual Analysis: Validating Model
Assumptions
Aswe noted previously, theresidual forobservation i isthedifferencebetween theobserved
value of the dependent variable (y
i
) and the estimated value of the dependent variable ( ).y
ˆ
i
CH012.qxd 8/16/10 6:59 PM Page 527
Copyright 2010 Cengage Learning. All Rights Reserved. May not be copied, scanned, or duplicated, in whole or in part. Due to electronic rights, some third party content may be suppressed from the eBook and/or eChapter(s).
Editorial review has deemed that any suppressed content does not materially affect the overall learning experience. Cengage Learning reserves the right to remove additional content at any time if subsequent rights restrictions require it.

528 Chapter 12 Simple Linear Regression
In other words, the ith residual is the error resulting from using the estimated regression
equation to predict the value of the dependent variable.The residuals for the Armand’s Pizza
Parlors example are computed in Table 12.7. The observed values of the dependent vari-
able are in the second column and the estimated values of the dependent variable, obtained
using the estimated regression equation 60 5x, are in the third column. An analysis
of the corresponding residuals in the fourth column will help determine whether the as-
sumptions made about the regression model are appropriate.
Let us now review the regression assumptions for the Armand’s Pizza Parlors example.
A simple linear regression model was assumed.
y 
0

1
x (12.29)
This model indicates that we assumed quarterly sales (y) to be a linear function of the size
of the student population (x) plus an error term ⑀. In Section 12.4 we made the following
assumptions about the error term ⑀.
1. E(⑀) 0.
2. The variance of ⑀, denoted by σ
2
, is the same for all values of x.
3. The values of ⑀ are independent.
4. The error term ⑀ has a normal distribution.
These assumptions provide the theoretical basis for the t test and the F test used to deter-
mine whether the relationship between x and y is significant, and for the confidence and
prediction interval estimates presented in Section 12.6. If the assumptions about the error
term ⑀ appear questionable, the hypothesis tests about the significance of the regression re-
lationship and the interval estimation results may not be valid.
y
ˆ
Residual analysis is the
primary tool for
determining whether the
assumed regression model
is appropriate.
Student Population Sales Estimated Sales Residuals
x
i
y
i
2587012
6 105 90 15
8 88 100 12
8 118 100 18
12 117 120 3
16 137 140 3
20 157 160 3
20 169 160 9
22 149 170 21
26 202 190 12
y
i
ⴚ yˆ
i
yˆ
i
ⴝ 60 ⴙ 5x
i
TABLE 12.7 RESIDUALS FOR ARMAND’S PIZZA PARLORS
RESIDUAL FOR OBSERVATION i
(12.28)
where
y
i
is the observed value of the dependent variable
y
ˆ
i
is the estimated value of the dependent variable
y
i
y
ˆ
i
CH012.qxd 8/16/10 6:59 PM Page 528
Copyright 2010 Cengage Learning. All Rights Reserved. May not be copied, scanned, or duplicated, in whole or in part. Due to electronic rights, some third party content may be suppressed from the eBook and/or eChapter(s).
Editorial review has deemed that any suppressed content does not materially affect the overall learning experience. Cengage Learning reserves the right to remove additional content at any time if subsequent rights restrictions require it.
12.8 Residual Analysis: Validating Model Assumptions 529
The residuals provide the best information about ⑀; hence an analysis of the residuals
is an important step in determining whether the assumptions for ⑀ are appropriate. Much of
residual analysis is based on an examination of graphical plots. In this section, we discuss
the following residual plots.
1. A plot of the residuals against values of the independent variable x
2. A plot of residuals against the predicted values of the dependent variable
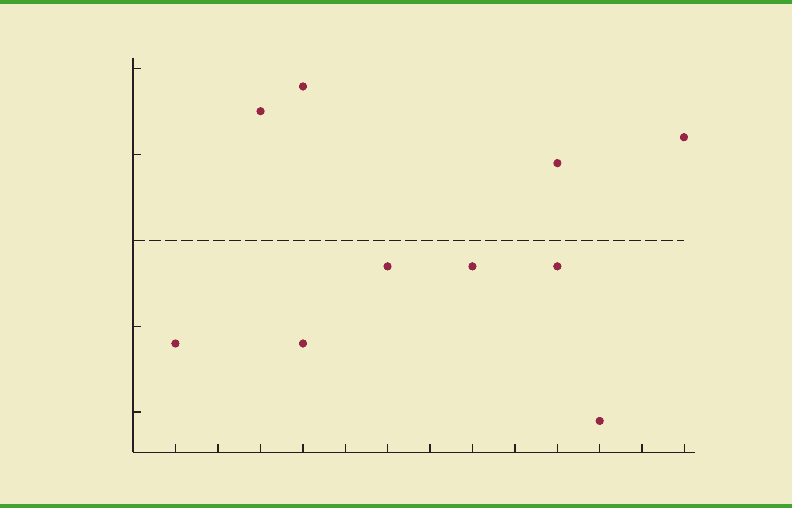
Residual Plot Against x
Aresidual plot against the independent variable x is a graph in which the values of the inde-
pendent variable are representedby thehorizontal axisand the corresponding residual values
are represented by the vertical axis.A point is plotted for each residual. The first coordinate
for each point is given by the value of x
i
and the second coordinate is given by the corre-
sponding value of the residual y
i
i
. For a residual plot against x with theArmand’s Pizza
Parlors data from Table 12.7, the coordinates of the first point are (2, 12), corresponding to
x
1
2 and y
1
1
12; the coordinates of the second point are (6, 15), corresponding
to x
2
6 and y
2
2
15; and so on. Figure 12.11 shows the resulting residual plot.
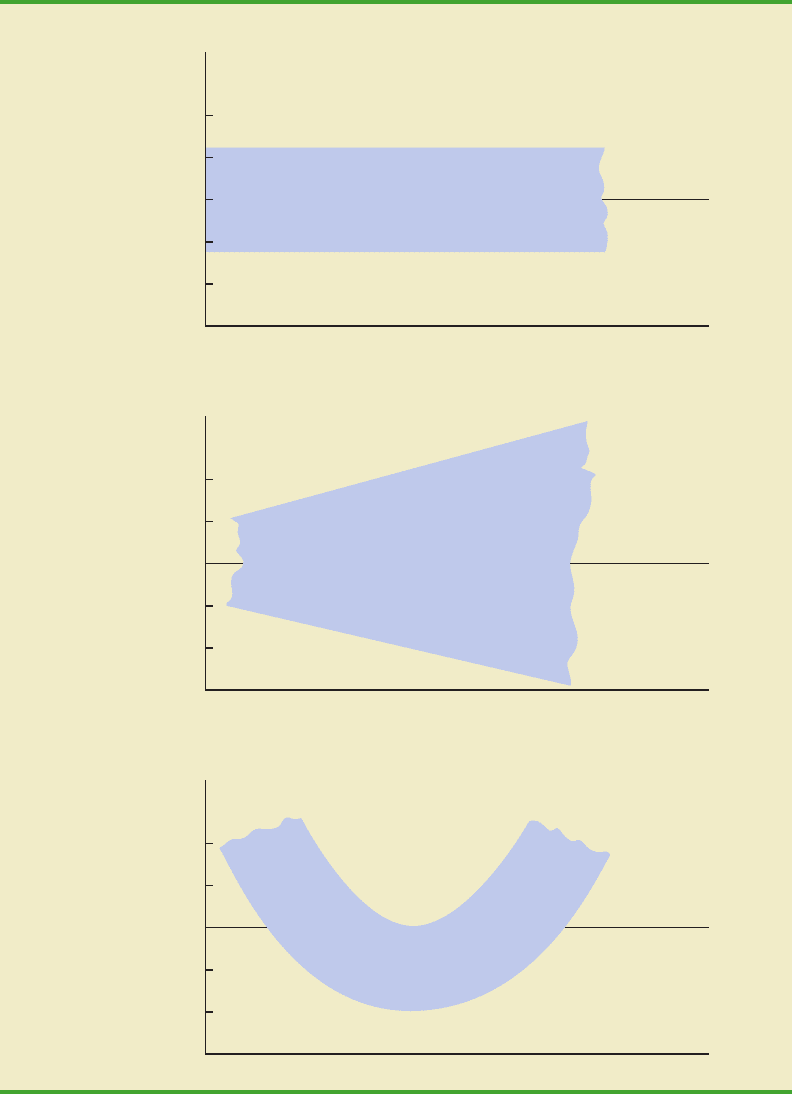
Before interpreting the results for this residual plot, let us consider some general pat-
terns that might be observed in any residual plot. Three examples appear in Figure 12.12.
If the assumption that the variance of ⑀ is the same for all values of x and the assumed re-
gression model is an adequate representation of the relationship between the variables, the
residual plot should give an overall impression of a horizontal band of points such as the
one in Panel A of Figure 12.12. However, if the variance of ⑀ is not the same for all values
of x—for example, if variability about the regression line is greater for larger values of x—
a pattern such as the one in Panel B of Figure 12.12 could be observed. In this case, the as-
sumption of a constant variance of ⑀ is violated. Another possible residual plot is shown in
Panel C. In this case, we would conclude that the assumed regression model is not an
y
ˆ
y
ˆ
y
ˆ
y
ˆ
–20
–10
0
+10
+20
20 4 6 8 10 12 14 16 18 20 22 24 26
Residual
x
y – y
∧
FIGURE 12.11 PLOT OF THE RESIDUALS AGAINST THE INDEPENDENT VARIABLE x
FOR ARMAND’S PIZZA PARLORS
CH012.qxd 8/16/10 6:59 PM Page 529
Copyright 2010 Cengage Learning. All Rights Reserved. May not be copied, scanned, or duplicated, in whole or in part. Due to electronic rights, some third party content may be suppressed from the eBook and/or eChapter(s).
Editorial review has deemed that any suppressed content does not materially affect the overall learning experience. Cengage Learning reserves the right to remove additional content at any time if subsequent rights restrictions require it.
530 Chapter 12 Simple Linear Regression
Good pattern
0
Residual
y – y
^
x
Panel A
0
Residual
y – y
^
x
Panel B
0
Residual
y – y
^
x
Panel C
Nonconstant variance
Model form not adequate
•
•
•
•
•
•
•
•
•
•
•
•
•
•
•
•
•
•
•
•
•
•
•
•
•
•
•
•
•
•
•
•
•
•
•
•
•
•
•
•
•
•
•
•
•
•
•
•
•
•
•
•
•
•
•
•
•
•
•
•
•
FIGURE 12.12 RESIDUAL PLOTS FROM THREE REGRESSION STUDIES
CH012.qxd 8/16/10 6:59 PM Page 530
Copyright 2010 Cengage Learning. All Rights Reserved. May not be copied, scanned, or duplicated, in whole or in part. Due to electronic rights, some third party content may be suppressed from the eBook and/or eChapter(s).
Editorial review has deemed that any suppressed content does not materially affect the overall learning experience. Cengage Learning reserves the right to remove additional content at any time if subsequent rights restrictions require it.
12.8 Residual Analysis: Validating Model Assumptions 531
–20
–10
0
+10
+20
60 80 100 120 140 160 180
Residual
y
y – y
∧
∧
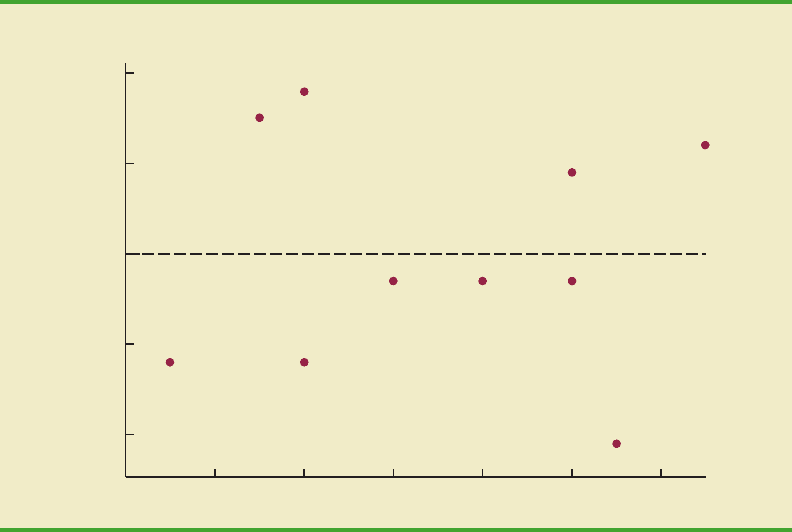
FIGURE 12.13 PLOT OF THE RESIDUALS AGAINST THE PREDICTED VALUES
FOR ARMAND’S PIZZA PARLORS
y
ˆ
adequate representation of the relationship between the variables. A curvilinear regression
model or multiple regression model should be considered.
Now let us return to the residual plot for Armand’s Pizza Parlors shown in Figure 12.11.
The residuals appear to approximate the horizontal pattern in Panel A of Figure 12.12.
Hence, we conclude that the residual plot does not provide evidence that the assumptions
made for Armand’s regression model should be challenged. At this point, we are confident
in the conclusion that Armand’s simple linear regression model is valid.
Experience and good judgment are always factors in the effective interpretation of resid-
ual plots. Seldom does a residual plot conform precisely to one of the patterns in Figure
12.12. Yet analysts who frequently conduct regression studies and frequently review resid-
ual plots become adept at understanding the differences between patterns that are reasonable
and patterns that indicate the assumptions of the model should be questioned. Aresidual plot
provides one technique to assess the validity of the assumptions for a regression model.
Residual Plot Against
Another residual plot represents the predicted value of the dependent variable on the hori-
zontal axis and the residual values on the vertical axis. Apoint is plotted for each residual. The
first coordinate for each point is given by
i
and the second coordinate is given by the corre-
sponding value of the ith residual y
i
i
. With the Armand’s data from Table 12.7, the co-
ordinates of the first point are (70, 12), corresponding to
1
70 and y
1
1
12; the
coordinates of the second point are (90, 15); and so on. Figure 12.13 provides the residual plot.
Note that the pattern of this residual plot is the same as the pattern of the residual plot against
the independent variable x. It is not a pattern that would lead us to question the model
assumptions. For simple linear regression, both the residual plot against xand the residual plot
against provide the same pattern. For multiple regression analysis, the residual plot against
is more widely used because of the presence of more than one independent variable.y
ˆ
y
ˆ
y
ˆ
y
ˆ
y
ˆ
y
ˆ
y
ˆ
y
ˆ
CH012.qxd 8/16/10 6:59 PM Page 531
Copyright 2010 Cengage Learning. All Rights Reserved. May not be copied, scanned, or duplicated, in whole or in part. Due to electronic rights, some third party content may be suppressed from the eBook and/or eChapter(s).
Editorial review has deemed that any suppressed content does not materially affect the overall learning experience. Cengage Learning reserves the right to remove additional content at any time if subsequent rights restrictions require it.
a. Develop an estimated regression equation for these data.
b. Construct a plot of the residuals. Do the assumptions about the error term seem to
be satisfied?
Applications
47. Data on advertising expenditures and revenue (in thousands of dollars) for the Four Sea-
sons Restaurant follow.
532 Chapter 12 Simple Linear Regression
test
SELF
Advertising Expenditures Revenue
119
232
444
640
10 52
14 53
20 54
NOTES AND COMMENTS
1. We use residual plots to validate the assump-
tions of a regression model. If our review
indicates that one or more assumptions are
questionable, a different regression model or a
transformation of the data should be considered.
The appropriate corrective action when the as-
sumptions are violated must be based on good
judgment; recommendations from an experi-
enced statistician can be valuable.
2. Analysis of residuals is the primary method
statisticians use to verify that the assumptions as-
sociated with a regression model are valid. Even
if no violations are found, it does not necessarily
follow that the model will yield good predictions.
However, if additional statistical tests support the
conclusion of significance and the coefficient of
determination is large, we should be able to de-
velop good estimates and predictions using the
estimated regression equation.
Exercises
Methods
45. Given are data for two variables, x and y.
x
i
611151820
y
i
6 8 12 20 30
a. Develop an estimated regression equation for these data.
b. Compute the residuals.
c. Develop a plot of the residuals against the independent variable x. Do the assumptions
about the error terms seem to be satisfied?
46. The following data were used in a regression study.
test
SELF
Observation x
i
y
i
Observation x
i
y
i
124 676
235 779
344 885
456 9911
574
CH012.qxd 8/16/10 6:59 PM Page 532
Copyright 2010 Cengage Learning. All Rights Reserved. May not be copied, scanned, or duplicated, in whole or in part. Due to electronic rights, some third party content may be suppressed from the eBook and/or eChapter(s).
Editorial review has deemed that any suppressed content does not materially affect the overall learning experience. Cengage Learning reserves the right to remove additional content at any time if subsequent rights restrictions require it.

Summary 533
a. Let xequal advertising expenditures and y equal revenue. Use the method of least squares
to develop a straight line approximation of the relationship between the two variables.
b. Test whether revenue and advertising expenditures are related at a .05 level of
significance.
c. Prepare a residual plot of y versus . Use the result from part (a) to obtain the
values of .
d. What conclusions can you draw from residual analysis? Should this model be used, or
should we look for a better one?
48. Refer to exercise 7, where an estimated regression equation relating years of experience
and annual sales was developed.
a. Compute the residuals and construct a residual plot for this problem.
b. Do the assumptions about the error terms seem reasonable in light of the residual plot?
49. Recent family home sales in San Antonio provided the following data (San Antonio Realty
Watch website, November 2008).
y
ˆ
y
ˆ
y
ˆ
Square Footage Price ($)
1580 142,500
1572 145,000
1352 115,000
2224 155,900
1556 95,000
1435 128,000
1438 100,000
1089 55,000
1941 142,000
1698 115,000
1539 115,000
1364 105,000
1979 155,000
2183 132,000
2096 140,000
1400 85,000
2372 145,000
1752 155,000
1386 80,000
1163 100,000
file
W
EB
HomePrices
a. Develop the estimated regression equation that can be used to predict the sales prices
given the square footage.
b. Construct a residual plot against the independent variable.
c. Do the assumptions about the error term and model form seem reasonable in light of
the residual plot?
Summary
Inthis chapterwe showedhow regression analysiscan beused to determinehow adependent
variable y is related to an independent variable x. In simple linear regression, the regression
modelisy β
0
β
1
x ⑀.Thesimple linear regression equation E(y) β
0
β
1
xdescribes
howthe mean or expected value of yis related to x.We usedsample data and the least squares
method to develop the estimated regression equation b
0
b
1
x. In effect, b
0
and b
1
are
the sample statistics used to estimate the unknown model parameters β
0
and β
1
.
The coefficient of determination was presented as a measure of the goodness of fit for
the estimated regression equation; it can be interpreted as the proportion of the variation in
y
ˆ
CH012.qxd 8/16/10 6:59 PM Page 533
Copyright 2010 Cengage Learning. All Rights Reserved. May not be copied, scanned, or duplicated, in whole or in part. Due to electronic rights, some third party content may be suppressed from the eBook and/or eChapter(s).
Editorial review has deemed that any suppressed content does not materially affect the overall learning experience. Cengage Learning reserves the right to remove additional content at any time if subsequent rights restrictions require it.

534 Chapter 12 Simple Linear Regression
the dependent variable y that can be explained by the estimated regression equation. We re-
viewed correlation as a descriptive measure of the strength of a linear relationship between
two variables.
The assumptions about the regression model and its associated error term ⑀ were
discussed, and t and F tests, based on those assumptions, were presented as a means for
determining whether the relationship between two variables is statistically significant. We
showed how to use the estimated regression equation to develop confidence interval
estimates of the mean value of y and prediction interval estimates of individual values of y.
The chapter concluded with a section on the computer solution of regression problems
and a section on the use of residual analysis to validate the model assumptions.
Glossary
Dependent variable The variable that is being predicted or explained. It is denoted by y.
Independent variable The variable that is doing the predicting or explaining. It is de-
noted by x.
Simple linear regression Regression analysis involving one independent variable and one
dependent variable in which the relationship between the variables is approximated by a
straight line.
Regression model The equation that describes how y is related to x and an error term; in
simple linear regression, the regression model is y β
0
β
1
x ⑀.
Regression equation The equation that describes how the mean or expected value of the
dependent variable is related to the independent variable; in simple linear regression,
E(y) β
0
β
1
x.
Estimated regression equation The estimate of the regression equation developed from
sample data by using the least squares method. For simple linear regression, the estimated
regression equation is b
0
b
1
x.
Least squares methodAprocedure used to develop the estimated regression equation. The
objective is to minimize 兺(y
i
i
)
2
.
Scatter diagramA graph of bivariate data in which the independent variable is on the hor-
izontal axis and the dependent variable is on the vertical axis.
Coefficient of determinationA measure of the goodness of fit of the estimated regression
equation. It can be interpreted as the proportion of the variability in the dependent variable
y that is explained by the estimated regression equation.
ith residual The difference between the observed value of the dependent variable and the
value predicted using the estimated regression equation; for the ith observation the ith resid-
ual is y
i
i
.
Correlation coefficient A measure of the strength of the linear relationship between two
variables (previously discussed in Chapter 3).
Mean square error The unbiased estimate of the variance of the error term σ
2
. It is denoted
by MSE or s
2
.
Standard error of the estimate The square root of the mean square error, denoted by s. It
is the estimate of σ, the standard deviation of the error term ⑀.
ANOVA table The analysis of variance table used to summarize the computations associ-
ated with the F test for significance.
Confidence interval The interval estimate of the mean value of y for a given value of x.
Prediction interval The interval estimate of an individual value of y for a given value of x.
Residual analysis The analysis of the residuals used to determine whether the assumptions
made about the regression model appear to be valid. Residual analysis is also used to iden-
tify outliers and influential observations.
y
ˆ
y
ˆ
y
ˆ
CH012.qxd 8/16/10 6:59 PM Page 534
Copyright 2010 Cengage Learning. All Rights Reserved. May not be copied, scanned, or duplicated, in whole or in part. Due to electronic rights, some third party content may be suppressed from the eBook and/or eChapter(s).
Editorial review has deemed that any suppressed content does not materially affect the overall learning experience. Cengage Learning reserves the right to remove additional content at any time if subsequent rights restrictions require it.