Anderson D.R., Sweeney D.J., Williams T.A. Essentials of Statistics for Business and Economics
Подождите немного. Документ загружается.


12.2 Least Squares Method 495
a. Develop a scatter diagram for these data with years of experience as the independent
variable.
b. Develop an estimated regression equation that can be used to predict annual sales
given the years of experience.
c. Use the estimated regression equation to predict annual sales for a salesperson with
9 years of experience.
8. Bergans of Norway has been making outdoor gear since 1908. The following data show
the temperature rating (F°) and the price ($) for 11 models of sleeping bags produced by
Bergans (Backpacker 2006 Gear Guide).
a. Develop a scatter diagram for these data with temperature rating (F
°) as the indepen-
dent variable.
b. What does the scatter diagram developed in part (a) indicate about the relationship
between temperature rating (F
°) and price?
c. Use the least squares method to develop the estimated regression equation.
d. Predict the price for a sleeping bag with a temperature rating (F
°) of 20.
9. To avoid extra checked-bag fees, airline travelers often pack as much as they can into their
suitcase. Finding a rolling suitcase that is durable, has good capacity, and is easy to
pull can be difficult. The following table shows the results of tests conducted by
Consumer Reports for 10 rolling suitcases; higher scores indicate better overall test results
(Consumer Reports website, October 2008).
Temperature
Model Rating (F
°) Price ($)
Ranger 3-Seasons 12 319
Ranger Spring 24 289
Ranger Winter 3 389
Rondane 3-Seasons 13 239
Rondane Summer 38 149
Rondane Winter 4 289
Senja Ice 5 359
Senja Snow 15 259
Senja Zero 25 229
Super Light 45 129
Tight & Light 25 199
Years of Annual Sales
Salesperson Experience ($1000s)
1180
2397
3492
4 4 102
5 6 103
6 8 111
710119
8 10 123
911117
10 13 136
7. A sales manager collected the following data on annual sales and years of experience.
file
W
EB
Sales
file
W
EB
SleepingBags
CH012.qxd 8/16/10 6:58 PM Page 495
Copyright 2010 Cengage Learning. All Rights Reserved. May not be copied, scanned, or duplicated, in whole or in part. Due to electronic rights, some third party content may be suppressed from the eBook and/or eChapter(s).
Editorial review has deemed that any suppressed content does not materially affect the overall learning experience. Cengage Learning reserves the right to remove additional content at any time if subsequent rights restrictions require it.

496 Chapter 12 Simple Linear Regression
a. Develop a scatter diagram with price as the independent variable.
b. What does the scatter diagram developed in part (a) indicate about the relationship
between the two variables?
c. Use the least squares method to develop the estimated regression equation.
d. Provide an interpretation for the slope of the estimated regression equation.
e. The Eagle Creek Hovercraft suitcase has a price of $225. Predict the score for this suit-
case using the estimated regression equation developed in part (c).
10. According to Advertising Age’s annual salary review, Mark Hurd, the 49-year-old chairman,
president, and CEO of Hewlett-Packard Co., received an annual salary of $817,000, a bonus
of more than $5 million, and other compensation exceeding $17 million. His total compen-
sation was slightly better than the average CEO total pay of $12.4 million. The following
table shows the age and annual salary (in thousands of dollars) for Mark Hurd and 14 other
executives who led publicly held companies (Advertising Age, December 5, 2006).
Brand Price ($) Score
Briggs & Riley 325 72
Hartman 350 74
Heys 67 54
Kenneth Cole Reaction 120 54
Liz Claiborne 85 64
Samsonite 180 57
Titan 360 66
TravelPro 156 67
Tumi 595 87
Victorinox 400 77
a. Develop a scatter diagram for these data with the age of the executive as the indepen-
dent variable.
b. What does the scatter diagram developed in part (a) indicate about the relationship
between the two variables?
c. Develop the least squares estimated regression equation.
d. Suppose Bill Gustin is the 72-year-old chairman, president, and CEO of a major elec-
tronics company. Predict the annual salary for Bill Gustin.
file
W
EB
Suitcases
file
W
EB
ExecSalary
Salary
Executive Title Company Age ($1000s)
Charles Prince Chmn/CEO Citigroup 56 1000
Harold McGraw III Chmn/Pres/CEO McGraw-Hill Cos. 57 1172
James Dimon Pres/CEO JP Morgan Chase & Co. 50 1000
K. Rupert Murdoch Chmn/CEO News Corp. 75 4509
Kenneth D. Lewis Chmn/Pres/CEO Bank of America 58 1500
Kenneth I. Chenault Chmn/CEO American Express Co. 54 1092
Louis C. Camilleri Chmn/CEO Altria Group 51 1663
Mark V. Hurd Chmn/Pres/CEO Hewlett-Packard Co. 49 817
Martin S. Sorrell CEO WPP Group 61 1562
Robert L. Nardelli Chmn/Pres/CEO Home Depot 57 2164
Samuel J. Palmisano Chmn/Pres/CEO IBM Corp. 55 1680
David C. Novak Chmn/Pres/CEO Yum Brands 53 1173
Henry R. Silverman Chmn/CEO Cendant Corp. 65 3300
Robert C. Wright Chmn/CEO NBC Universal 62 2500
Sumner Redstone Exec Chmn/Founder Viacom 82 5807
CH012.qxd 8/16/10 6:58 PM Page 496
Copyright 2010 Cengage Learning. All Rights Reserved. May not be copied, scanned, or duplicated, in whole or in part. Due to electronic rights, some third party content may be suppressed from the eBook and/or eChapter(s).
Editorial review has deemed that any suppressed content does not materially affect the overall learning experience. Cengage Learning reserves the right to remove additional content at any time if subsequent rights restrictions require it.

12.2 Least Squares Method 497
a. Develop a scatter diagram with price as the independent variable.
b. What does the scatter diagram developed in part (a) indicate about the relationship
between the two variables?
c. Use the least squares method to develop the estimated regression equation.
d. Provide an interpretation for the slope of the estimated regression equation.
e. Another sporty car that Consumer Reports tested is the BMW 135i; the price for this
car was $36,700. Predict the road-test score for the BMW 135i using the estimated
regression equation developed in part (c).
12. A personal watercraft (PWC) is a vessel propelled by water jets, designed to be operated
by a person sitting, standing, or kneeling on the vessel. In the early 1970s, Kawasaki
Motors Corp. U.S.A. introduced the JET SKI
®
watercraft, the first commercially success-
ful PWC. Today, jetski is commonly used as a generic term for personal watercraft. The
following data show the weight (rounded to the nearest 10 lbs.) and the price (rounded to
the nearest $50) for 10 three-seater personal watercraft (Jetski News website, 2006).
Make and Model Weight (lbs.) Price ($)
Honda AquaTrax F-12 750 9500
Honda AquaTrax F-12X 790 10500
Honda AquaTrax F-12X GPScape 800 11200
Kawasaki STX-12F Jetski 740 8500
Yamaha FX Cruiser Waverunner 830 10000
Yamaha FX High Output Waverunner 770 10000
Yamaha FX Waverunner 830 9300
Yamaha VX110 Deluxe Waverunner 720 7700
Yamaha VX110 Sport Waverunner 720 7000
Yamaha XLT1200 Waverunner 780 8500
Car Price ($1000s) Road-Test Score
Chevrolet Cobalt SS 24.5 78
Dodge Caliber SRT4 24.9 56
Ford Mustang GT (V8) 29.0 73
Honda Civic Si 21.7 78
Mazda RX-8 31.3 86
Mini Cooper S 26.4 74
Mitsubishi Lancer Evolution GSR 38.1 83
Nissan Sentra SE-R Spec V 23.3 66
Suburu Impreza WRX 25.2 81
Suburu Impreza WRX Sti 37.6 89
Volkswagen GTI 24.0 83
Volkswagen R32 33.6 83
file
W
EB
SportyCars
file
W
EB
JetSki
a. Develop a scatter diagram for these data with weight as the independent variable.
b. What does the scatter diagram developed in part (a) indicate about the relationship
between weight and price?
c. Use the least squares method to develop the estimated regression equation.
d. Predict the price for a three-seater PWC with a weight of 750 pounds.
11. Sporty cars are designed to provide better handling, acceleration, and a more responsive driv-
ing experience than a typical sedan. But, even within this select group of cars, performance
as well as price can vary. Consumer Reports provided road-test scores and prices for the fol-
lowing 12 sporty cars (Consumer Reports website, October 2008). Prices are in thousands
of dollars and road-test scores are based on a 0–100 rating scale, with higher values indi-
cating better performance.
CH012.qxd 8/16/10 6:58 PM Page 497
Copyright 2010 Cengage Learning. All Rights Reserved. May not be copied, scanned, or duplicated, in whole or in part. Due to electronic rights, some third party content may be suppressed from the eBook and/or eChapter(s).
Editorial review has deemed that any suppressed content does not materially affect the overall learning experience. Cengage Learning reserves the right to remove additional content at any time if subsequent rights restrictions require it.

498 Chapter 12 Simple Linear Regression
e. The Honda AquaTrax F-12 weighs 750 pounds and has a price of $9500. Shouldn’t
the predicted price you developed in part (d) for a PWC with a weight of 750 pounds
also be $9500?
f. The Kawasaki SX-R 800 Jetski has a seating capacity of one and weighs 350 pounds.
Do you think the estimated regression equation developed in part (c) should be used
to predict the price for this model?
13. To the Internal Revenue Service, the reasonableness of total itemized deductions depends
on the taxpayer’s adjusted gross income. Large deductions, which include charity and
medical deductions, are more reasonable for taxpayers with large adjusted gross incomes.
If a taxpayer claims larger than average itemized deductions for a given level of income,
the chances of an
IRS audit are increased. Data (in thousands of dollars) on adjusted gross
income and the average or reasonable amount of itemized deductions follow.
file
WEB
Laptop
Reasonable Amount of
Adjusted Gross Income ($1000s) Itemized Deductions ($1000s)
22 9.6
27 9.6
32 10.1
48 11.1
65 13.5
85 17.7
120 25.5
Features PCW World
Model Rating Rating
Thinkpad X200 87 83
VGN-Z598U 85 82
U6V 80 81
Elitebook 2530P 75 78
X360 80 78
Thinkpad X300 76 78
Ideapad U110 81 77
Micro Express JFT2500 73 75
Toughbook W7 79 73
HP Voodoo Envy133 68 72
a. Develop a scatter diagram for these data with adjusted gross income as the indepen-
dent variable.
b. Use the least squares method to develop the estimated regression equation.
c. Estimate a reasonable level of total itemized deductions for a taxpayer with an
adjusted gross income of $52,500. If this taxpayer claimed itemized deductions of
$20,400, would the
IRS agent’s request for an audit appear justified? Explain.
14. PCWorld rated four component characteristics for 10 ultraportable laptop computers: fea-
tures, performance, design, and price. Each characteristic was rated using a 0–100 point
scale. An overall rating, referred to as the PCW World Rating, was then developed for
each laptop. The following table shows the features rating and the PCW World Rating for
the 10 laptop computers (PC World website, February 5, 2009).
a. Develop a scatter diagram with the features rating as the independent variable.
b. What does the scatter diagram developed in part (a) indicate about the relationship
between the two variables?
c. Use the least squares method to develop the estimated regression equation.
d. Estimate the PCW World Rating for a new laptop computer that has a features rating
of 70.
CH012.qxd 8/16/10 6:58 PM Page 498
Copyright 2010 Cengage Learning. All Rights Reserved. May not be copied, scanned, or duplicated, in whole or in part. Due to electronic rights, some third party content may be suppressed from the eBook and/or eChapter(s).
Editorial review has deemed that any suppressed content does not materially affect the overall learning experience. Cengage Learning reserves the right to remove additional content at any time if subsequent rights restrictions require it.

12.3 Coefficient of Determination
For the Armand’s Pizza Parlors example, we developed the estimated regression equation
60 5x to approximate the linear relationship between the size of the student popula-
tion x and quarterly sales y. A question now is, How well does the estimated regression
equation fit the data? In this section, we show that the coefficient of determination pro-
vides a measure of the goodness of fit for the estimated regression equation.
For the ith observation, the difference between the observed value of the dependent
variable, y
i
, and the estimated value of the dependent variable, , is called the ith residual.
The ith residual represents the error in using to estimate y
i
. Thus, for the ith observation,y
ˆ
i
y
ˆ
i
y
ˆ
The value of
SSE is a measure of the error in using the estimated regression equation to
estimate the values of the dependent variable in the sample.
In Table 12.3 we show the calculations required to compute the sum of squares due to
error for the Armand’s Pizza Parlors example. For instance, for restaurant 1 the values of
the independent and dependent variables are x
1
2 and y
1
58. Using the estimated
regression equation, we find that the estimated value of quarterly sales for restaurant 1 is
60 5(2) 70. Thus, the error in using to estimate y
1
for restaurant 1 is y
1
y
ˆ
1
y
ˆ
1
y
ˆ
1
x
i
ⴝ Student y
i
ⴝ Quarterly Predicted Squared
Restaurant Population Sales Sales Error Error
i (1000s) ($1000s) ⴝ 60 ⴙ 5x
i
1 2 58 70 12 144
2 6 105 90 15 225
3 8 88 100 12 144
4 8 118 100 18 324
5 12 117 120 39
6 16 137 140 39
7 20 157 160 39
8 20 169 160 9 81
9 22 149 170 21 441
10 26 202 190 12 144
SSE 1530
(y
i
ⴚ y
ˆ
i
)
2
y
i
ⴚ y
ˆ
i
y
ˆ
i
TABLE 12.3 CALCULATION OF SSE FOR ARMAND’S PIZZA PARLORS
SUM OF SQUARES DUE TO ERROR
(12.8)SSE 兺( y
i
y
ˆ
i
)
2
12.3 Coefficient of Determination 499
58 70 12. The squared error, (12)
2
144, is shown in the last column of Table 12.3.
After computing and squaring the residuals for each restaurant in the sample, we sum
them to obtain SSE 1530. Thus, SSE 1530 measures the error in using the estimated
regression equation 60 5x to predict sales.
Now suppose we are asked to develop an estimate of quarterly sales without knowledge
of the size of the student population. Without knowledge of any related variables, we would
y
ˆ
the residual is y
i
. The sum of squares of these residuals or errors is the quantity that is
minimized by the least squares method. This quantity, also known as the sum of squares due
to error, is denoted by SSE.
y
ˆ
i
CH012.qxd 8/16/10 6:58 PM Page 499
Copyright 2010 Cengage Learning. All Rights Reserved. May not be copied, scanned, or duplicated, in whole or in part. Due to electronic rights, some third party content may be suppressed from the eBook and/or eChapter(s).
Editorial review has deemed that any suppressed content does not materially affect the overall learning experience. Cengage Learning reserves the right to remove additional content at any time if subsequent rights restrictions require it.

500 Chapter 12 Simple Linear Regression
use the sample mean as an estimate of quarterly sales at any given restaurant. Table 12.2
showed that for the sales data, 兺y
i
1300. Hence, the mean value of quarterly sales for the
sample of 10 Armand’s restaurants is 兺y
i
/n 1300/10 130. In Table 12.4 we show
the sum of squared deviations obtained by using the sample mean 130 to estimate the
value of quarterly sales for each restaurant in the sample. For the ith restaurant in the sam-
ple, the difference y
i
provides a measure of the error involved in using to estimate
sales. The corresponding sum of squares, called the total sum of squares, is denoted SST.
y¯y¯
y¯
y¯
The sum at the bottom of the last column in Table 12.4 is the total sum of squares for
Armand’s Pizza Parlors; it is SST 15,730.
In Figure 12.5 we show the estimated regression line 60 5x and the line corre-
sponding to 130. Note that the points cluster more closely around the estimated re-
gression line than they do about the line 130. For example, for the 10th restaurant in
the sample we see that the error is much larger when 130 is used as an estimate of y
10
than when 60 5(26) 190 is used. We can think of SST as a measure of how well
the observations cluster about the line and SSE as a measure of how well the observations
cluster about the line.
To measure how much the values on the estimated regression line deviate from ,
another sum of squares is computed. This sum of squares, called the sum of squares due to
regression, is denoted SSR.
y¯y
ˆ
y
ˆ
y¯
y
ˆ
10
y¯
y¯
y¯
y
ˆ
x
i
ⴝ Student y
i
ⴝ Quarterly Squared
Restaurant Population Sales Deviation Deviation
i (1000s) ($1000s) y
i
ⴚ (y
i
ⴚ )
2
12 5872 5,184
2 6 105 25 625
38 8842 1,764
4811812 144
512 11713 169
6 16 137 7 49
7 20 157 27 729
8 20 169 39 1,521
9 22 149 19 361
10 26 202 72 5,184
SST 15,730
y¯y¯
TABLE 12.4 COMPUTATION OF THE TOTAL SUM OF SQUARES FOR ARMAND’S
PIZZA PARLORS
TOTAL SUM OF SQUARES
(12.9)
SST 兺( y
i
y¯)
2
SUM OF SQUARES DUE TO REGRESSION
(12.10)
SSR 兺( y
ˆ
i
y¯)
2
With SST 15,730 and
SSE 1530, the estimated
regression line provides a
much better fit to the data
than the line y .y¯
CH012.qxd 8/16/10 6:58 PM Page 500
Copyright 2010 Cengage Learning. All Rights Reserved. May not be copied, scanned, or duplicated, in whole or in part. Due to electronic rights, some third party content may be suppressed from the eBook and/or eChapter(s).
Editorial review has deemed that any suppressed content does not materially affect the overall learning experience. Cengage Learning reserves the right to remove additional content at any time if subsequent rights restrictions require it.
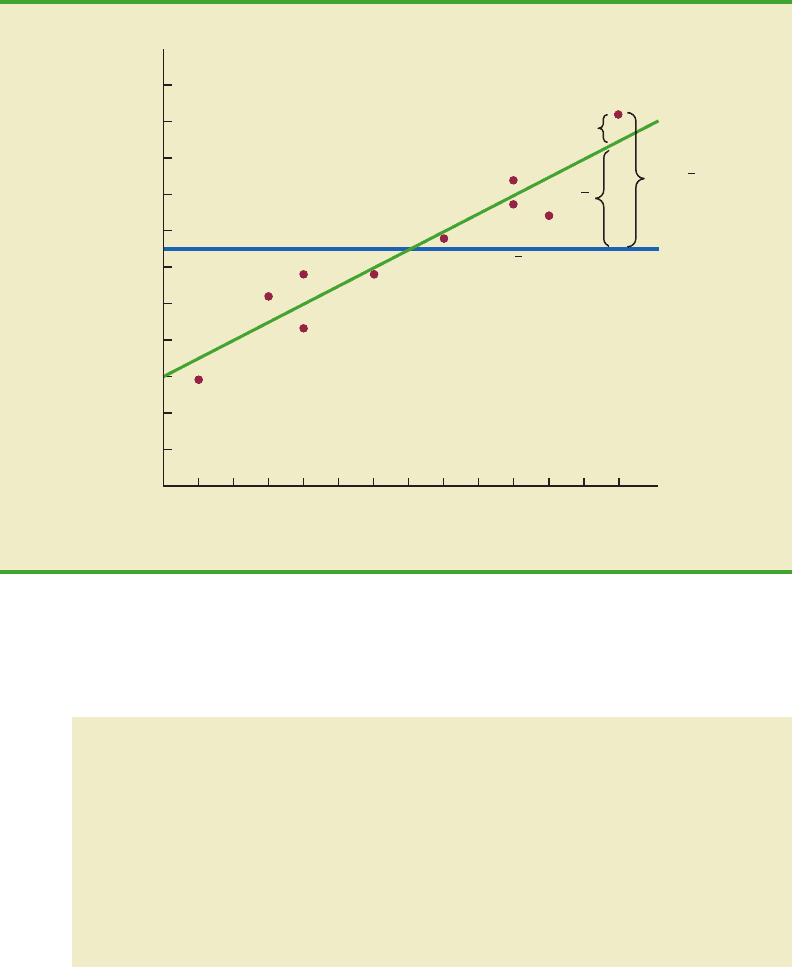
12.3 Coefficient of Determination 501
20
40
80
100
120
140
160
180
200
220
Quarterly Sales ($1000s)
6024 1481012 2216 18 20 24 26
Student Population (1000s)
x
y
60
y = 60 + 5x
y
10
– y
y
10
– y
y = y = 130
y
10
– y
10
^
^
^
FIGURE 12.5 DEVIATIONS ABOUT THE ESTIMATED REGRESSION LINE AND THE LINE
FOR ARMAND’S PIZZA PARLORSy y¯
From the preceding discussion, we should expect that SST, SSR, and SSE are related.
Indeed, the relationship among these three sums of squares provides one of the most im-
portant results in statistics.
RELATIONSHIPAMONG SST, SSR, AND SSE
(12.11)
where
SST
SSR
SSE
total sum of squares
sum of squares due to regression
sum of squares due to error
SST SSR SSE
SSR can be thought of as
the explained portion of
SST, and SSE can be
thought of as the
unexplained portion of SST.
Equation (12.11) shows that the total sum of squares can be partitioned into two compo-
nents, the sum of squares due to regression and the sum of squares due to error. Hence, if
the values of any two of these sum of squares are known, the third sum of squares can be
computed easily. For instance, in the Armand’s Pizza Parlors example, we already know
that SSE 1530 and SST 15,730; therefore, solving for SSR in equation (12.11), we find
that the sum of squares due to regression is
SSR SST SSE 15,730 1530 14,200
CH012.qxd 8/16/10 6:58 PM Page 501
Copyright 2010 Cengage Learning. All Rights Reserved. May not be copied, scanned, or duplicated, in whole or in part. Due to electronic rights, some third party content may be suppressed from the eBook and/or eChapter(s).
Editorial review has deemed that any suppressed content does not materially affect the overall learning experience. Cengage Learning reserves the right to remove additional content at any time if subsequent rights restrictions require it.

502 Chapter 12 Simple Linear Regression
Now let us see how the three sums of squares, SST, SSR, and SSE, can be used to pro-
vide a measure of the goodness of fit for the estimated regression equation. The estimated
regression equation would provide a perfect fit if every value of the dependent variable y
i
happened to lie on the estimated regression line. In this case, y
i
would be zero for eachy
ˆ
i
For the Armand’s Pizza Parlors example, the value of the coefficient of determination is
When we express the coefficient of determination as a percentage, r
2
can be interpreted as
the percentage of the total sum of squares that can be explained by using the estimated re-
gression equation. For Armand’s Pizza Parlors, we can conclude that 90.27% of the total
sum of squares can be explained by using the estimated regression equation 60 5x
to predict quarterly sales. In other words, 90.27% of the variability in sales can be explained
by the linear relationship between the size of the student population and sales. We should
be pleased to find such a good fit for the estimated regression equation.
Correlation Coefficient
In Chapter 3 we introduced the correlation coefficient as a descriptive measure of the
strength of linear association between two variables, x and y. Values of the correlation co-
efficient are always between 1 and 1. A value of 1 indicates that the two variables x
and y are perfectly related in a positive linear sense. That is, all data points are on a straight
line that has a positive slope. A value of 1 indicates that x and y are perfectly related in a
negative linear sense, with all data points on a straight line that has a negative slope. Val-
ues of the correlation coefficient close to zero indicate that x and y are not linearly related.
In Section 3.5 we presented the equation for computing the sample correlation coeffi-
cient. If a regression analysis has already been performed and the coefficient of determina-
tion r
2
computed, the sample correlation coefficient can be computed as follows.
y
ˆ
r
2
SSR
SST
14,200
15,730
.9027
COEFFICIENT OF DETERMINATION
(12.12)r
2
SSR
SST
SAMPLE CORRELATION COEFFICIENT
(12.13)
r
xy
(sign of b
1
)
兹
Coefficient of determination
(sign of b
1
)
兹
r
2
observation, resulting in SSE 0. Because SST SSR SSE, we see that for a perfect fit
SSR must equal SST, and the ratio (SSR/SST) must equal one. Poorer fits will result in larger
values for SSE. Solving for SSE in equation (12.11), we see that SSE SST SSR. Hence,
the largest value for SSE (and hence the poorest fit) occurs when SSR 0 and SSE SST.
The ratio SSR/SST, which will take values between zero and one, is used to evaluate
the goodness of fit for the estimated regression equation. This ratio is called the coefficient
of determination and is denoted by r
2
.
CH012.qxd 8/16/10 6:58 PM Page 502
Copyright 2010 Cengage Learning. All Rights Reserved. May not be copied, scanned, or duplicated, in whole or in part. Due to electronic rights, some third party content may be suppressed from the eBook and/or eChapter(s).
Editorial review has deemed that any suppressed content does not materially affect the overall learning experience. Cengage Learning reserves the right to remove additional content at any time if subsequent rights restrictions require it.
12.3 Coefficient of Determination 503
where
b
1
the slope of the estimated regression equation y
ˆ
b
0
b
1
x
The sign for the sample correlation coefficient is positive if the estimated regression equa-
tion has a positive slope (b
1
0) and negative if the estimated regression equation has a
negative slope (b
1
0).
For the Armand’s Pizza Parlor example, the value of the coefficient of determination
corresponding to the estimated regression equation 60 5x is .9027. Because the
slope of the estimated regression equation is positive, equation (12.13) shows that the
sample correlation coefficient is With a sample correlation co-
efficient of r
xy
.9501, we would conclude that a strong positive linear association
exists between x and y.
In the case of a linear relationship between two variables, both the coefficient of deter-
mination and the sample correlation coefficient provide measures of the strength of the re-
lationship. The coefficient of determination provides a measure between zero and one,
whereas the sample correlation coefficient provides a measure between 1 and 1. Al-
though the sample correlation coefficient is restricted to a linear relationship between two
variables, the coefficient of determination can be used for nonlinear relationships and for
relationships that have two or more independent variables. Thus, the coefficient of deter-
mination provides a wider range of applicability.
兹
.9027 .9501.
y
ˆ
test
SELF
NOTES AND COMMENTS
1. In developing the least squares estimated re-
gression equation and computing the coefficient
of determination, we made no probabilistic as-
sumptions about the error term , and no statis-
tical tests for significance of the relationship
between x and y were conducted. Larger values
of r
2
imply that the least squares line provides a
better fit to the data; that is, the observations are
more closely grouped about the least squares
line. But, using only r
2
, we can draw no conclu-
sion about whether the relationship between x
and y is statistically significant. Such a conclu-
sion must be based on considerations that in-
volve the sample size and the properties of the
appropriate sampling distributions of the least
squares estimators.
2. As a practical matter, for typical data found in
the social sciences, values of r
2
as low as .25 are
often considered useful. For data in the physical
and life sciences, r
2
values of .60 or greater are
often found; in fact, in some cases, r
2
values
greater than .90 can be found. In business appli-
cations, r
2
values vary greatly, depending on the
unique characteristics of each application.
Exercises
Methods
15. The data from exercise 1 follow.
x
i
12345
y
i
3751114
The estimated regression equation for these data is .20 2.60x.
a. Compute
SSE, SST, and SSR using equations (12.8), (12.9), and (12.10).
b. Compute the coefficient of determination r
2
. Comment on the goodness of fit.
c. Compute the sample correlation coefficient.
y
ˆ
CH012.qxd 8/16/10 6:58 PM Page 503
Copyright 2010 Cengage Learning. All Rights Reserved. May not be copied, scanned, or duplicated, in whole or in part. Due to electronic rights, some third party content may be suppressed from the eBook and/or eChapter(s).
Editorial review has deemed that any suppressed content does not materially affect the overall learning experience. Cengage Learning reserves the right to remove additional content at any time if subsequent rights restrictions require it.
504 Chapter 12 Simple Linear Regression
16. The data from exercise 2 follow.
x
i
3 12 6 20 14
y
i
55 40 55 10 15
The estimated regression equation for these data is 68 3x.
a. Compute
SSE, SST, and SSR.
b. Compute the coefficient of determination r
2
. Comment on the goodness of fit.
c. Compute the sample correlation coefficient.
17. The data from exercise 3 follow.
x
i
2 691320
y
i
71892623
The estimated regression equation for these data is 7.6 .9x. What percentage of the
total sum of squares can be accounted for by the estimated regression equation? What is
the value of the sample correlation coefficient?
Applications
18. The following data are the monthly salaries y and the grade point averages x for students
who obtained a bachelor’s degree in business administration with a major in information
systems. The estimated regression equation for these data is 1790.5 581.1x.y
ˆ
y
ˆ
y
ˆ
a. Compute
SST, SSR, and SSE.
b. Compute the coefficient of determination r
2
. Comment on the goodness of fit.
c. What is the value of the sample correlation coefficient?
19. In exercise 7 a sales manager collected the following data on x annual sales and
y years of experience. The estimated regression equation for these data is 80 4x.y
ˆ
test
SELF
GPA Monthly Salary ($)
2.6 3300
3.4 3600
3.6 4000
3.2 3500
3.5 3900
2.9 3600
Annual
Years of Sales
Salesperson Experience ($1000s)
1180
2397
3492
4 4 102
5 6 103
6 8 111
710119
8 10 123
911117
10 13 136
file
WEB
Sales
CH012.qxd 8/16/10 6:59 PM Page 504
Copyright 2010 Cengage Learning. All Rights Reserved. May not be copied, scanned, or duplicated, in whole or in part. Due to electronic rights, some third party content may be suppressed from the eBook and/or eChapter(s).
Editorial review has deemed that any suppressed content does not materially affect the overall learning experience. Cengage Learning reserves the right to remove additional content at any time if subsequent rights restrictions require it.