Anderson D.R., Sweeney D.J., Williams T.A. Essentials of Statistics for Business and Economics
Подождите немного. Документ загружается.

Exercises
Methods
23. The data from exercise 1 follow.
x
i
123 4 5
y
i
3751114
a. Compute the mean square error using equation (12.15).
b. Compute the standard error of the estimate using equation (12.16).
c. Compute the estimated standard deviation of b
1
using equation (12.18).
d. Use the t test to test the following hypotheses (α .05):
e. Use the F test to test the hypotheses in part (d) at a .05 level of significance. Present
the results in the analysis of variance table format.
24. The data from exercise 2 follow.
x
i
3 12 6 20 14
y
i
55 40 55 10 15
a. Compute the mean square error using equation (12.15).
b. Compute the standard error of the estimate using equation (12.16).
c. Compute the estimated standard deviation of b
1
using equation (12.18).
d. Use the t test to test the following hypotheses (α .05):
e. Use the F test to test the hypotheses in part (d) at a .05 level of significance. Present
the results in the analysis of variance table format.
25. The data from exercise 3 follow.
x
i
2 691320
y
i
7 18 9 26 23
a. What is the value of the standard error of the estimate?
b. Test for a significant relationship by using the t test. Use α .05.
c. Use the Ftest to test for a significant relationship. Use α .05. What is your conclusion?
Applications
26. In exercise 18 the data on grade point average and monthly salary were as follows.
H
0
:
H
a
:
β
1
0
β
1
0
H
0
:
H
a
:
β
1
0
β
1
0
12.5 Testing for Significance 515
test
SELF
GPA Monthly Salary ($) GPA Monthly Salary ($)
2.6 3300 3.2 3500
3.4 3600 3.5 3900
3.6 4000 2.9 3600
test
SELF
CH012.qxd 8/16/10 6:59 PM Page 515
Copyright 2010 Cengage Learning. All Rights Reserved. May not be copied, scanned, or duplicated, in whole or in part. Due to electronic rights, some third party content may be suppressed from the eBook and/or eChapter(s).
Editorial review has deemed that any suppressed content does not materially affect the overall learning experience. Cengage Learning reserves the right to remove additional content at any time if subsequent rights restrictions require it.

516 Chapter 12 Simple Linear Regression
a. Does the t test indicate a significant relationship between grade point average and
monthly salary? What is your conclusion? Use α .05.
b. Test for a significant relationship using the F test. What is your conclusion? Use
α .05.
c. Show the
ANOVA table.
27. The number of megapixels in a digital camera is one of the most important factors in de-
termining picture quality. But, do digital cameras with more megapixels cost more? The
following data show the number of megapixels and the price ($) for 10 digital cameras
(Consumer Reports, March 2009).
a. Use these data to develop an estimated regression equation that can be used to predict
the price of a digital camera given the number of megapixels.
b. At the .05 level of significance, are the number of megapixels and the price related?
Explain.
c. Would you feel comfortable using the estimated regression equation developed in part
(a) to predict the price of a digital camera given the number of megapixels? Explain.
d. The Kodak EasyShare Z1012 IS digital camera has 10 megapixels. Predict the price
of this camera using the estimated regression equation developed in part (a).
28. In exercise 8, data on x temperature rating (F) and y price ($) for 11 sleeping bags
manufactured by Bergans of Norway provided the estimated regression equation
359.2668 5.2772x. At the .05 level of significance, test whether temperature rating and
price are related. Show the ANOVA table. What is your conclusion?
29. Refer to exercise 21, where data on production volume and cost were used to develop an
estimated regression equation relating production volume and cost for a particular manu-
facturing operation. Use α .05 to test whether the production volume is significantly
related to the total cost. Show the
ANOVA table. What is your conclusion?
30. Refer to excercise 5, where the following data were used to investigate whether higher
prices are generally associated with higher ratings for elliptical trainers (Consumer
Reports, February 2008).
y
ˆ
Brand and Model Megapixels Price ($)
Canon PowerShot SD1100 IS 8 180
Casio Exilim Card EX-510 10 200
Sony Cyber-shot DSC-T70 7 230
Pentax Optio M50 8 120
Canon PowerShot G10 15 470
Canon PowerShot A590 IS 8 140
Canon PowerShot E1 10 180
Fujifilm FinePix F00FD 12 310
Sony Cyber-shot DSC-W170 10 250
Canon PowerShot A470 7 110
file
W
EB
DigitalCameras
file
W
EB
SleepingBags
Brand and Model Price ($) Rating
Precor 5.31 3700 87
Keys Fitness CG2 2500 84
Octane Fitness Q37e 2800 82
LifeFitness X1 Basic 1900 74
NordicTrack AudioStrider 990 1000 73
Schwinn 430 800 69
Vision Fitness X6100 1700 68
ProForm XP 520 Razor 600 55
file
W
EB
Ellipticals
CH012.qxd 8/16/10 6:59 PM Page 516
Copyright 2010 Cengage Learning. All Rights Reserved. May not be copied, scanned, or duplicated, in whole or in part. Due to electronic rights, some third party content may be suppressed from the eBook and/or eChapter(s).
Editorial review has deemed that any suppressed content does not materially affect the overall learning experience. Cengage Learning reserves the right to remove additional content at any time if subsequent rights restrictions require it.

With x price ($) and y rating, the estimated regression equation is 58.158 y
ˆ
.008449x. For these data, SSE 173.88 and SST 756. Does the evidence indicate a sig-
nificant relationship between price and rating?
31. In exercise 20, data on x
price ($) and y overall score for ten 42-inch plasma televi-
sions tested by Consumer Reports provided the estimated regression equation
12.0169 y
ˆ
.0127x. For these data SSE 540.04 and SST 982.40. Use the F test to determine
whether the price for a 42-inch plasma television and the overall score are related at the
.05 level of significance.
12.6 Using the Estimated Regression Equation
for Estimation and Prediction
When using the simple linear regression model we are making an assumption about the re-
lationship between x and y. We then use the least squares method to obtain the estimated
simple linear regression equation. If a significant relationship exists between x and y, and
the coefficient of determination shows that the fit is good, the estimated regression equa-
tion should be useful for estimation and prediction.
Point Estimation
In the Armand’s Pizza Parlors example, the estimated regression equation 60 5x
provides an estimate of the relationship between the size of the student population x and
quarterly sales y. We can use the estimated regression equation to develop a point esti-
mate of the mean value of y for a particular value of x or to predict an individual value of
y corresponding to a given value of x. For instance, suppose Armand’s managers want a
point estimate of the mean quarterly sales for all restaurants located near college cam-
puses with 10,000 students. Using the estimated regression equation 60 5x, we see
that for x 10 (or 10,000 students), 60 5(10) 110. Thus, a point estimate of the
mean quarterly sales for all restaurants located near campuses with 10,000 students is
$110,000.
Now suppose Armand’s managers want to predict sales for an individual restaurant lo-
cated near Talbot College, a school with 10,000 students. In this case we are not interested
in the mean value for all restaurants located near campuses with 10,000 students; we are
just interested in predicting quarterly sales for one individual restaurant. As it turns out, the
point estimate for an individual value of y is the same as the point estimate for the mean
value of y. Hence, we would predict quarterly sales of 60 5(10) 110 or $110,000
for this one restaurant.
Interval Estimation
Point estimates do not provide any information about the precision associated with an esti-
mate. For that we must develop interval estimates much like those in Chapters 8, 10, and
11. The first type of interval estimate, a confidence interval, is an interval estimate of the
mean value of y for a given value of x. The second type of interval estimate, a prediction
interval, is used whenever we want an interval estimate of an individual value of y for a
given value of x. The point estimate of the mean value of y is the same as the prediction of
an individual value of y. But the interval estimates we obtain for the two cases are differ-
ent. The margin of error is larger for a prediction interval.
y
ˆ
y
ˆ
y
ˆ
y
ˆ
12.6 Using the Estimated Regression Equation for Estimation and Prediction 517
Confidence intervals and
prediction intervals show the
precision of the regression
results. Narrower intervals
provide a higher degree of
precision.
CH012.qxd 8/16/10 6:59 PM Page 517
Copyright 2010 Cengage Learning. All Rights Reserved. May not be copied, scanned, or duplicated, in whole or in part. Due to electronic rights, some third party content may be suppressed from the eBook and/or eChapter(s).
Editorial review has deemed that any suppressed content does not materially affect the overall learning experience. Cengage Learning reserves the right to remove additional content at any time if subsequent rights restrictions require it.

518 Chapter 12 Simple Linear Regression
Confidence Interval for the Mean Value of y
The estimated regression equation provides a point estimate of the mean value of y for a
given value of x. In developing the confidence interval, we will use the following notation.
Using this notation to estimate the mean sales for all Armand’s restaurants located near a
campus with 10,000 students, we have x
p
10, and E(y
p
) denotes the unknown mean value
of sales for all restaurants where x
p
10. The point estimate of E(y
p
) is provided by
60 5(10) 110.
In general, we cannot expect to equal E(y
p
) exactly. If we want to make an inference
about how close is to the true mean value E(y
p
), we will have to estimate the variance of
. The formula for estimating the variance of given x
p
, denoted by , is
(12.22)
The estimate of the standard deviation of is given by the square root of equation (12.22).
(12.23)
The computational results for Armand’s Pizza Parlors in Section 12.5 provided s
13.829. With x
p
10, 14, and 兺(x
i
)
2
568, we can use equation (12.23) to obtain
The general expression for a confidence interval follows.
13.829
兹
.1282 4.95
s
y
ˆ
p
13.829
冑
1
10
(10 14)
2
568
x¯x¯
s
y
ˆ
p
s
冑
1
n
(x
p
x¯)
2
兺(x
i
x¯)
2
y
ˆ
p
s
2
y
ˆ
p
s
2
冤
1
n
(x
p
x¯)
2
兺(x
i
x¯)
2
冥
s
2
y
ˆ
p
y
ˆ
p
y
ˆ
p
y
ˆ
p
y
ˆ
p
y
ˆ
p
y
ˆ
p
b
0
b
1
x
p
the point estimate of E(y
p
) when x x
p
E(y
p
)
the mean or expected value of the dependent variable y
corresponding to the given x
p
y
p
the value of the dependent variable y corresponding to the given x
p
x
p
the particular or given value of the independent variable x
CONFIDENCE INTERVAL FOR E(y
p
)
(12.24)
where the confidence coefficient is 1 α and t
α/2
is based on a t distribution with
n 2 degrees of freedom.
y
ˆ
p
t
α/2
s
y
ˆ
p
The margin of error
associated with this
confidence interval is
.t
α/2
s
y
ˆ
p
Using expression (12.24) to develop a 95% confidence interval of the mean quarterly
sales for all Armand’s restaurants located near campuses with 10,000 students, we need the
value of t for α/2 .025 and n 2 10 2 8 degrees of freedom. Using Table 2 of
Appendix B, we have t
.025
2.306. Thus, with 110 and a margin of error of t
α
/2
s
y
ˆ
p
y
ˆ
p
2.306(4.95) 11.415, the 95% confidence interval estimate is
110
11.415
CH012.qxd 8/16/10 6:59 PM Page 518
Copyright 2010 Cengage Learning. All Rights Reserved. May not be copied, scanned, or duplicated, in whole or in part. Due to electronic rights, some third party content may be suppressed from the eBook and/or eChapter(s).
Editorial review has deemed that any suppressed content does not materially affect the overall learning experience. Cengage Learning reserves the right to remove additional content at any time if subsequent rights restrictions require it.
12.6 Using the Estimated Regression Equation for Estimation and Prediction 519
y
= 60 + 5x
Confidence
interval limits
depend on x
p
Confidence
interval width
is smallest at
x
p
= x
Upper limit
Lower limit
Student Population (1000s)
Quarterly Sales ($1000s)
220
200
180
160
140
120
100
80
60
40
20
0
024 681012 1614 18 20 22 24 26
x= 14
x
y
^
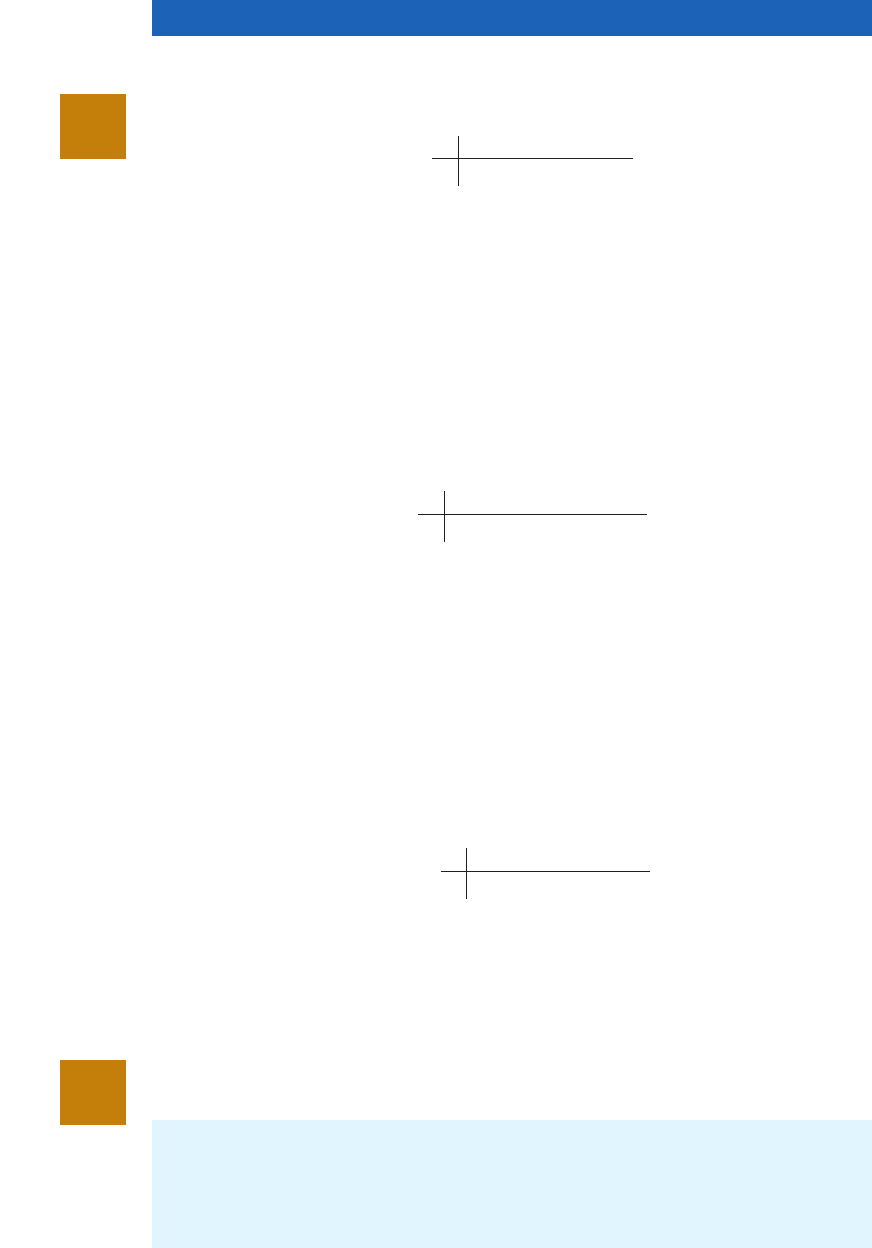
FIGURE 12.8 CONFIDENCE INTERVALS FOR THE MEAN SALES yAT GIVEN VALUES OF STUDENT
POPULATION x
In dollars, the 95% confidence interval for the mean quarterly sales of all restaurants near cam-
puses with 10,000 students is $110,000 $11,415. Therefore, the 95% confidence interval
for the mean quarterly sales when the student population is 10,000 is $98,585 to $121,415.
Note that the estimated standard deviation of given by equation (12.23) is smallesty
ˆ
p
when x
p
and the quantity x
p
0. In this case, the estimated standard deviation of
becomes
This result implies that we can make the best or most precise estimate of the mean value
of y whenever x
p
. In fact, the further x
p
is from the larger x
p
becomes. As a re-
sult, confidence intervals for the mean value of y will become wider as x
p
deviates more
from . This pattern is shown graphically in Figure 12.8.
Prediction Interval for an Individual Value of y
Suppose that instead of estimating the mean value of sales for all Armand’s restaurants lo-
cated near campuses with 10,000 students, we want to predict the sales for an individual
restaurant located near Talbot College, a school with 10,000 students. As noted previously,
x¯
x¯x¯x¯
s
y
ˆ
p
s
冑
1
n
(x¯ x¯)
2
兺(x
i
x¯)
2
s
冑
1
n
y
ˆ
p
x¯x¯
CH012.qxd 8/16/10 6:59 PM Page 519
Copyright 2010 Cengage Learning. All Rights Reserved. May not be copied, scanned, or duplicated, in whole or in part. Due to electronic rights, some third party content may be suppressed from the eBook and/or eChapter(s).
Editorial review has deemed that any suppressed content does not materially affect the overall learning experience. Cengage Learning reserves the right to remove additional content at any time if subsequent rights restrictions require it.

520 Chapter 12 Simple Linear Regression
the predictor of y
p
, the value of y corresponding to the given x
p
, is provided by the estimated
regression equation b
0
b
1
x
p
. For the restaurant at Talbot College, we have x
p
10
y
ˆ
p
PREDICTION INTERVAL FOR y
p
(12.27)
where the confidence coefficient is 1 α and t
α/2
is based on a t distribution with
n 2 degrees of freedom.
y
ˆ
p
t
α/2
s
ind
The margin of error
associated with this
prediction interval is
t
α/2
s
ind
.
The 95% prediction interval for quarterly sales at Armand’s Talbot College restaurant can
be found by using t
.025
2.306 and s
ind
14.69. Thus, with 110 and a margin of er-y
ˆ
p
ror of t
α/2
s
ind
2.306(14.69) 33.875, the 95% prediction interval is
110
33.875
and a corresponding predicted quarterly sales of 60 5(10) 110, or $110,000. Note
that this value is the same as the point estimate of the mean sales for all restaurants
located near campuses with 10,000 students.
To develop a prediction interval, we must first determine the variance associated with
using as a predictor of an individual value of y when x x
p
. This variance is made up of
the sum of the following two components.
1. The variance of individual y values about the mean E(y
p
), an estimate of which is
given by s
2
2. The variance associated with using to estimate E(y
p
), an estimate of which is
given by
The formula for estimating the variance corresponding to the prediction of an individual
value of y
p
, denoted by , is
(12.25)
Hence, an estimate of the standard deviation corresponding to the prediction of an individ-
ual value of y
p
is given by
(12.26)
For Armand’s Pizza Parlors, the estimated standard deviation corresponding to the pre-
diction of sales for one specific restaurant located near a campus with 10,000 students is
computed as follows.
The general expression for a prediction interval follows.
14.69
13.829
兹
1.1282
s
ind
13.829
冑
1
1
10
(10 14)
2
568
s
ind
s
冑
1
1
n
(x
p
x¯)
2
兺(x
i
x¯)
2
s
2
冤
1
1
n
(x
p
x¯)
2
兺(x
i
x¯)
2
冥
s
2
s
2
冤
1
n
(x
p
x¯)
2
兺(x
i
x¯)
2
冥
s
2
ind
s
2
s
2
y
ˆ
p
s
2
ind
s
2
y
ˆ
p
y
ˆ
p
y
ˆ
p
y
ˆ
p
CH012.qxd 8/16/10 6:59 PM Page 520
Copyright 2010 Cengage Learning. All Rights Reserved. May not be copied, scanned, or duplicated, in whole or in part. Due to electronic rights, some third party content may be suppressed from the eBook and/or eChapter(s).
Editorial review has deemed that any suppressed content does not materially affect the overall learning experience. Cengage Learning reserves the right to remove additional content at any time if subsequent rights restrictions require it.
12.6 Using the Estimated Regression Equation for Estimation and Prediction 521
In dollars, this prediction interval is $110,000 $33,875 or $76,125 to $143,875. Note that
the prediction interval for an individual restaurant located near a campus with 10,000 stu-
dents is wider than the confidence interval for the mean sales of all restaurants located near
campuses with 10,000 students. The difference reflects the fact that we are able to estimate
the mean value of y more precisely than we can predict an individual value of y.
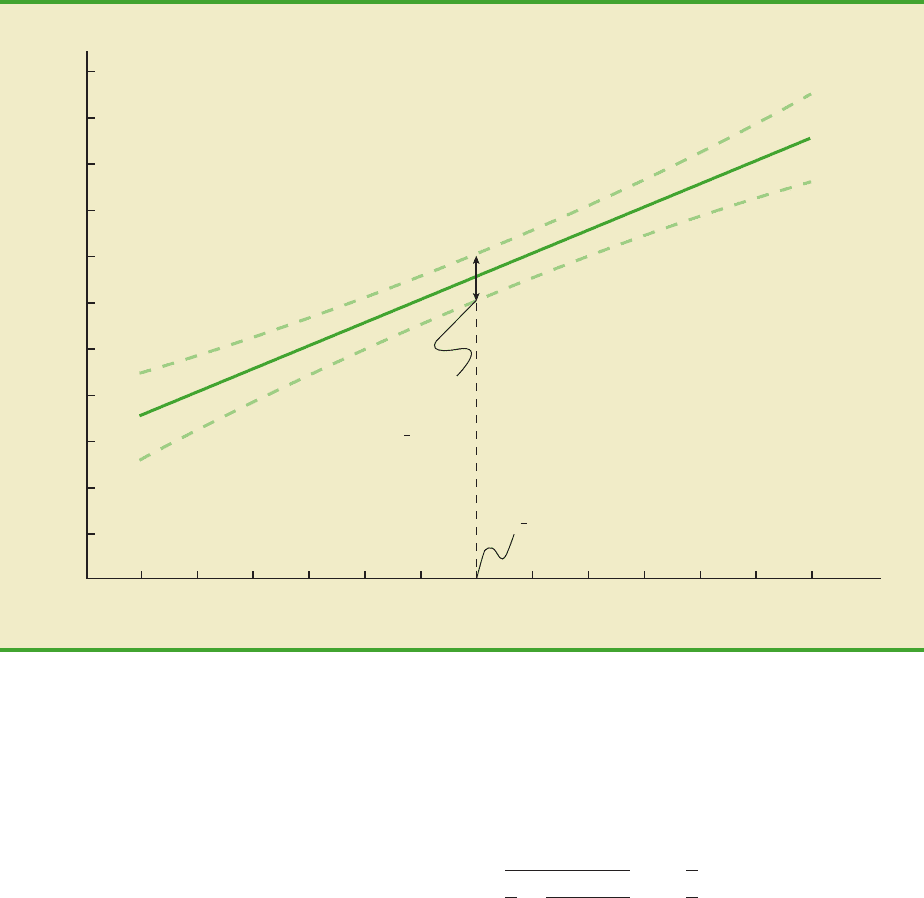
Both confidence interval estimates and prediction interval estimates are most precise
when the value of the independent variable is x
p
. The general shapes of confidence
intervals and the wider prediction intervals are shown together in Figure 12.9.
Exercises
Methods
32. The data from exercise 1 follow.
x
i
123 4 5
y
i
3751114
a. Use equation (12.23) to estimate the standard deviation of when x 4.
b. Use expression (12.24) to develop a 95% confidence interval for the expected value
of y when x 4.
y
ˆ
p
x¯
¯
= 14
y = 60 + 5x
^
Prediction
interval
limits
x
Prediction intervals
are wider
Student Population (1000s)
Quarterly Sales ($1000s)
240
220
200
180
160
140
120
100
80
60
40
20
0
Both intervals
have the smallest
width at
x
p
= x
¯
x
y
024681012 1614 18 20 22 24 26
Confidence
interval
limits
FIGURE 12.9 CONFIDENCE AND PREDICTION INTERVALS FOR SALES y AT GIVEN VALUES
OF STUDENT POPULATION x
test
SELF
In general, the lines for the
confidence interval limits
and the prediction interval
limits both have curvature.
CH012.qxd 8/16/10 6:59 PM Page 521
Copyright 2010 Cengage Learning. All Rights Reserved. May not be copied, scanned, or duplicated, in whole or in part. Due to electronic rights, some third party content may be suppressed from the eBook and/or eChapter(s).
Editorial review has deemed that any suppressed content does not materially affect the overall learning experience. Cengage Learning reserves the right to remove additional content at any time if subsequent rights restrictions require it.

522 Chapter 12 Simple Linear Regression
c. Use equation (12.26) to estimate the standard deviation of an individual value of y
when x 4.
d. Use expression (12.27) to develop a 95% prediction interval for y when x 4.
33. The data from exercise 2 follow.
x
i
3 12 6 20 14
y
i
55 40 55 10 15
a. Estimate the standard deviation of when x 8.
b. Develop a 95% confidence interval for the expected value of y when x 8.
c. Estimate the standard deviation of an individual value of y when x 8.
d. Develop a 95% prediction interval for y when x 8.
34. The data from exercise 3 follow.
x
i
2 691320
y
i
7 18 9 26 23
Develop the 95% confidence and prediction intervals when x 12. Explain why these two
intervals are different.
Applications
35. In exercise 18, the data on grade point average x and monthly salary y provided the esti-
mated regression equation 1790.5 581.1x.
a. Develop a 95% confidence interval for the mean starting salary for all students with a
3.0
GPA.
b. Develop a 95% prediction interval for the starting salary for Joe Heller, a student with
a
GPA of 3.0.
36. In exercise 8, data on x temperature rating (F) and y price ($) for 11 sleeping bags
manufactured by Bergans of Norway provided the estimated regression equation
359.2668 5.2772x. For these data s 37.9372.
a. Develop a pointestimate of theprice for a sleeping bag with a temperature rating of 30.
b. Develop a 95% confidence interval for the mean overall temperature rating for all
sleeping bags with a temperature rating of 30.
c. Suppose that Bergans developed a new model with a temperature rating of 30. Develop
a 95% prediction interval for the price of this new model.
d. Discuss the differences in your answers to parts (b) and (c).
37. In exercise 13, data were given on the adjusted gross income x and the amount of itemized
deductions taken by taxpayers. Data were reported in thousands of dollars. With the esti-
mated regression equation 4.68 .16x, the point estimate of a reasonable level of total
itemized deductions for a taxpayer with an adjusted gross income of $52,500 is $13,080.
a. Develop a 95% confidence interval for the mean amount of total itemized deductions
for all taxpayers with an adjusted gross income of $52,500.
b. Develop a 95% prediction interval estimate for the amount of total itemized deduc-
tions for a particular taxpayer with an adjusted gross income of $52,500.
c. If the particular taxpayer referred to in part (b) claimed total itemized deductions of
$20,400, would the
IRS agent’s request for an audit appear to be justified?
d. Use your answer to part (b) to give the
IRS agent a guideline as to the amount of total
itemized deductions a taxpayer with an adjusted gross income of $52,500 should claim
before an audit is recommended.
38. Refer to Exercise 21, where data on the production volume x and total cost y for a particu-
lar manufacturing operation were used to develop the estimated regression equation
1246.67 7.6x.
a. The company’s production schedule shows that 500 units must be produced next
month. What is the point estimate of the total cost for next month?
y
ˆ
y
ˆ
y
ˆ
y
ˆ
test
SELF
y
ˆ
p
file
W
EB
SleepingBags
CH012.qxd 8/16/10 6:59 PM Page 522
Copyright 2010 Cengage Learning. All Rights Reserved. May not be copied, scanned, or duplicated, in whole or in part. Due to electronic rights, some third party content may be suppressed from the eBook and/or eChapter(s).
Editorial review has deemed that any suppressed content does not materially affect the overall learning experience. Cengage Learning reserves the right to remove additional content at any time if subsequent rights restrictions require it.

a. Use these data to develop an estimated regression equation that could be used to
predict the ridership given the miles of track.
b. Did the estimated regression equation provide a good fit? Explain.
c. Develop a 95% confidence interval for the mean weekday ridership for all light-rail
systems with 30 miles of track.
d. Suppose that Charlotte is considering construction of a light-rail system with 30 miles
of track. Develop a 95% prediction interval for the weekday ridership for the Char-
lotte system. Do you think that the prediction interval you developed would be of value
to Charlotte planners in anticipating the number of weekday riders for their new light-
rail system? Explain.
12.7 Computer Solution
Performing the regression analysis computations without the help of a computer can be
quite time consuming. In this section we discuss how the computational burden can be min-
imized by using a computer software package such as Minitab.
We entered Armand’s student population and sales data into a Minitab worksheet. The
independent variable was named Pop and the dependent variable was named Sales to assist
with interpretation of the computer output. Using Minitab, we obtained the printout for
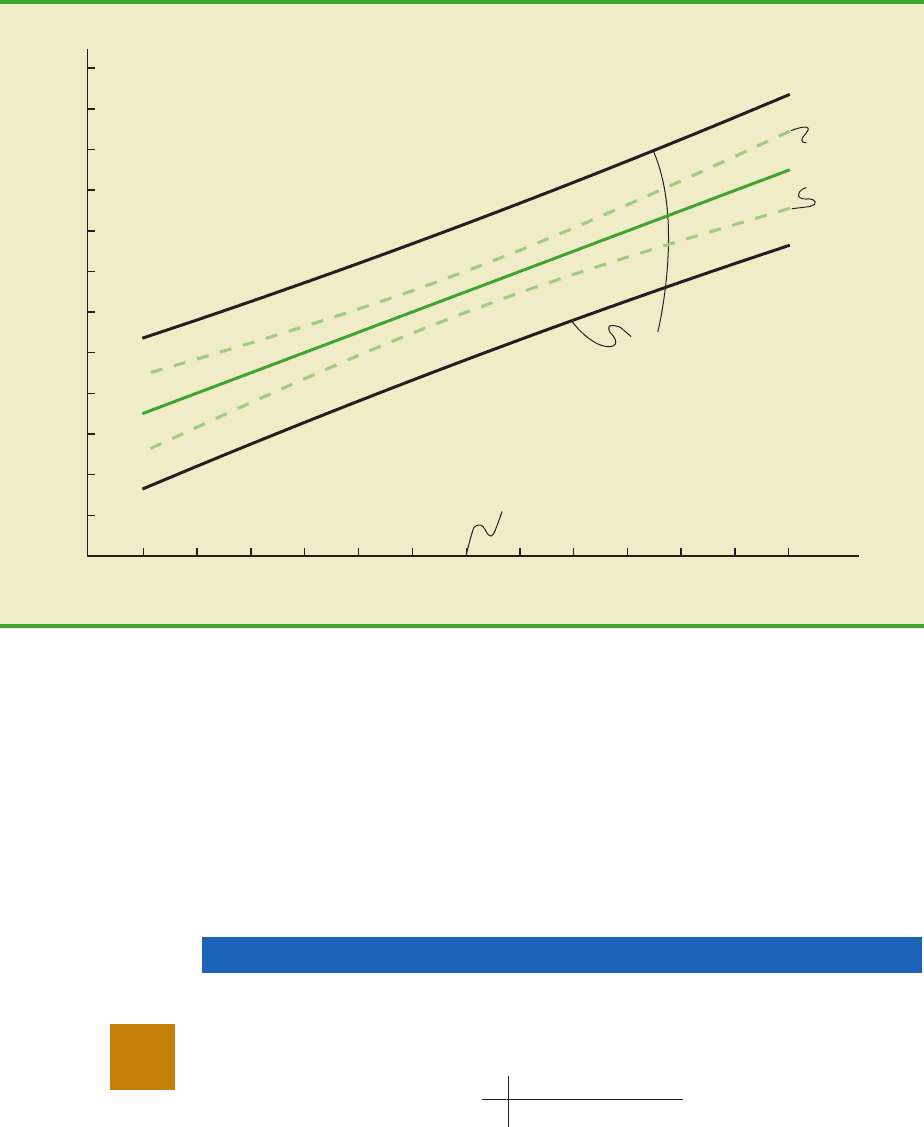
Armand’s Pizza Parlors shown in Figure 12.10.
2
The interpretation of this printout follows.
1. Minitab prints the estimated regression equation as Sales 60.0 5.00 Pop.
2. A table is printed that shows the values of the coefficients b
0
and b
1
, the standard
deviation of each coefficient, the t value obtained by dividing each coefficient
value by its standard deviation, and the p-value associated with the t test. Because
the p-value is zero (to three decimal places), the sample results indicate that the null
hypothesis (H
0
: β
1
0) should be rejected. Alternatively, we could compare 8.62
(located in the t-ratio column) to the appropriate critical value. This procedure for
the t test was described in Section 12.5.
12.7 Computer Solution 523
b. Develop a 99% prediction interval for the total cost for next month.
c. If an accounting cost report at the end of next month shows that the actual production
cost during the month was $6000, should managers be concerned about incurring such
a high total cost for the month? Discuss.
39. Almost all U.S. light-rail systems use electric cars that run on tracks built at street level.
The Federal Transit Administration claims light-rail is one of the safest modes of travel,
with an accident rate of .99 accidents per million passenger miles as compared to 2.29 for
buses. The following data show the miles of track and the weekday ridership in thousands
of passengers for six light-rail systems (
USA Today, January 7, 2003).
City Miles of Track Ridership (1000s)
Cleveland 15 15
Denver 17 35
Portland 38 81
Sacramento 21 31
San Diego 47 75
San Jose 31 30
St. Louis 34 42
2
The Minitab steps necessary to generate the output are given in Appendix 12.3.
CH012.qxd 8/16/10 6:59 PM Page 523
Copyright 2010 Cengage Learning. All Rights Reserved. May not be copied, scanned, or duplicated, in whole or in part. Due to electronic rights, some third party content may be suppressed from the eBook and/or eChapter(s).
Editorial review has deemed that any suppressed content does not materially affect the overall learning experience. Cengage Learning reserves the right to remove additional content at any time if subsequent rights restrictions require it.
524 Chapter 12 Simple Linear Regression
3. Minitab prints the standard error of the estimate, s 13.8293, as well as informa-
tion about the goodness of fit. Note that “R-sq 90.3%” is the coefficient of de-
termination expressed as a percentage. The value “R-Sq(adj) 89.1%” is discussed
in Chapter 13.
4. The ANOVA table is printed below the heading Analysis of Variance. Minitab uses
the label Residual Error for the error source of variation. Note that DF is an abbre-
viation for degrees of freedom and that MSR is given as 14,200 and MSE as 191.
The ratio of these two values provides the F value of 74.25 and the corresponding
p-value of 0.000. Because the p-value is zero (to three decimal places), the rela-
tionship between Sales and Pop is judged statistically significant.
5. The 95% confidence interval estimate of the expected sales and the 95% predic-
tion interval estimate of sales for an individual restaurant located near a campus
with 10,000 students are printed below the ANOVA table. The confidence interval
is (98.58, 121.42) and the prediction interval is (76.13, 143.87) as we showed in
Section 12.6.
Exercises
Applications
40. The commercial division of a real estate firm is conducting a regression analysis of the re-
lationship between x, annual gross rents (in thousands of dollars), and y, selling price (in
thousands of dollars) for apartment buildings. Data were collected on several properties
recently sold and the following computer output was obtained.
test
SELF
The regression equation is
Sales = 60.0 + 5.00 Pop
Predictor Coef SE Coef T p
Constant 60.000 9.226 6.50 0.000
Pop 5.0000 0.5803 8.62 0.000
S = 13.8293 R-sq = 90.3% R-sq(adj) = 89.1%
Analysis of Variance
SOURCE DF SS MS F p
Regression 1 14200 14200 74.25 0.000
Residual Error 8 1530 191
Total 9 15730
Predicted Values for New Observations
New
Obs Fit SE Fit 95% C.I. 95% P.I.
1 110.00 4.95 (98.58, 121.42) (76.13, 143.87)
FIGURE 12.10 MINITAB OUTPUT FOR THE ARMAND’S PIZZA PARLORS PROBLEM
Estimated regression equation
ANOVA table
Interval estimates
CH012.qxd 8/16/10 6:59 PM Page 524
Copyright 2010 Cengage Learning. All Rights Reserved. May not be copied, scanned, or duplicated, in whole or in part. Due to electronic rights, some third party content may be suppressed from the eBook and/or eChapter(s).
Editorial review has deemed that any suppressed content does not materially affect the overall learning experience. Cengage Learning reserves the right to remove additional content at any time if subsequent rights restrictions require it.