Baker R.C. Flow Measurement Handbook: Industrial Designs, Operating Principles, Performance, and Applications
Подождите немного. Документ загружается.

1.3 HOW ACCURATE?
(b)
1
t
CENTRE
OF TARGET
-2 -1
(e)
(f)
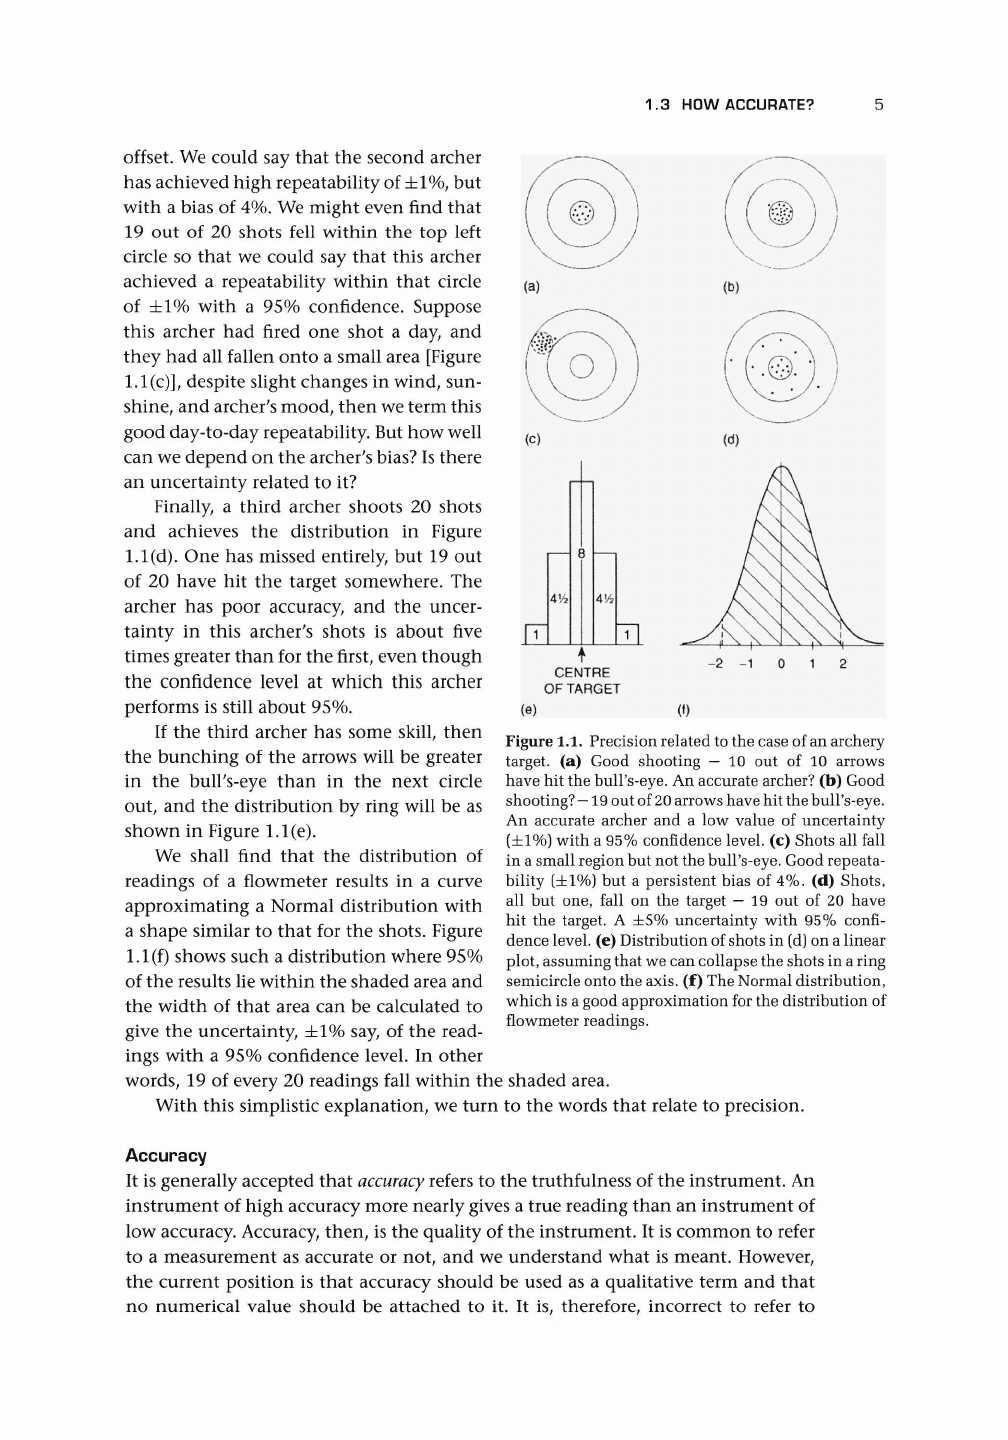
offset. We could say that the second archer
has achieved high repeatability of
±1%,
but
with a bias of 4%. We might even find that
19 out of 20 shots fell within the top left
circle so that we could say that this archer
achieved a repeatability within that circle
of ±1% with a 95% confidence. Suppose
this archer had fired one shot a day, and
they had all fallen onto a small area [Figure
l.l(c)],
despite slight changes in wind, sun-
shine, and archer's mood, then we term this
good day-to-day repeatability. But how well
can we depend on the archer's bias? Is there
an uncertainty related to it?
Finally, a third archer shoots 20 shots
and achieves the distribution in Figure
l.l(d). One has missed entirely, but 19 out
of 20 have hit the target somewhere. The
archer has poor accuracy, and the uncer-
tainty in this archer's shots is about five
times greater than for the first, even though
the confidence level at which this archer
performs is still about 95%.
If the third archer has some skill, then
the bunching of the arrows will be greater
in the bull's-eye than in the next circle
out, and the distribution by ring will be as
shown in Figure l.l(e).
We shall find that the distribution of
readings of a flowmeter results in a curve
approximating a Normal distribution with
a shape similar to that for the shots. Figure
1.1
(f)
shows such a distribution where 95%
of the results lie within the shaded area and
the width of that area can be calculated to
give the uncertainty, ±1% say, of the read-
ings with a 95% confidence level. In other
words, 19 of every 20 readings fall within the shaded area.
With this simplistic explanation, we turn to the words that relate to precision.
Accuracy
It is generally accepted that
accuracy
refers to the truthfulness of the instrument. An
instrument of high accuracy more nearly gives a true reading than an instrument of
low accuracy. Accuracy, then, is the quality of the instrument. It is common to refer
to a measurement as accurate or not, and we understand what is meant. However,
the current position is that accuracy should be used as a qualitative term and that
no numerical value should be attached to it. It is, therefore, incorrect to refer to
Figure 1.1. Precision related to the case of an archery
target, (a) Good shooting
—
10 out of 10 arrows
have hit the bull's-eye. An accurate archer? (b) Good
shooting?
—19
out of
20
arrows have hit the bull's-eye.
An accurate archer and a low value of uncertainty
(±1%) with a
95%
confidence level, (c) Shots all fall
in a small region but not the bull's-eye. Good repeata-
bility (±1%) but a persistent bias of 4%. (d) Shots,
all but one, fall on the target
—
19 out of 20 have
hit the target. A ±5% uncertainty with 95% confi-
dence level, (e) Distribution of shots in (d) on a linear
plot, assuming that we can collapse the shots in
a
ring
semicircle onto the axis, (f) The Normal distribution,
which is a good approximation for the distribution of
flowmeter readings.
INTRODUCTION
a measurement's accuracy of, say, 1%, when, presumably, this is the instrument's
measurement uncertainty, as is explained later.
Repeatability
In a process plant, or other control loop, we may not need to know the accuracy of a
flowmeter
as
we would if
we
were buying and selling liquid or
gas,
but
we
may require
repeatability within bounds defined by the process.
Repeatability
is the value below
which the difference between any two test results, taken under constant conditions
with the same observer and with a short elapsed time, are expected to lie with 95%
confidence.
Precision
Precision
is the qualitative expression for repeatability. It should not take a value and
should not be used as a synonym for accuracy.
Uncertainty
Properly used,
uncertainty
refers to the quality of the measurement, and we can cor-
rectly refer to an instrument reading having an uncertainty of ±1%. By this we
mean that the readings will lie within an envelope ±1% of the true value. Each
reading will, of course, have an individual error that we cannot know in practice,
but we are interested in the relationship of the readings to the true value. Because
uncertainty is referred to the true value, by implication it must be obtained using
a national standard document or facility. However, because it is a statistical quan-
tity, we need also to define how frequently the reading does, in fact, lie within the
envelope; hence the confidence level.
Confidence level
The
confidence
level,
which is a statement of probability, gives this frequency, and it
is not satisfactory to state an uncertainty without it. Usually, for flow measurement,
this is
95%.
We shall assume this level in this book.
A
confidence level of
95%
means
that we should expect on average that 19 times out of 20 (19/20 = 95/100 = 95%)
the reading of the meter will fall within the bracket specified (e.g., ±1% of actual
calibrated value).
Linearity
Linearity may be used for instruments that give a reading approximately propor-
tional to the true flow rate over their specified range. It is a special case of con-
formity to a curve. Note that both terms really imply the opposite. Linearity refers
to the closeness within which the meter achieves a truly linear or proportional
response. It is usually defined by stating the maximum deviation (or nonconformity,
e.g., ±1% of flow rate) within which the response lies over a stated range. With
modern signal processing, linearity is probably less important than conformity
to a general curve.
Linearity
is most commonly used with such meters as the turbine
meter.
1.4 A BRIEF REVIEW OF THE EVALUATION OF STANDARD UNCERTAINTY
Range and Rangeability
An instrument should have a specified range over which its performance can be
trusted. Therefore, there will be upper and lower range values. This reflects the fact
that probably no instrument can be used to measure a variable when there are no
limitations on the variable. Without such a statement, the values for uncertainty, lin-
earity, etc., are inadequate. The ratio of upper range value and lower range value may
be called the
rangeability,
but it has also been known as the
turndown
ratio.
The differ-
ence between upper and lower or negative range values is known as
span.
It is impor-
tant to note whether the values of uncertainty, linearity, etc., are a percentage of the
actual flow rate or of the full-scale flow [sometimes referred to as full-scale deflection
(FSD),
full-scale reading (FSR), maximum scale value, or upper range value (URV)].
1.4 A BRIEF REVIEW OF THE EVALUATION
OF STANDARD UNCERTAINTY
Kinghorn (1982) points out the problem with terminology in matters concerning
statistics and flow measurement. To the engineer and the statistician, words such
as
error
and
tolerance
may have different meanings. The word
tolerance
was used for
what is now known as uncertainty.
In providing an introduction to the terminology of uncertainty in measurement,
I shall aim to follow the guidance in BIPM et al. (1993), which is usually known as
the Guide, and also in a document consistent with the
Guide,
which provides the
basis for uncertainty estimates in laboratories accredited in the United Kingdom
(NAMAS 1997). The reader is strongly advised to consult this document, which is
full of clear explanations and useful examples. Those wishing to pursue background
arguments are referred to van der Grinten
;
s (1994, 1997) papers and other papers in
the proceedings of the 1997 North Sea Flow Measurement Workshop.
Random
error,
the random part of the experimental error, causes scatter, as the
name suggests, and reflects the quality of the instrument design and construction.
It is the part that cannot be calibrated out, and the smaller it is, the more precise the
instrument is. It may be calculated by taking a series of repeat readings resulting in
the value of the standard deviation of a limited sample n, and sometimes called the
experimental standard deviation:
/2
J
where q is the mean of n measurements q
}
. The experimental standard deviation of
the mean of this group of readings is given by
^ (1.2)
/n
Where too few readings have been taken to obtain a reliable value of
s(g
;
),
an earlier
calculation of s{q{) from previous data may be substituted in Equation (1.2). In
obtaining the overall uncertainty of a flowmeter or a calibration facility, there will
be values of group mean experimental standard deviation for various quantities, and
INTRODUCTION
so NAMAS (1997) defines
a
standard uncertainty
for the /th
quantity
as
(1.3)
where
x
t
is one of the
input quantities.
For
those with access
to
NAMAS (1997), this
is,
essentially, dealt with there
as a
Type
A
evaluation
of
standard uncertainty.
Systematic
error,
according to flowmeter
usage,
is that which
is
unchanging within
the period
of a
short test with constant conditions. This
is,
essentially, dealt with
in NAMAS (1997) under
the
heading Type B evaluation
of
standard uncertainty.
It
is also called bias. However,
in
modern flowmeters
and in
calibration facilities,
it
is likely that this bias
or
systematic error will result
in a
meter adjustment,
or a rig
correction. The resulting uncertainty
in
that adjustment or correction will contribute
to
the
overall uncertainty.
The
systematic uncertainty, therefore,
may
derive from
various factors such
as
a.
uncertainty
in the
reference
and any
drift,
b.
the
equipment used
to
measure
or
calibrate,
c.
the
equipment being calibrated
in
terms
of
resolution
and
stability,
d. the
operational procedure,
and
e. environmental factors.
From these
we
deduce further values
of
u(xt).
There has been debate about
the
correct way to combine
the
random
and
system-
atic uncertainties.
We can
combine random
and
systematic uncertainties conserva-
tively
by
arithmetic addition. This results
in a
conservative estimate. NAMAS (1997)
has followed
the
Guide
in
taking the square root
of
the sum
of
the squares
of
the stan-
dard uncertainties
in
consistent units. Thus
the
combined standard uncertainty
is
My) = y/VlcMxi)]* (1.4)
where
y is the
output quantity.
To
ensure consistent units,
a
sensitivity coefficient
Ci
will
be
required
for
each input
x
if
although
in
practice this
may be
unity
in
most
cases
(as in
Figure
4.3).
The final step (and we have glossed over many important details
in
NAMAS
1997)
is
to
deduce from
u
c
the
bracket within which
the
reading
of, say, the
meter lies.
In
the
past, bearing
in
mind that
u
c
or its
components have been derived from
standard deviations,
we
have used Student's
t
value which
for a
number
of
readings
n
is
given
by
n
10
20
>30
t
2
2
2
.26
.09
.0
for
a
95%
confidence level.
The
Guide
replaces this,
in
general, with
a
coverage factor
k, to
obtain
the
expanded uncertainty
U
=
ku
c
(y)
(1.5)
1.6 WHAT IS A FLOWMETER?
The recommended value is k = 2, which gives a confidence level of
95.45%
taken as
95%,
assuming a Normal distribution. If this assumption is not adequate, then we
need to revert to Student's t.
The net result is that the assumption of a factor of 2 has now been given a
systematic basis. The reader who is interested in more details about the basis of
Normal and t distributions is referred to Appendix l.A.
1.5 SENSITIVITY COEFFICIENTS
Suppose that output quantity, a flow rate, has the relationship
y
=
x
p
l
x
q
2
x
r
3
x
s
4
(1.6)
then if x
2
, x
3f
and *
4
are held constant, we can differentiate y with respect to
X\
and
obtain the partial derivative. This is the slope of the curve of y against
X\
when the
other variables are kept constant. It also allows us to find the effect of a small change
in
Xi
on y. This slope (or partial derivative) is the sensitivity coefficient c
x
for x
x
and
may be found by calculation. It will have the value c
x
— px[
p
~
r]
x\x\x\
t
where the
values of x
x
,
Xz, X3,
and
X4
will be at the calibration point and may be dimensional.
In some cases, it may be a known coefficient (e.g., a temperature coefficient of ex-
pansion). For cases where it is difficult to calculate, it may be possible to find the
coefficient by changing x
x
by a small amount and observing the change in y. In some
cases,
the sensitivity coefficient may provide a conversion between different sets of
units (e.g., where output quantity or velocity may be obtained from a dimension, a
pressure, a movement, or a voltage).
1.6 WHAT IS A FLOWMETER?
We take as a working definition of an ideal flowmeter:
A group of linked components that will deliver a signal uniquely related to
the flow rate or quantity of fluid flowing in a conduit, despite the influence of
installation and operating environment.
The object of installing a flowmeter is to obtain a measure of the flow rate, usually
in the form of an electrical signal, which is unambiguous and with a specified ex-
panded uncertainty. This signal should be negligibly affected by the inlet and outlet
pipework and the operating environment. Thus the uncertainty of measurement
of a flowmeter should be reported as y ± U, where U, the uncertainty band, might
have a value of, say, 0.5%, and it should be made clear whether this is related to
rate,
full-scale deflection (FSD) or other value that might be a combination of these
[e.g., in the form ±a (rate) ±b (FSD)]. The range should be given (e.g., Im
3
/h to
20m
3
/h).
The statement of performance should include the coverage factor k = 2 and the
level of confidence of approximately 95%, and, if appropriate, the authority that
accredited the calibration facility (national or international).
10 INTRODUCTION
In addition, the ranges of properties for which it can be used should be speci-
fied, such as fluid, flow range (beyond calibration), maximum working pressure,
temperature range of fluid, and ambient temperature range.
It is useful to introduce two factors that define the response of flowmeters, al-
though they are most commonly used for linear flowmeters with pulse output. The
K factor is the number of pulses per unit quantity. In this book, we shall take it as
number of pulses per unit volume when dealing with turbine and vortex meters:
Pulses
True volume
whereas the meter factor is usually defined as
True volume
Meter factor =
Indicated volume
The reader should keep a wary eye for other definitions of meter factor such as the
reciprocal of the K factor.
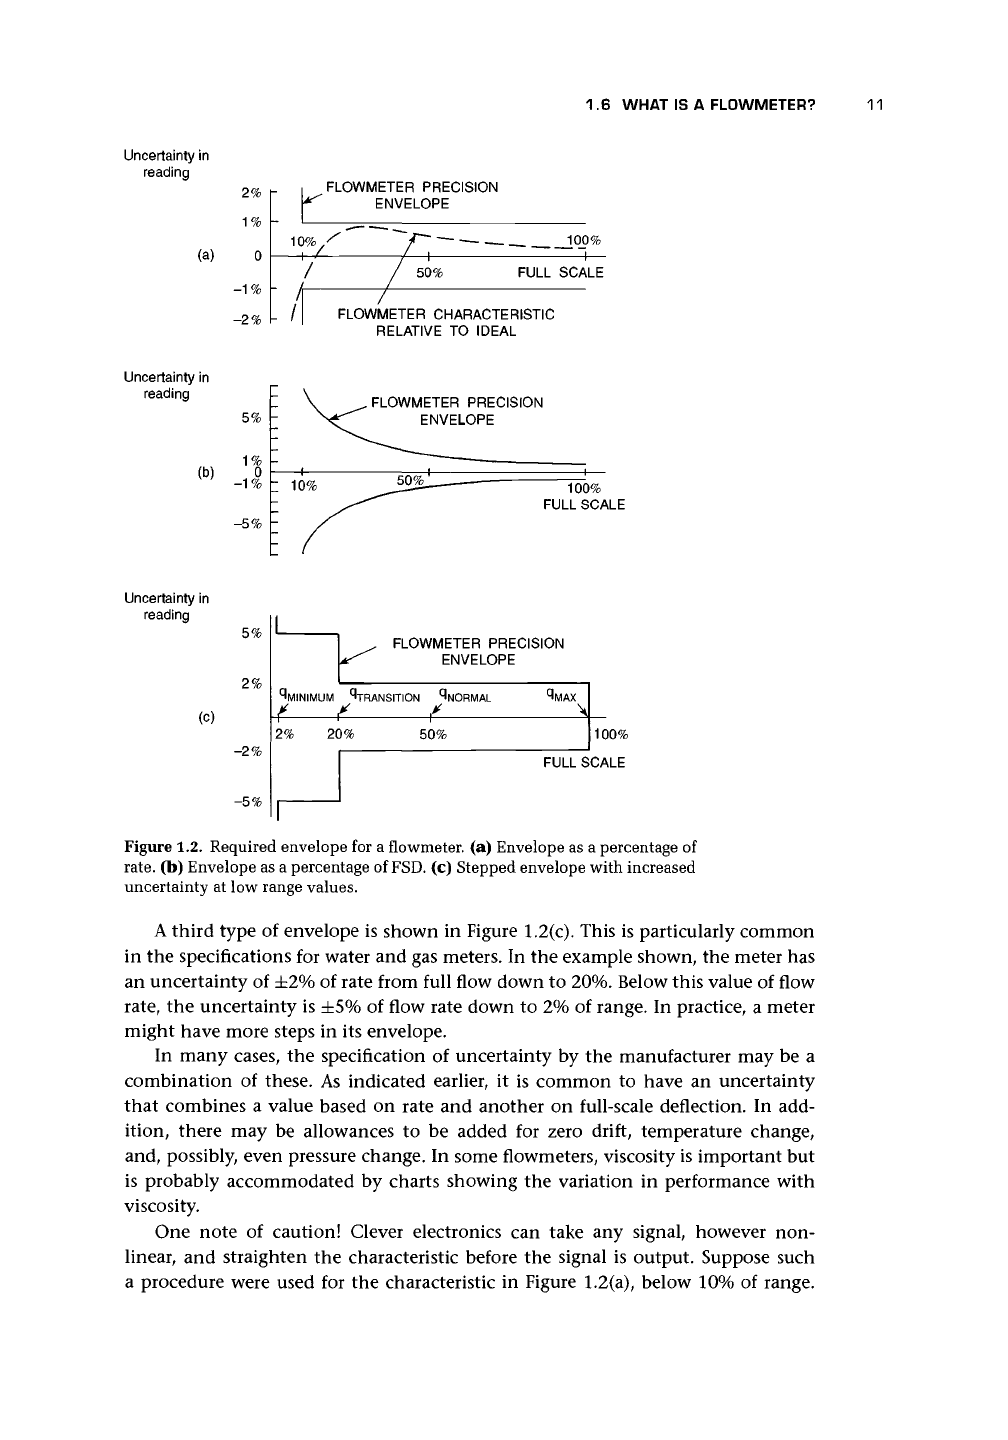
Let us take a specific example of a fictitious, but reasonably realistic flowmeter.
In Figure
1.2(a),
a typical flowmeter envelope is shown. It defines an approximately
linear flowmeter with a 10:1 turndown and an uncertainty of ±1% of rate with a
confidence level of
95%
against a traceable standard calibration. This is a reasonable
performance for a flowmeter and probably satisfies most requirements in industry.
This,
let us assume, is the performance specification the manufacturer carries in its
sales literature. Actually the characteristic of the flowmeter may be the curve shown
in Figure
1.2(a).
If the company works to a high standard of manufacture, then the
company may know that this characteristic lies within close tolerances in all cases.
It may, therefore, only be necessary for the manufacturer to calibrate each flowmeter
at, say, 90% of FSD, or 50% and 90% of FSD, in order to make the claim that the
characteristic falls within the envelope specified in the sales literature.
If the meters are actually of this standard, it may well be feasible to calibrate
them in much greater detail so that a 5-, 10-, or even 20-point calibration may
provide a characteristic that ensures that the reading is known to, say, ±0.2%. The
values obtained from the calibration will then be programmed into a flow computer,
which will interpret each reading of the flowmeter against this look-up table. Since
we are comparing the flowmeter's signal to a linear one, if it were without error it
would also be linear. Consequently, companies sometimes record linearity within
their literature. In this case, it would also be
±1%
with a 10:1 turndown.
The envelope that has been discussed gives the uncertainty at each flow rate
in terms of the actual flow rate. Because of the physical basis of some flowmeters,
this method is not appropriate, and the uncertainty may then be given in terms of
the full scale. Figure
1.2(b)
shows such an envelope where the performance of the
flowmeter would be defined as ±1% FSD. It is apparent that the uncertainty in the
flowmeter's reading at, say, half scale is ±2% of rate and at 20% of reading will be
as much as ±5% of rate. The problem often arises wherein the user has a particular
flow range that does not match that of the actual instrument. The user's full flow
may only be at 60% of the instrument's range, and so for the user the instrument
has an uncertainty, at best, of 1.7% of rate.
1.6 WHAT IS A FLOWMETER?
11
Uncertainty in
reading
(a)
-2%
FLOWMETER PRECISION
ENVELOPE
- _ iqo%
50%
FULL SCALE
FLOWMETER CHARACTERISTIC
RELATIVE TO IDEAL
Uncertainty in
reading
-5%
-
, FLOWMETER PRECISION
ENVELOPE
Uncertainty in
reading
(c)
-2%
FLOWMETER PRECISION
ENVELOPE
^MINIMUM ^TRANSITION ^NORMAL
2%
20%
50%
100%
FULL SCALE
Figure 1.2. Required envelope for a flowmeter. (a) Envelope as a percentage of
rate,
(b) Envelope as a percentage of
FSD.
(c) Stepped envelope with increased
uncertainty at low range values.
A third type of envelope is shown in Figure
1.2(c).
This is particularly common
in the specifications for water and gas meters. In the example shown, the meter has
an uncertainty of ±2% of rate from full flow down to 20%. Below this value of flow
rate,
the uncertainty is ±5% of flow rate down to 2% of range. In practice, a meter
might have more steps in its envelope.
In many cases, the specification of uncertainty by the manufacturer may be a
combination of these. As indicated earlier, it is common to have an uncertainty
that combines a value based on rate and another on full-scale deflection. In add-
ition, there may be allowances to be added for zero drift, temperature change,
and, possibly, even pressure change. In some flowmeters, viscosity is important but
is probably accommodated by charts showing the variation in performance with
viscosity.
One note of caution! Clever electronics can take any signal, however non-
linear, and straighten the characteristic before the signal is output. Suppose such
a procedure were used for the characteristic in Figure
1.2(a),
below 10% of range.
12
INTRODUCTION
The characteristic is probably very sensitive to minor variations in this region,
and any attempt to use the characteristic could lead to disguised, but serious,
errors.
Variation of temperature and pressure can have effects on the performance of a
flowmeter, as can humidity, vibration, and other environmental parameters (Baker
1988/9).
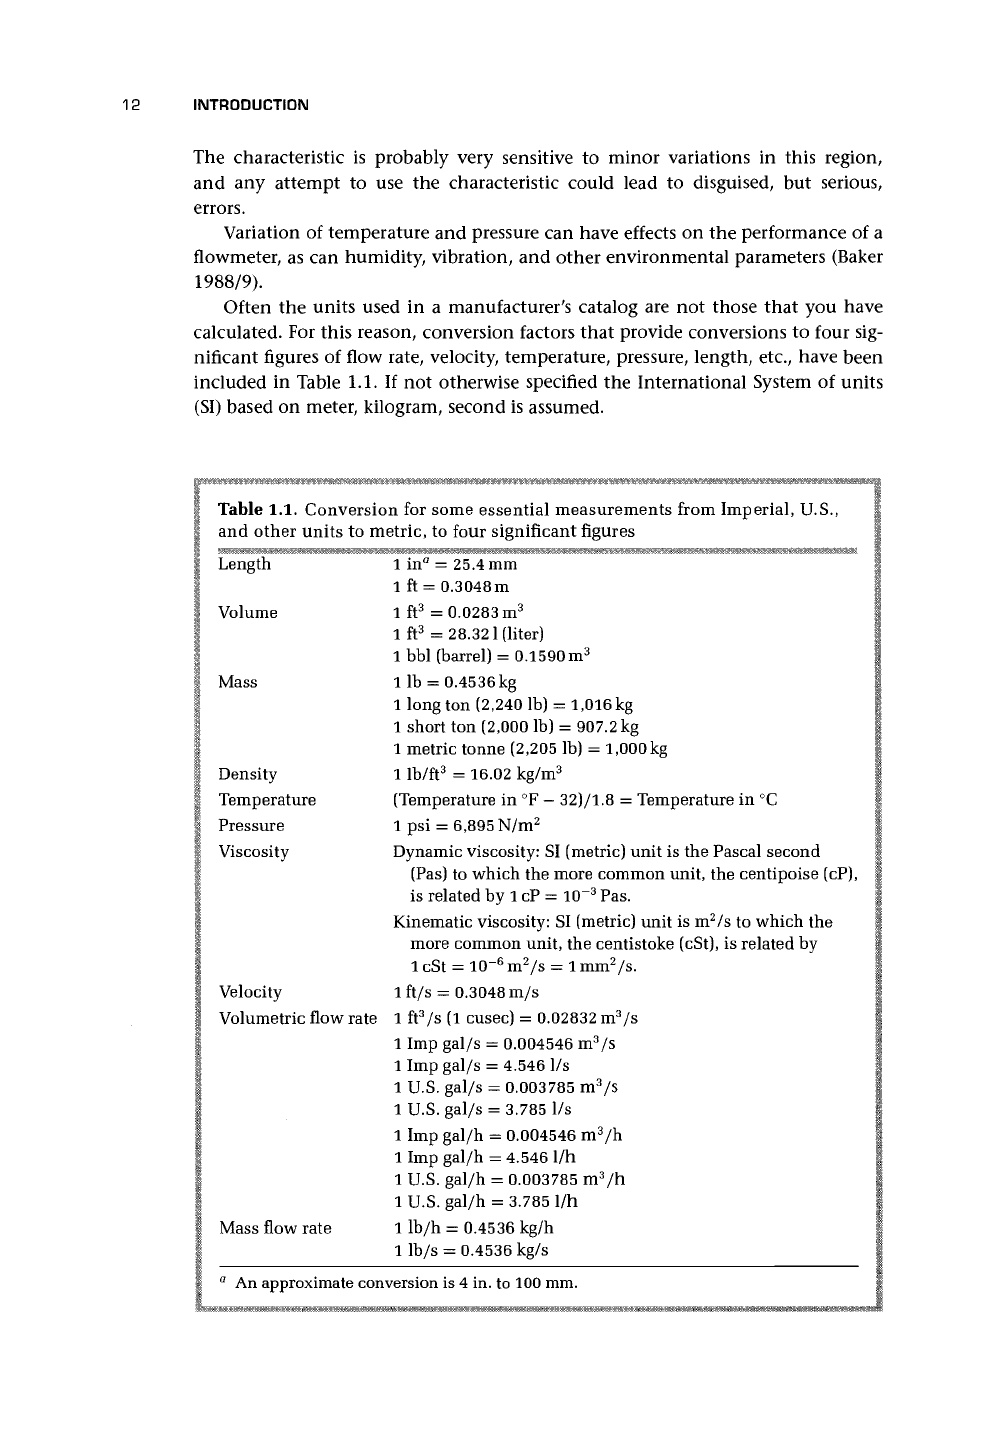
Often the units used in a manufacturer's catalog are not those that you have
calculated. For this reason, conversion factors that provide conversions to four sig-
nificant figures of flow rate, velocity, temperature, pressure, length, etc., have been
included in Table 1.1. If not otherwise specified the International System of units
(SI) based on meter, kilogram, second is assumed.
Table 1.1. Conversion for some essential measurements from Imperial, U.S.,
and other units to metric, to four significant figures
Length 1 in
a
=
25.4
mm
1 ft = 0.3048
m
Volume 1 ft
3
= 0.0283 m
3
1 ft
3
=
28.321
(liter)
lbbl (barrel) = 0.1590 m
3
Mass llb = 0.4536
kg
1 long ton (2,240 lb) = 1,016
kg
1 short ton (2,000 lb) = 907.2 kg
1 metric tonne (2,205 lb) = 1,000
kg
Density 1 lb/ft
3
= 16.02 kg/m
3
Temperature (Temperature in°F
—
32)/1.8 = Temperature in °C
Pressure 1 psi = 6,895 N/m
2
Viscosity Dynamic viscosity: SI (metric) unit is the Pascal second
(Pas) to which the more common unit, the centipoise (cP),
is related by
1
cP =
10~
3
Pas.
Kinematic viscosity: SI (metric) unit is m
2
/s to which the
more common unit, the centistoke (cSt), is related by
1 cSt =
10~
6
m
2
/s =
1
mm
2
/s.
lft/s = 0.3048 m/s
1 ft
3
/s (1 cusec) = 0.02832 m
3
/s
1 Imp gal/s = 0.004546 m
3
/s
1 Imp gal/s = 4.546 1/s
1 U.S. gal/s = 0.003785 m
3
/s
1 U.S. gal/s = 3.785 1/s
1 Imp gal/h = 0.004546 m
3
/h
1 Imp gal/h = 4.546 1/h
1 U.S. gal/h = 0.003785 m
3
/h
1 U.S. gal/h = 3.785 1/h
Mass flow rate 1 lb/h = 0.4536 kg/h
1 lb/s = 0.4536 kg/s
a
An approximate conversion is
4
in. to 100 mm.
Velocity
Volumetric flow rate
1.7 CHAPTER CONCLUSIONS 13
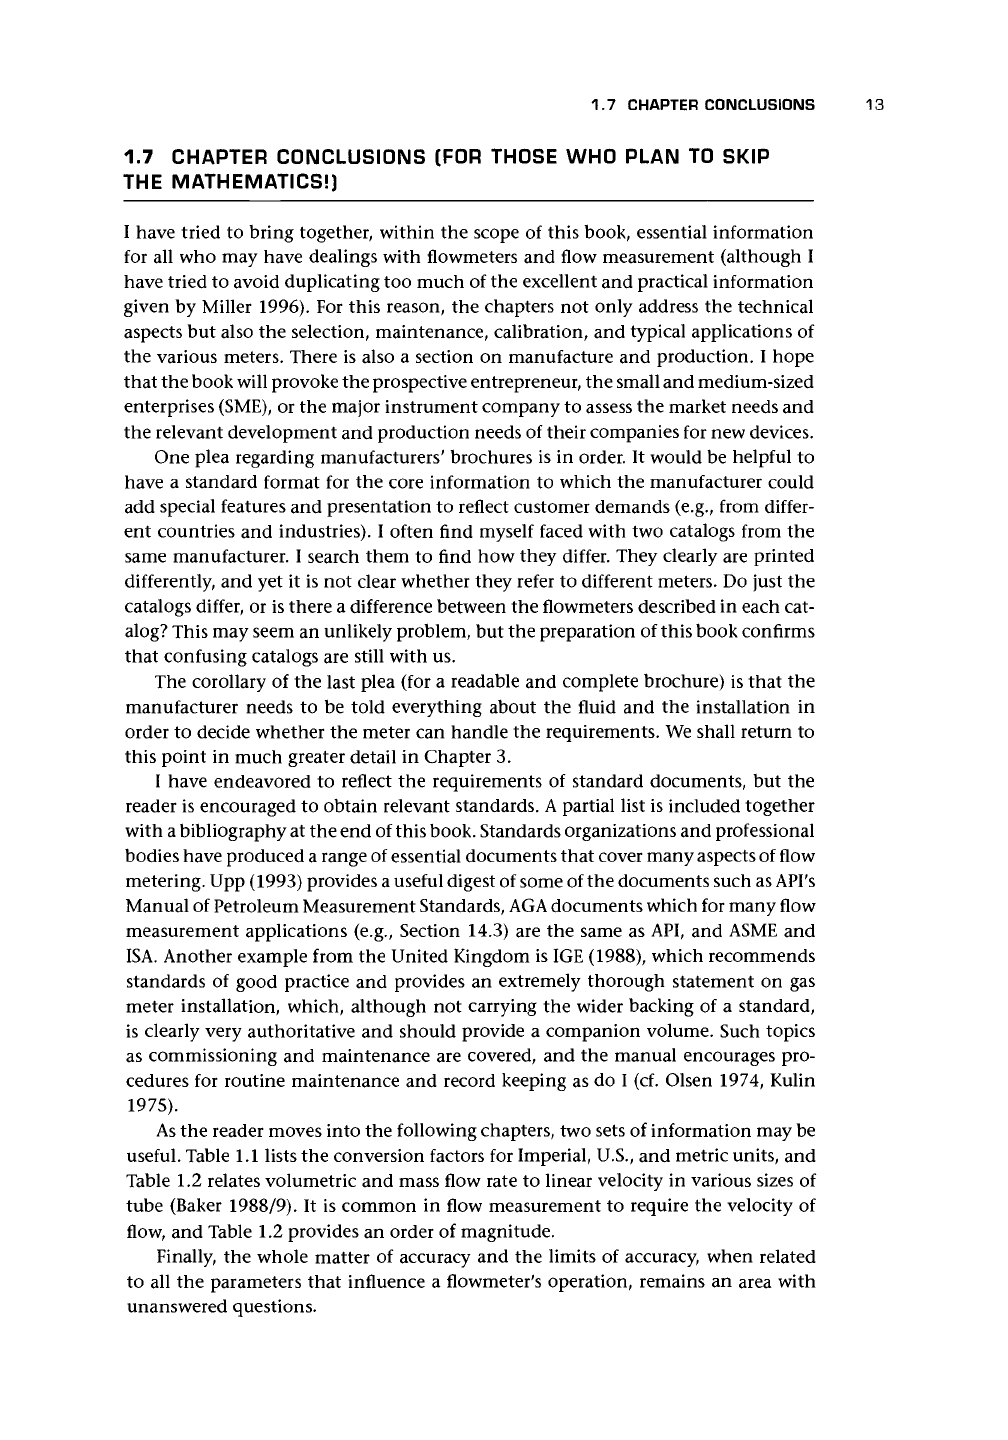
1.7 CHAPTER CONCLUSIONS (FOR THOSE WHO PLAN TO SKIP
THE MATHEMATICS!)
I have tried to bring together, within the scope of this book, essential information
for all who may have dealings with flowmeters and flow measurement (although I
have tried to avoid duplicating too much of the excellent and practical information
given by Miller 1996). For this reason, the chapters not only address the technical
aspects but also the selection, maintenance, calibration, and typical applications of
the various meters. There is also a section on manufacture and production. I hope
that the book will provoke the prospective entrepreneur, the small and medium-sized
enterprises (SME), or the major instrument company to assess the market needs and
the relevant development and production needs of their companies for new devices.
One plea regarding manufacturers' brochures is in order. It would be helpful to
have a standard format for the core information to which the manufacturer could
add special features and presentation to reflect customer demands (e.g., from differ-
ent countries and industries). I often find myself faced with two catalogs from the
same manufacturer. I search them to find how they differ. They clearly are printed
differently, and yet it is not clear whether they refer to different meters. Do just the
catalogs differ, or is there a difference between the flowmeters described in each cat-
alog? This may seem an unlikely problem, but the preparation of this book confirms
that confusing catalogs are still with us.
The corollary of the last plea (for a readable and complete brochure) is that the
manufacturer needs to be told everything about the fluid and the installation in
order to decide whether the meter can handle the requirements. We shall return to
this point in much greater detail in Chapter 3.
I have endeavored to reflect the requirements of standard documents, but the
reader is encouraged to obtain relevant standards.
A
partial list is included together
with
a
bibliography at the end of this book. Standards organizations and professional
bodies have produced a range of essential documents that cover many aspects of flow
metering. Upp (1993) provides a useful digest of some of the documents such as API's
Manual of Petroleum Measurement Standards,
AGA
documents which for many flow
measurement applications (e.g., Section 14.3) are the same as API, and ASME and
ISA. Another example from the United Kingdom is IGE (1988), which recommends
standards of good practice and provides an extremely thorough statement on gas
meter installation, which, although not carrying the wider backing of a standard,
is clearly very authoritative and should provide a companion volume. Such topics
as commissioning and maintenance are covered, and the manual encourages pro-
cedures for routine maintenance and record keeping as do I (cf. Olsen 1974, Kulin
1975).
As the reader moves into the following chapters, two sets of information may be
useful. Table 1.1 lists the conversion factors for Imperial, U.S., and metric units, and
Table 1.2 relates volumetric and mass flow rate to linear velocity in various sizes of
tube (Baker 1988/9). It is common in flow measurement to require the velocity of
flow, and Table 1.2 provides an order of magnitude.
Finally, the whole matter of accuracy and the limits of accuracy, when related
to all the parameters that influence a flowmeter's operation, remains an area with
unanswered questions.
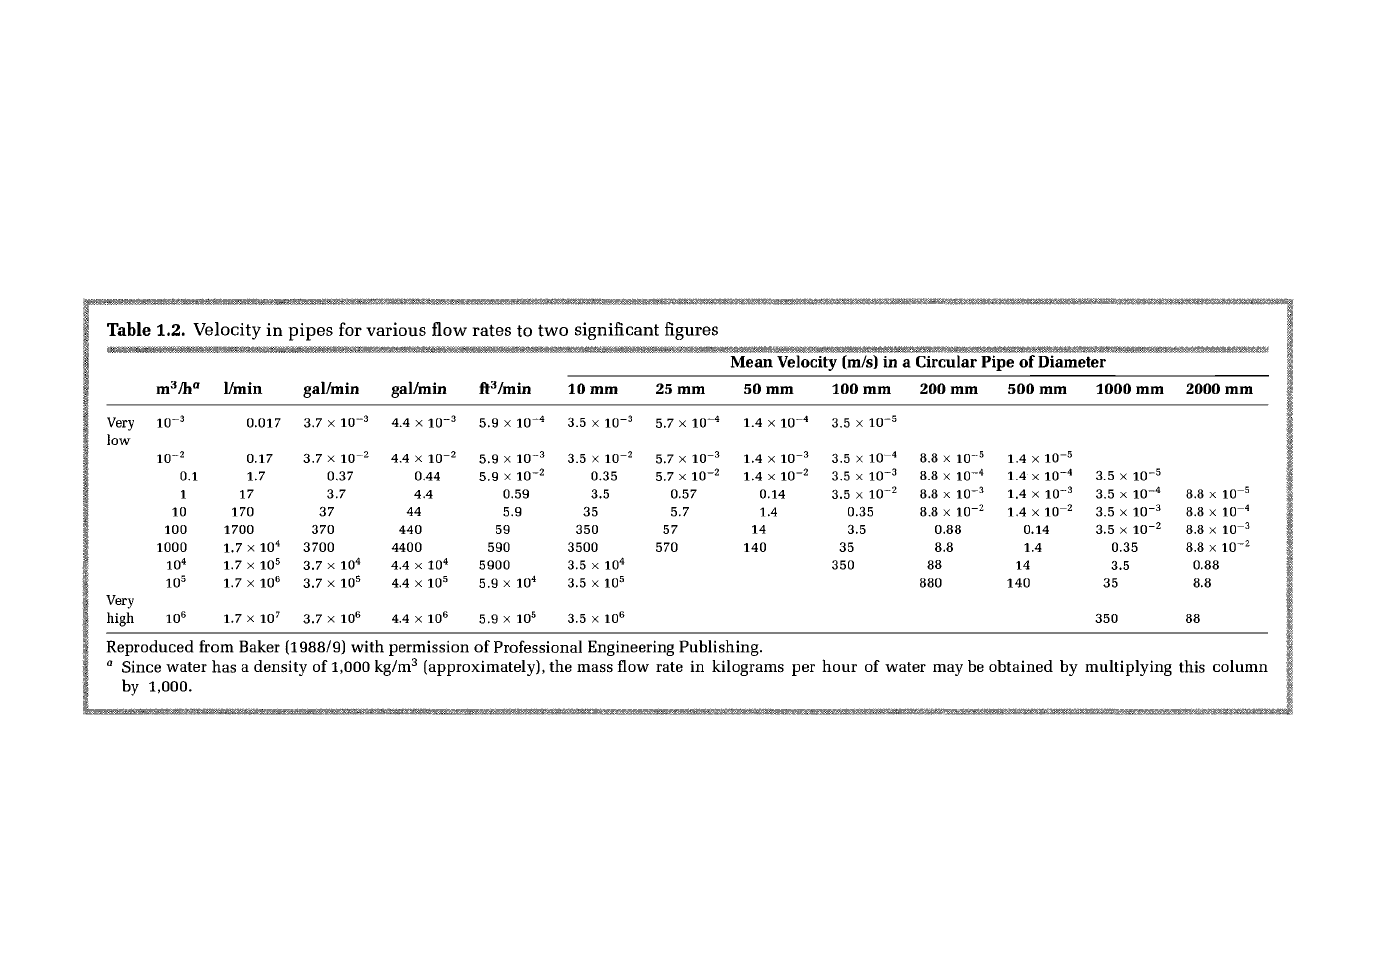
Table 1.2. Velocity in pipes for various flow rates to two significant figures
Mean Velocity (m/s) in a Circular Pipe of Diameter
m
3
/h°
Very
10~
3
low
lO-
2
0.1
1
10
100
1000
10
4
10
5
Very
high
10
6
1/min
0.017
0.17
1.7
17
170
1700
1.7 x 10
4
1.7 x 10
5
1.7 x 10
6
1.7 x 10
7
gal/min gal/min
3.7
x
lO"
3
4.4 x
10~
3
3.7
x
10~
2
4.4 x
10"
2
0.37
0.44
3.7
4.4
37
44
370
440
3700 4400
3.7
x
10
4
4.4 x
10
4
3.7
x
10
5
4.4 x 10
5
3.7
x
10
6
4.4 x 10
6
Reproduced from Baker (1988/9) with permission
ft
3
/min
5.9
x
lO-
4
5.9
x
10"
3
5.9
x
10"
2
0.59
5.9
59
590
5900
5.9
x 10
4
5.9
x 10
5
10 mm
3.5
x 10"
3
3.5
x
10~
2
0.35
3.5
35
350
3500
3.5
x 10
4
3.5
x 10
5
3.5
x 10
6
25 mm
5.7
x
lO-
4
5.7
x
lO"
3
5.7
x
10"2
0.57
5.7
57
570
50 mm
1.4 x
lO-
4
1.4 x
10"
3
1.4 x
10"
2
0.14
1.4
14
140
of Professional Engineering Publishing.
a
Since water has
a
density
of
1,000 kg/m
3
(approximately), the mass flow rate
in
kilograms
per
100 mm 200 mm
3.5
x 10
3.5
x 10
3.5
x 10
3.5
x 10
0.35
3.5
35
350
hour
of
-5
-4
8.8 x
lO-
5
-
3
8.8 x
lO-
4
-2
8.8 x lO-
3
8.8
x
10"
2
0.88
8.8
88
880
500 mm
1.4 x
lO-
5
1.4 x 10"4
1.4 x
10~
3
1.4 x
10"
2
0.14
1.4
14
140
water may be obtained
by
1000 mm
3.5
x
lO-
5
3.5
x
lO-
4
3.5
x lO-
3
3.5
x
10"
2
0.35
3.5
35
350
multiplying
2000 mm
8.8
x lO-
5
8.8
x lO-
4
8.8
x lO-
3
8.8
x lO-
2
0.88
8.8
88
this column