Balakumar Balachandran, Magrab E.B. Vibrations
Подождите немного. Документ загружается.

The solution to Eq. (5.162) has to be obtained numerically
34
for the non-
linear case (a 0). For the linear and nonlinear cases, we assume that
o
3, z 0.4, and F
o
/k 50 units; for the nonlinear case, we assume that a
1.5. The numerical solutions to Eq. (5.162) are presented in Figure 5.47,
along with their amplitude spectra. The amplitude spectra were obtained from
the steady-state portions of the signal;
35
that is, for v
n
t 10. We see that in
270 CHAPTER 5 Single Degree-of-Freedom Systems Subjected to Periodic Excitations
34
The MATLAB function ode45 was used.
35
The MATLAB function fft was used.
(a) (b)
(c) (d)
0 5 10 15 20 25 30
10
8
6
4
2
0
2
4
6
8
10
2p/Ω
o
t
0 2 4 6 8 10 12
70
60
50
40
30
20
10
0
dB
Ω
Ω
o
0 5 10 15 20 25 30
6
4
2
0
2
4
6
t
x(t)
x(t)
0 2 4 6 8 10 12
70
60
50
40
30
20
10
0
dB
Ω
Ω
o
3
3Ω
o
9
Time domain Frequency domain
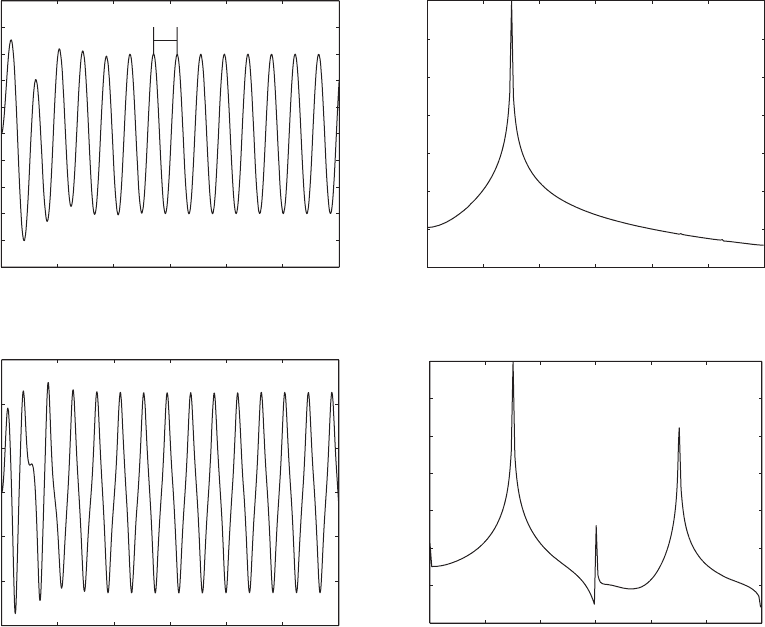
FIGURE 5.47
Displacement response of linear (z 0.4) and nonlinear (z 0.4 and a 1.5) systems to harmonic excitation: (a) time history
of linear system; (b) amplitude spectrum of linear system; (c) time history of nonlinear system; and (d) amplitude spectrum of
nonlinear system.

the time domain, the steady-state nonlinear response is not sinusoidal. From
an examination of the amplitude response, we see that it is the sum of two
components; that at the driving frequency
o
3 and one additional one at
the third harmonic, 3
o
9. The third harmonic is due to the nonlinear be-
havior of the spring.
For weak nonlinearity, the following approximation for the periodic am-
plitude response of the nonlinear system has been obtained
36
from a two-term
approximate solution to Eq. (5.162)
(5.163)
where v/v
n
and
(5.164)
In Eqs. (5.163) and (5.164), X is the nondimensional magnitude of the dis-
placement of the mass, X
o
is the nondimensional response amplitude, and S is
the nondimensional force amplitude. In Eq. (5.163), the plus sign is used for a
hardening spring (a 0) and the minus sign is used for a softening spring
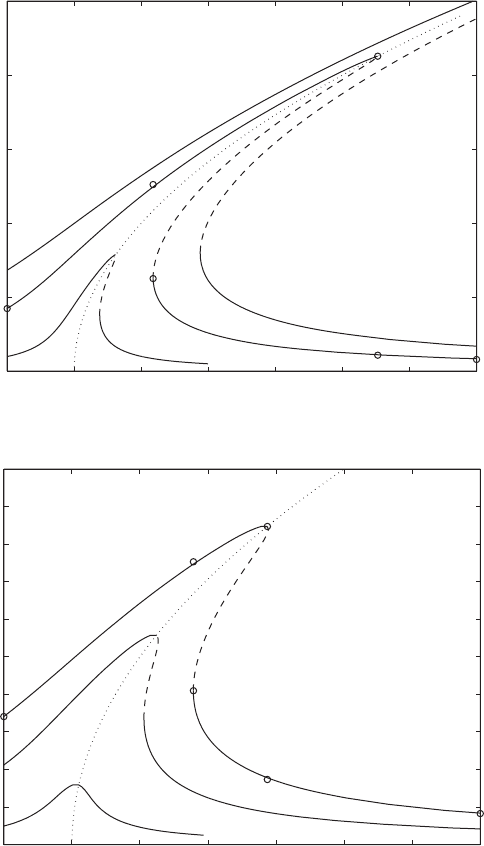
(a 0). A graph of Eq. (5.163) is given in Figure 5.48.
37
Unlike the case of a
linear system, the maximum value of the amplitude occurs at an excitation fre-
quency away from the natural frequency. This type of result also appears in the
design of strain gauges.
38
In Figure 5.48, the amplitude information is pre-
sented along with information about the stability of the response.
In Figure 5.48, the solid lines are used to represent the loci of stable pe-
riodic responses and the broken lines are used to represent the loci of unsta-
ble responses. The determination of stability of periodic responses is not dis-
cussed here, but broadly speaking, an unstable periodic response is not stable
to disturbances.
39
To examine what happens along a frequency-response curve, let us look
at the curve plotted for z 0.05 and S 0.5. In this case, as the excitation
frequency is increased gradually from 0, the response amplitude follows the
branch EDA. At the excitation frequency corresponding to point A, a jump oc-
curs, and for further increases in the excitation frequency, the response fol-
lows the branch BF. On the reverse sweep, as the excitation frequency is de-
creased from the value corresponding to the point F, the response follows the
branch FBC before a jump takes place at point C. For further decrease in the
excitation frequency, the response follows the branch DE.
X
o
X
B
3a
4
and
S
F
o
k B
3a
4
X
o
S
211 X
2
o
2
2
2
12z2
2
5.10 Influence of Nonlinear Stiffness on Forced Response 271
36
See, for example, L. S. Jacobsen and R. B. Ayre, Engineering Vibrations, McGraw-Hill, NY,
pp. 286–293 (1958); or A. H. Nayfeh and D. T. Mook, Nonlinear Oscillations, John Wiley &
Sons, NY (1979).
37
For a 0, the curves would “bend” in the other direction.
38
C. Gui et al., “Nonlinearity and Hysteresis of Resonant Strain Gauges,” J. Microelectro-
mechanical Systems, Vol. 7, No. 1, pp. 122–127 (March 1998).
39
A. H. Nayfeh and B. Balachandran, Applied Nonlinear Dynamics: Analytical, Computational,
and Experimental Methods, John Wiley & Sons, NY, Chapter 2 (1995).
(a)
(b)
0 1 2 3 4 5 6 7
0
0.2
0.4
0.6
0.8
1
1.2
1.4
1.6
1.8
2
C
D
A
B
E
F
S 0
Ω
2
X
o
S 0.1
S 0.5
S 1
0 1 2 3 4 5 6 7
0
0.5
1
1.5
2
2.5
C
D
A
B
E
F
S 0
Ω
2
X
o
S 0.1
S 0.5
S 1
FIGURE 5.48
Representative amplitude response for system with linear and nonlinear stiffness elements
with a 0: (a) z 0.05 and (b) z 0.15.
The locus of the peak amplitudes shown by a dotted line in Figure 5.48
is called a backbone curve. It is given by
(5.165)
When the nonlinearity is of the softening type, the frequency curves bend to-
ward the left as the excitation amplitude is increased. Again, jumps occur in
the response, beyond certain excitation amplitudes. Also, in some cases,
chaotic motions, which are a form of aperiodic motions with identifiable char-
acteristics, can be obtained.
40
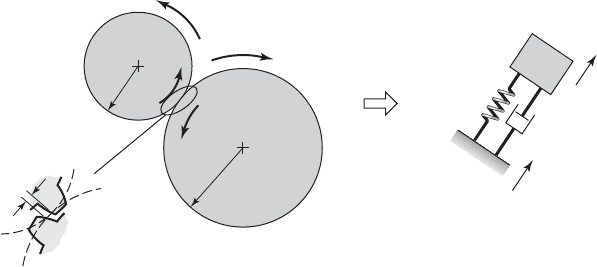
Case 2: Dynamic interactions of gear teeth
41
We shall derive the governing equation of motion for a pair of meshing gears
that incorporates nonlinear stiffness characteristics, which arise in real sys-
tems due to the changing gear teeth contact regimes and the tooth separations
due to tooth clearances (backlash). This governing equation is numerically
solved to study the nonlinear behavior of the system.
The simplified gear system is shown in Figure 5.49a, where the gear cen-
ters are rigidly mounted and the stiffness and damping are provided by the
elasticity and damping of the meshing gear teeth. The equivalent single
degree-of-freedom system is shown in Figure 5.49b, where x
1
is the tangential
2
1 X
2
o
5.10 Influence of Nonlinear Stiffness on Forced Response 273
40
A. H. Nayfeh and B. Balachandran, ibid.
41
For a more complete treatment of gear systems see, for example: A. Kahraman and R. Singh,
“Interactions between time-varying mesh stiffness and clearance non-linearities in a geared sys-
tem,” J. Sound Vibration, Vol. 146, No. 1, pp. 135–156 (1991); A. Kahraman and G. W. Blanken-
ship, “Interactions between commensurate parametric and forcing excitations in a system with
clearance,” J. Sound Vibration, Vol. 194, No. 3, pp. 317–336 (1996); C. Padmanabhan and
R. Singh, “ Analysis of periodically forced nonlinear Hill’s oscillator with application to a geared
system,” J. Acoustic Soc. Amer., Vol. 99, No. 1, pp. 324–334 (January 1996); and S. Theodossi-
ades and S. Natsiavas, “Non-linear dynamics of gear-pair systems with periodic stiffness and
backlash,” J. Sound Vibration, Vol. 229, No. 2, pp. 287–310 (2000).
k(t)
(b)(a)
r
1
r
2
J
1
J
2
x
2
x
1
c
T
1
T
2
b
1
2
Pinion
m
e
FIGURE 5.49
(a) Meshing gears and (b) equivalent single degree-of-freedom system model.

displacement of a meshing tooth on gear 1 and x
2
is the tangential displace-
ment of the meshing tooth on gear 2. These quantities are related to the rota-
tions by
x
j
r
j
w
j
j 1, 2 (5.166)
where r
j
is the radius of gear j and w
j
is the angular rotation of gear j. The ro-
tation w
j
is assumed to consist of a steady-state mesh speed v
j
, where v
1
and
v
2
are rotational speeds of gears 1 and 2, respectively, and a variation about
this steady-state value given by u
j
(t); that is,
w
j
(t) v
j
t u
j
(t) j 1, 2 (5.167)
Thus, Eqs. (5.166) become
x
j
r
j
(v
j
t u
j
(t)) j 1, 2 (5.168)
Governing Equation of Motion
The meshing gear teeth are modeled as a single degree-of-freedom system
with a moving base as shown in Figure 5.49b, where the quantity m
e
is deter-
mined as follows. Since we have a system with a moving base, we form the
difference between the displacements of gears 1 and 2 as
z x
1
x
2
r
1
u
1
r
2
u
2
(5.169)
where we have used Eq. (5.168) and noted that r
1
v
1
r
2
v
2
. Next, we differ-
entiate Eq. (5.169) twice with respect to time to obtain
(5.170)
However, from Figure 5.49a and Eqs. (1.17) and (1.21), we have that
(5.171)
where T
j
is the variation of the torque and F is the corresponding force. From
Eqs. (5.170) and (5.171), we obtain
(5.172)
or, equivalently, as
(5.173)
where the effective inertia m
e
is given by
(5.174)
We assume that the stiffness of the gear tooth is the time-varying function
k(t) k
o
(1 P cos v
M
t) (5.175)
m
e
a
r
2
1
J
1
r
2
2
J
2
b
1
F m
e
z
$
z
$
r
1
2
J
1
F
r
2
2
J
2
F a
r
2
1
J
1
r
2
2
J
2
bF
T
2
J
2
w
$
J
2
u
$
r
2
F
T
1
J
1
w
$
J
1
u
$
r
1
F
z
$
r
1
u
$
1
r
2
u
$
2
274 CHAPTER 5 Single Degree-of-Freedom Systems Subjected to Periodic Excitations

where k
o
is the mean stiffness, P is a stiffness ratio, and v
M
n
1
v
1
n
2
v
2
is
the rotating speed of the gears and n
1
and n
2
are the number of teeth on gears
1 and 2, respectively. The stiffness of the gear tooth is only engaged when the
mating teeth come in contact; that is, after the mating tooth traverses a small
separation distance b. This is similar, in principle, to the nonlinear spring sys-
tem shown in Figure 4.24. Hence, we use the following relation to express the
restoring force of the spring
F
s
k(t)h(z) (5.176)
where
(5.177)
The governing equation for the system shown in Figure 5.49 is, therefore,
(5.178)
where we assume that the applied force on the teeth of the pinion is
(5.179)
and T
o
is the steady-state torque applied by the pinion and a is a parameter used
to select the magnitude of the time-varying portion of the torque. To convert
Eq. (5.178) to a nondimensional form, we introduce the following definitions
(5.180)
Then, Eq. (5.178) becomes
(5.181)
where the overdot indicates the derivative with respect to t and
(5.182)
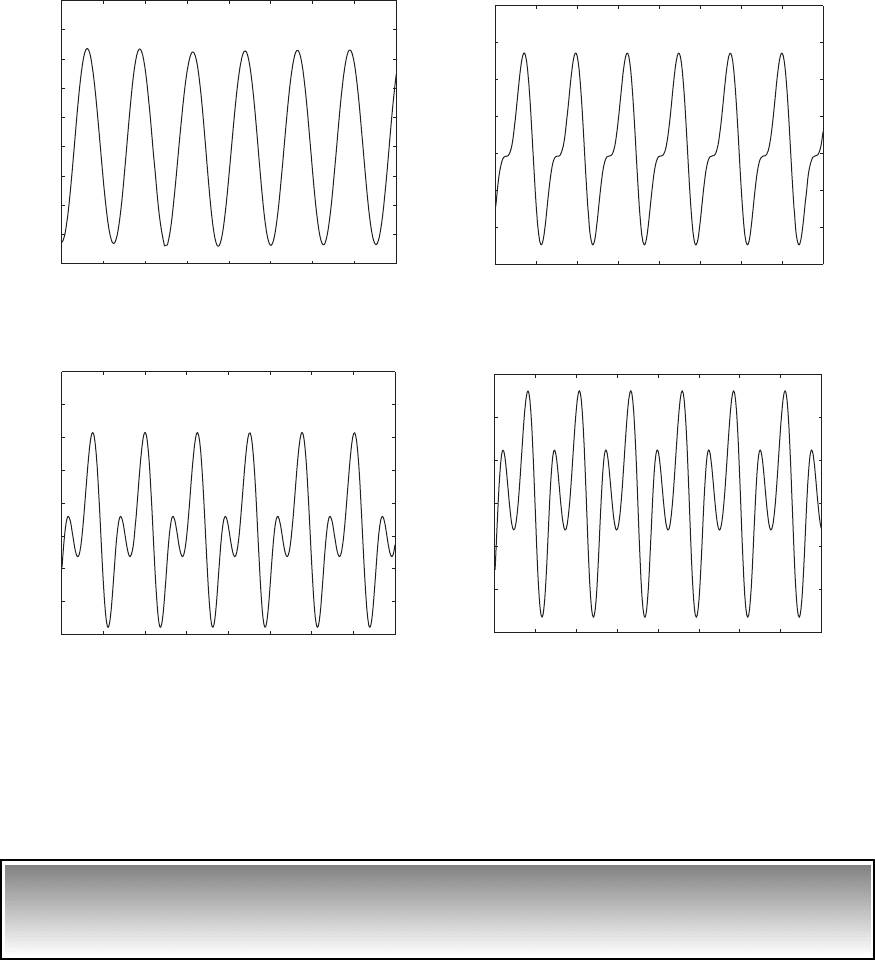
Numerical Results
The steady-state responses of the numerical evaluation
42
of Eq. (5.181) are
shown in Figure 5.50. It is seen that for P 0 the steady-state time histories
exhibit a harmonic response. As the magnitude of P increases, the steady-state
response is transformed into a nonharmonic periodic solution with an in-
creasing peak-to-peak value.
p sgn1p2
0p 0 1
h1p 2 0 0p 0 1
p
$
2zp
#
11 P cos
M
t2h1p 2 f
o
11 a cos
M
t2
t v
n
t
f
o
T
o
r
1
bk
o
p
z
b
v
n
2
k
o
m
e
2z
c
m
e
v
n
M
v
M
v
n
f 1t 2
T
o
r
1
11 a cos v
M
t2
m
e
z
$
cz
#
k1t 2h1z2 f 1t 2
z b sgn1z2
0z 0 b
h1z 2 0 0z 0 b
5.10 Influence of Nonlinear Stiffness on Forced Response 275
42
The MATLAB function ode45 was used.
EXAMPLE 5.20 Determination of system linearity from amplitude
response characteristics
Suppose that you are told that you have a single degree-of-freedom system
subjected to periodically varying excitation with a known magnitude A
o
. An
engineer gives you a spectrum of the displacement of the mass, which is
shown in Figure 5.51. The engineer wants to know what could cause the spec-
trum to look like this and if there is a way to determine the cause if there is
more than one way that this could have occurred.
276 CHAPTER 5 Single Degree-of-Freedom Systems Subjected to Periodic Excitations
(a) (b)
(c) (d)
170 180 190 200 210 220 230 240 250
1.07
1.08
1.09
1.1
1.11
1.12
1.13
1.14
t
p(t)
170 180 190 200 210 220 230 240 250
1.092
1.094
1.096
1.098
1.1
1.102
1.104
1.106
1.108
1.11
t
p(t)
170 180 190 200 210 220 230 240 250
1.04
1.06
1.08
1.1
1.12
1.14
1.16
1.18
1.2
t
p(t)
170 180 190 200 210 220 230 240 250
0.95
1
1.05
1.1
1.15
1.2
1.25
t
p(t)
FIGURE 5.50
Steady-state time histories of gear system for
M
0.5, z 0.05, a 0.05, f
o
0.1: (a) P 0; (b) P 0.1; (c) P 0.2;
and (d) P 0.4.

There are two possible scenarios in which this type of spectrum can
occur. In one scenario, the excitation force is composed of two frequency
components, one at v
1
and the other at 3v
1
and the system has a linear stiff-
ness. The other scenario is one where the system is subjected to a force at fre-
quency v
1
and the system has a nonlinear cubic spring, such as the one de-
scribed in this section. Both of these scenarios can produce this spectrum.
There are two independent ways to determine which of these scenarios
is applicable here. One can subject the system’s spring to a series of known
static forces, which includes as one of its values the forcing amplitude A
o
, and
measure the corresponding displacements. A plot of the force levels versus
the observed displacement magnitudes would reveal whether or not the spring
is linear or nonlinear. (Recall Figures 2.8 and 2.13.) If the system is linear,
then assuming that the inertia and damping elements are linear, the forcing ex-
citation contains two frequency components.
Another approach to examine if the second scenario is present is to sub-
ject the mass to a periodic force at frequency v
1
only. If the spectrum of the
displacement has only one frequency component, the system is linear,
whereas if it contains two components, the system is nonlinear.
5.11 SUMMARY
In this chapter, responses of single degree-of-freedom systems subjected to
harmonic and other periodic excitations are studied. Different sources of forc-
ing such as rotating unbalance and base excitation are considered. The no-
tions of system resonance and frequency-response functions are also intro-
duced and explained. The topic of vibration isolation is discussed at length.
The underlying principles of an electrodynamic shaker and an accelerometer
are also explained. For the different damping models, the notion of an equiv-
alent viscous damping is introduced and explained. Free-displacement curves
for linear and nonlinear damping models are examined in the context of en-
ergy dissipation.
Exercises 277
⏐
X()
⏐
1
3
1
FIGURE 5.51
Spectrum of the output of single
degree-of-freedom system with
unknown properties.
EXERCISES
Section 5.2.1
5.1 A vibratory system with a natural frequency of
10 Hz is suddenly excited by a harmonic excitation at
6 Hz. What should the damping factor of the system
be so that the system settles down to within 5% of the
steady-state amplitude in 200 ms?
Section 5.2.2
5.2 A 150 kg mass is suspended by a spring-damper
combination with a stiffness of 30 10
3
N/m and
a viscous-damping constant of 1500 N s/m. The
mass is initially at rest. Calculate the steady-state
displacement amplitude and phase if the mass is
#
excited by a harmonic force amplitude of 70 N
at 3 Hz.
5.3 The dynamic amplification or attenuation of a
single degree-of-freedom system is defined as the ra-
tio of the steady-state magnitude of the displacement
response to its static displacement F
o
/k, where the
mass is being driven by a harmonic force of magni-
tude F
o
. Find the dynamic amplification or attenua-
tion of a single degree-of-freedom system that is
being excited at 100 rad/s and has the following sys-
tem parameters: m 100 kg, k 20 kN/m, and c
6000 N s/m.
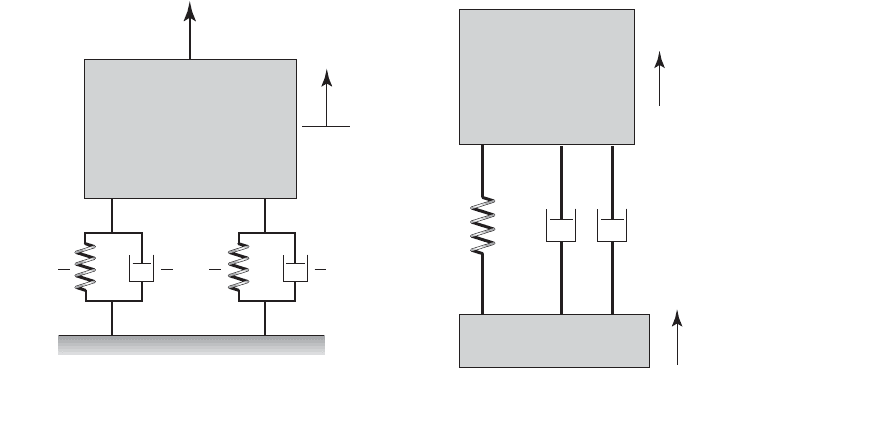
5.4 Consider the two independent single degree-
of-freedom systems in Figure E5.4 that are each
being forced to vibrate harmonically at the same fre-
quency v. The excitation on System 1 starts at t 0,
and the excitation on System 2 starts at t t
o
; that is,
a) Use Eqs. (5.1) to (5.9) to show that the steady-state
responses of the two systems are
where andv/v
n1
, v
r
v
n2
/v
n1
, g z
2
/z
1
,
u1/v
r
, gz
1
22
x
2ss
1t 2
F
2
k
2
H1/v
r
, gz
1
2 sin1/v
r
1t t
o
2
x
1ss
1t 2
F
1
k
1
H1, z
1
2sin 1t u1, z
1
22
f
2
1t 2 F
2
sin1v 3t t
o
42u1t t
o
2
f
1
1t 2 F
1
sin1vt 2u1t2
#
b) If both systems are operating in their respective
mass-dominated regions, then what is the ratio of
the magnitudes of the amplitudes of System 2 to
that of System 1 and their relative phase.
Section 5.2.4
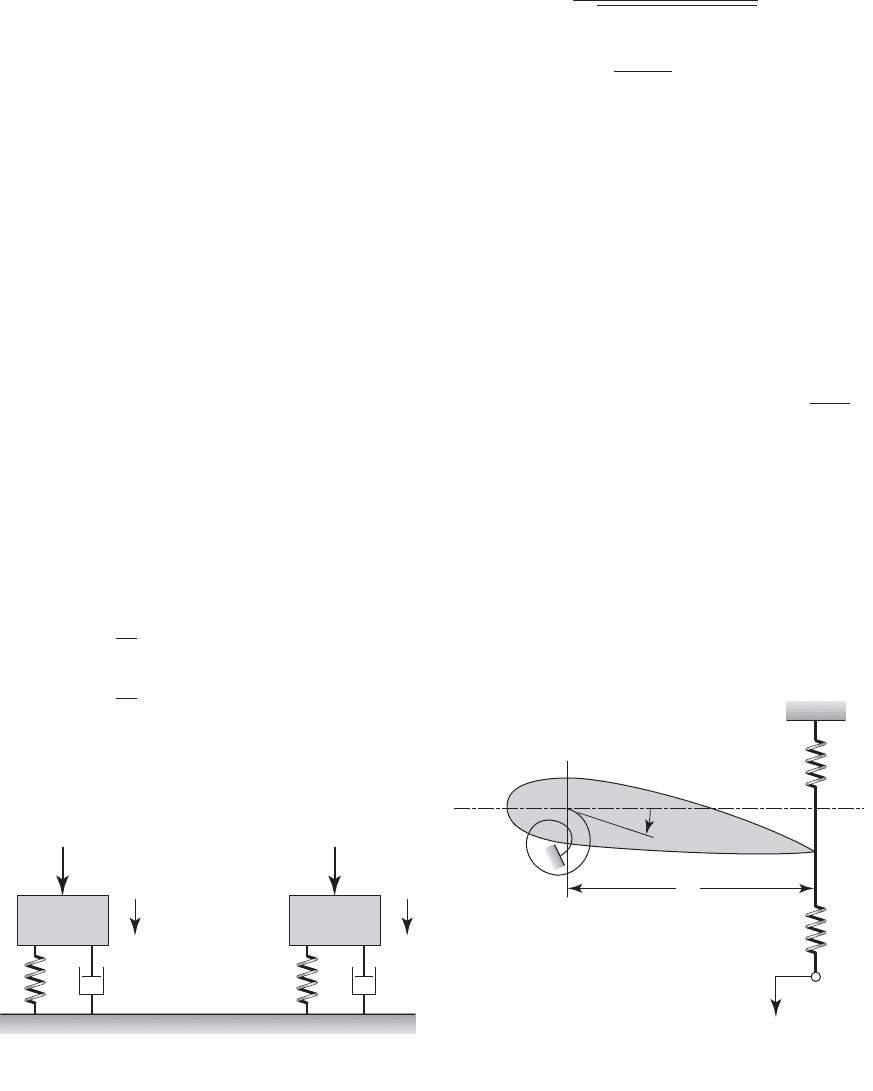
5.5 The control tab of an airplane elevator is shown
schematically in the Figure E5.5. The mass moment
of inertia J
o
of the control tab about the hinge point O
is known, but the torsional spring constant k
1
associ-
ated with the control linkage is difficult to evaluate,
and hence, the natural frequency is
difficult to determine. An experiment is designed to
determine this natural frequency of the system. In this
experiment, the elevator is rigidly mounted, springs
with stiffness k
1
and stiffness k
2
are attached to the
control tab, and the tab is harmonically excited at an
amplitude e, as illustrated in the figure. The excitation
frequency v is varied until resonance occurs at v
v
r
, and this value is noted. Assuming that the damping
in the system is negligible, determine an expression
for v
n
in terms of v
r
, k
1
, k
2
, J
o
, and L.
v
n
1k
t
/
J
o
u1a, b 2 tan
1
2ba
1 a
2
H1a, b 2
1
211 a
2
2
2
12ba2
2
278 CHAPTER 5 Single Degree-of-Freedom Systems Subjected to Periodic Excitations
c
2
x
2
x
1
f
1
(t) f
2
(t)
k
2
c
1
k
1
m
1
m
2
FIGURE E5.4
0
0
k
2
k
1
k
t
J
o
L
Control tab
e sin t
FIGURE E5.5
Exercises 279
5.6
Consider translational motions of a vibratory
system with a mass m of 200 kg and a stiffness k
of 200 N/m. When a harmonic forcing of the form
F
o
sin(vt) is suddenly applied to the mass of the sys-
tem, where F
o
1.0 N, determine the responses of the
system and plot them for the following cases: (a) v
0.2 rad/s, (b) v 1.0 rad/s, and (c) v 2.0 rad/s, and
discuss the results.
Section 5.3.3
5.7 A micromechanical resonator is to be designed
to have a Q factor of 1000 and a natural frequency of
2 kHz. Determine the system-damping factor and the
system bandwidth.
5.8 If a sensor modeled as a mass-spring-damper sys-
tem is to be redesigned so that its sensitivity is in-
creased by a factor of four, determine the correspon-
ding percentage changes in the system natural
frequency and damping ratio.
Section 5.3.4
5.9 Consider the machine of 25 kg mass that is
mounted on springs and dampers as shown in Figure
E5.9. The equivalent stiffness of the spring combina-
tion is 9 kN/m, and the equivalent damping of the
damper combination is 150 N s/m. An excitation
#
force F(t) is directly applied to the mass of the system,
as shown in the figure. Consider the displacement x(t)
as the output, the forcing F(t) as the input, and deter-
mine the frequency response of this system.
Section 5.4
5.10 An air compressor with a total mass of 100 kg is
operated at a constant speed of 2000 rpm. The unbal-
anced mass is 4 kg and the eccentricity is 0.12 m. The
properties of the mounting are such that the damping
factor z = 0.15. Determine the following: (a) the
spring stiffness that the mounting should have so that
only 20% of the unbalance force is transmitted to the
foundation and (b) determine the amplitude of the
transmitted force.
5.11 A motor of mass m is mounted at the end of a can-
tilever beam and it is found that the beam deflects
10 mm. When the motor is running at 1800 rpm, an
unbalanced force of 100 N is measured. If the beam
damping is negligible and its mass can be neglected,
then what speed should the motor operate at so that the
amplitude of the dynamic response is less than a
o
m.
Section 5.5
5.12 In the system shown in Figure E5.12, y(t) is the
base displacement and x(t) is the displacement
F(t)
x(t)
c
2
k
2
c
2
k
2
m
FIGURE E5.9
x(t)
y(t)
c2c
k
m
Base
FIGURE E5.12