Balakumar Balachandran, Magrab E.B. Vibrations
Подождите немного. Документ загружается.


EXAMPLE 5.17 Single degree-of-freedom system subjected to periodic pulse train
and saw-tooth forcing
We shall consider the responses of a single degree-of-freedom system to two
periodic input forcing functions: a periodic pulse train and a saw-tooth func-
tion. The pulse train and its Fourier series representation are given by wave-
form h of Table B in Appendix B. From this table we have that
or
(a)
where,
i
i
o
,
o
v
o
/v
n
, a t
d
/T, T 2p/v
o
, t v
n
t, and t
d
is
the duration of the pulse during each period. Thus, comparing Eq. (a) to
Eqs. (5.157), we have
(b)
Then, from Eqs. (5.159) and (5.160), we determine the displacement response
to be
(c)x1t 2
aF
o
k
c1 2
a
q
i 1
c
i
1
i
2sin 1
i
t u1
i
2 c
i
2d
a
i
2aF
o
sin 1ipa2
ipa
a
0
2
aF
o
b
i
0
f
i
tan
1
a
i
b
i
f 1t2 F
o
a c1 2
a
q
i 1
sin 1ipa2
1ipa 2
cos 1
i
t22d
f 1t 2 F
o
a c1 2
a
q
i 1
sin 1ipa2
1ipa 2
cos 12ipt/T2d
260 CHAPTER 5 Single Degree-of-Freedom Systems Subjected to Periodic Excitations
Design Guidelines: When an excitation force to a linear vibratory
system is composed of more than one harmonic waveform, the dis-
placement response of the system is composed of scaled and phase
shifted versions of each of these input waveforms. The displacement re-
sponse of each force input waveform is modified by the amplitude re-
sponse of the system at that waveform’s frequency and it is delayed by
system’s phase response at that frequency. If the system’s damping ra-
tio is small, then in order to avoid amplifying these input waveforms,
the constituent frequency components of the forcing should not be in
the system’s damping-dominated region. If the input waveform is com-
posed of commensurate frequency components, then one must select
the period such that neither the fundamental frequency nor any of the
higher harmonics fall in the system’s damping-dominated region.

where
(d)
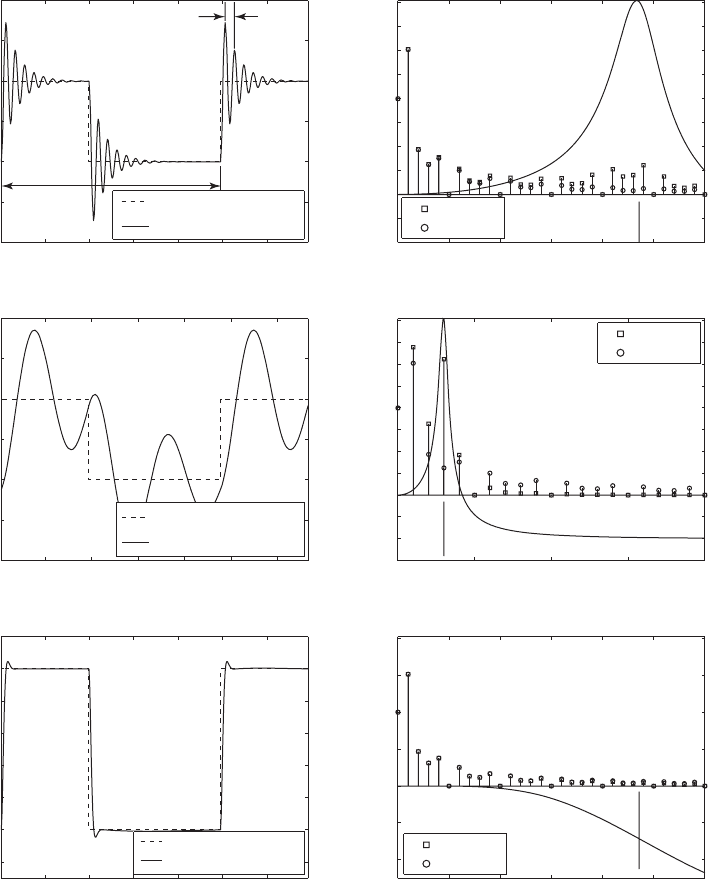
Equation (c) is plotted
28
in Figure 5.41 for
o
0.0424, a 0.4, and z
0.1. Thus, the non-dimensional period is v
n
T 2p/
o
148.2 andv
n
/v
o
1/
o
23.57, which indicates that the 23rd and 24th harmonics fall in the
vicinity of v
n
. In Figure 5.41a, we see that the normalized output displace-
ment response overshoots the input pulse’s amplitude and then exhibits a de-
caying oscillation about the pulse’s normalized height. Since v
n
/v
o
23.57,
the period of the pulse train is 23.57 times longer than the period of the nat-
ural frequency of the system; therefore, the nondimensional period of the de-
caying oscillation is 148.2/23.57 2p. We will show in Section 6.3 that this
response is equivalent to the response of a single degree-of-freedom system
subjected to a suddenly applied constant force. When damping increases sub-
stantially, these oscillations are almost eliminated as shown in Figure 5.41e.
The results plotted in Figure 5.41b are the amplitude spectrum of the
pulse train before it is applied to the mass and the amplitude spectrum of
the displacement of the mass in response to this force. We have also plotted
the system’s amplitude response function H() for reference. We see that the
system’s amplitude response function greatly magnifies the amplitude of
those components of the force that have frequency components in the vicin-
ity of the system’s natural frequency—the damping-dominated region. It is
this magnification that produces, in the time domain, the overshoot and
oscillations at a frequency equal to the system’s damped natural frequency.
We now see why large damping eliminates these oscillations. As shown in
Figure 5.41f, the amplitude components in the neighborhood of the system’s
natural frequency are all slightly attenuated; thus, the output response more
closely follows the input.
The next case we consider is where
o
1/3; that is, the natural fre-
quency of the system is three times the fundamental frequency of the pulse
train. Thus, the nondimensional period is v
n
T 2p/
o
18.9 and v
n
/v
o
1/
o
3.0. We see from Figure 5.41d that since the pulse train’s third har-
monic coincides with the natural frequency of the system, the amplitude of
the third harmonic undergoes the maximum magnification. Thus, the time do-
main response, which is shown in Figure 5.41c, is dominated by the compo-
nent whose frequency is coincident with the system’s natural frequency. Con-
sequently, the displacement response does not bear any resemblance to the
input forcing function, except that it has the same period.
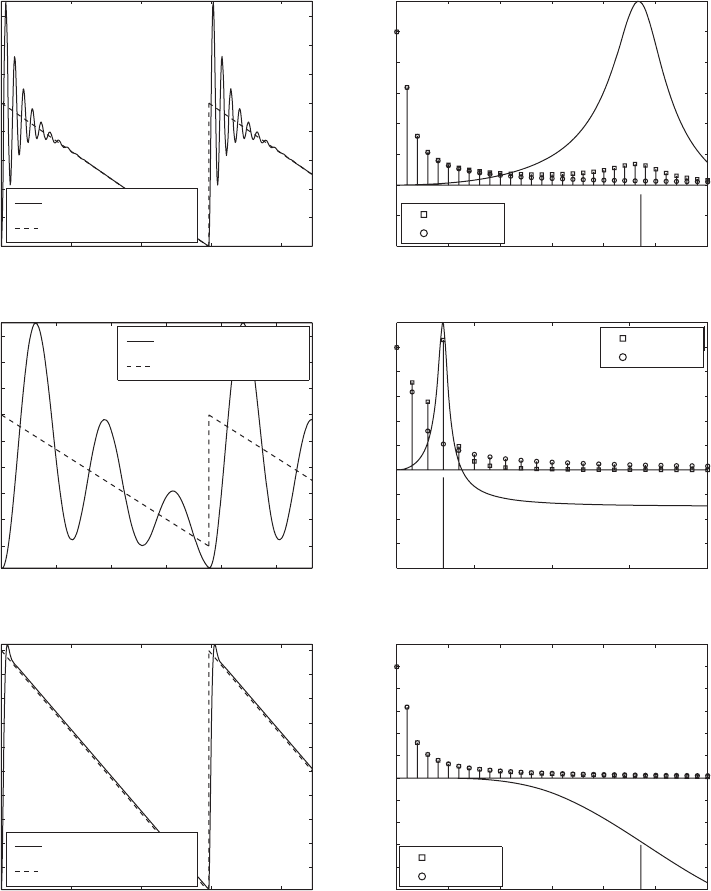
The responses of a linear vibratory system subjected to a saw-tooth type
forcing waveform given by entry b of Table B in Appendix B are shown in
Figure 5.42. Several qualitative aspects of these responses are similar to those
u1
i
2 tan
1
2z
i
1
2
i
c
i
1
i
2
1
211
2
i
2
2
12z
i
2
2
`
sin 1ipa2
ipa
`
i 1, 2, . . .
5.9 Response to Excitation with Harmonic Components 261
28
200 terms were used in the summation.
0 30 60 90 120 150 180
−1
−0.5
0
0.5
1
1.5
2
2p
148.2
Amplitude
t
Input − F(t )/F
o
Output − x(t)/(F
o
/k)
(a)
0 5 10 15 20 25 30
−0.2
−0.1
0
0.1
0.2
0.3
0.4
0.5
0.6
0.7
0.8
1/
Ω
o
23.57
Harmonic number (i)
1
H(Ω)
H(Ω
?
)
→
5
Output
Input
(b)
0 4 8 12 16 20 24
−1
−0.5
0
0.5
1
1.5
2
Amplitude
t
Input − F(t)/F
o
(c)
0 5 10 15 20
−0.2
−0.1
0
0.1
0.2
0.3
0.4
0.5
0.6
0.7
0.8
1/
Ω
o
3
Harmonic number (i)
1
H(Ω)
H(
Ω
)
→
5
Output
Input
(d)
0 30 60 90 120 150 180
−0.2
0
0.2
0.4
0.6
0.8
1
1.2
Amplitude
t
Input − F(t)/F
o
(e)
c
i
, c
i
H(Ω
i
)c
i
, c
i
H(Ω
i
)
c
i
, c
i
H(Ω
i
)
0 5 10 15 20 25 30
−0.4
−0.2
0
0.2
0.4
0.6
0.8
1/
Ω
o
23.57
Harmonic number (i)
1
H(Ω)
H(
Ω
)
→
−0.5
Output
Input
(f)
Time domain Frequency domain
Output − x(t)/(F
o
/k)
Output − x(t)/(F
o
/k)
FIGURE 5.41
Comparison of responses to pulse train forcing function in the time domain and frequency domain for two different values of the
system damping ratio and two different fundamental excitation frequencies: (a) and (b) z 0.1, t
d
/T 0.4, and
o
0.0424;
(c) and (d) z 0.1, t
d
/T 0.4, and
o
0.333; and (e) and (f) z 0.7, t
d
/T 0.4, and
o
0.0424. [Note: For display purposes
the time axes have been shifted by a/
o
.]
0 50 100 150 200
0.2
0.4
0.6
0.8
1
1.2
1.4
1.6
t
Amplitude
Input − F(t)/F
o
(a)
0 5 10 15 20 25 30
−0.2
−0.1
0
0.1
0.2
0.3
0.4
0.5
0.6
1/Ω
o
23.57
Harmonic number (i)
1
H(Ω)
H(Ω)
→
5
Output
Input
(b)
0 5 10 15 20 25
0
0.2
0.4
0.6
0.8
1
1.2
1.4
1.6
t
Amplitude
Input − F(t)/F
o
(c)
0 5 10 15 20
−0.4
−0.3
−0.2
−0.1
0
0.1
0.2
0.3
0.4
0.5
0.6
Harmonic number (i)
1
H(Ω)
H(Ω)
→
5
Output
Input
(d)
0 50 100 150 200
0.1
0.2
0.3
0.4
0.5
0.6
0.7
0.8
0.9
1
t
Amplitude
Output − x(t)/(F
o
/k)
Output − x(t)/(F
o
/k)
Output − x(t)/(F
o
/k)
Input − F(t)/F
o
(e)
0 5 10 15 20 25 30
−0.5
−0.4
−0.3
−0.2
−0.1
0
0.1
0.2
0.3
0.4
0.5
1/Ω
o
23.57
1/Ω
o
3
Harmonic number (i)
1
H(
Ω
)
H(Ω)
→
−.5
Output
Input
(f)
Time domain
Frequency domain
c
i
, c
i
H(Ω
i
)c
i
, c
i
H(Ω
i
)c
i
, c
i
H(Ω
i
)
FIGURE 5.42
Comparison of the responses to a periodic saw-tooth forcing function in the time domain and frequency domain for two different
values of the system damping ratio and two different fundamental excitation frequencies: (a) and (b) z 0.1 and
o
0.0424;
(c) and (d) z 0.1 and
o
0.333; and (e) and (f) z 0.7 and
o
0.0424.

seen in Figure 5.41, where a periodic pulse train forcing and the correspon-
ding response are presented. As discussed in Section 6.3, a step-like change
in the input to a linear damped system always results in a “transient” compo-
nent of the response. It is seen that the transient response within each period
of the response is also captured.
EXAMPLE 5.18
Single degree-of-freedom system response to periodic impulses
29
We shall consider the response of a single degree-of-freedom system that is
subjected to a periodic train of force impulses of period T. We shall compare
these results to those obtained for a pulse train and determine under what con-
ditions a pulse train can be used to imitate a periodic impulse train. The peri-
odic impulse force is given by
(a)
where d(t) is a generalized function called the delta function.
30
The delta
function can be expressed as the following Fourier series
31
or, in terms of nondimensional quantities as
(b)
where
i
i
o
,
o
v
o
/v
n
, v
o
2p/T, and F
o
has the units N s. Compar-
ing Eq. (b) with Eq. (5.157), we have
(c)
From Eqs. (5.159) and (5.160), we determine the displacement response to be
(d)x 1t 2
F¿
o
mv
n
o
2p
c1 2
a
q
i 1
H1
i
2cos 1
i
t u1
i
22d
a
i
2F¿
o
T
c
i
tan
1
2F¿
o
/T
0
p
2
a
0
2
F¿
o
T
b
i
0
#
f 1t2
F¿
o
T
c1 2
a
q
i 1
cos 1
i
t2d
f 1t 2
F¿
o
T
c1 2
a
q
i 1
cos 12ipt/T2d
f 1t 2 F¿
o
a
q
iq
d 1t iT 2
264 CHAPTER 5 Single Degree-of-Freedom Systems Subjected to Periodic Excitations
29
For a complete discussion of the subject, see V. I. Babitsky, Theory of Vibro-Impact Systems
and Applications, Springer, Berlin (1998). See also S. A. Kember and V. I. Babitsky, “Excitation
of vibro-impact systems by periodic excitation,” J. Sound Vibration, Vol. 227, No. 2, pp. 427–447
(1999).
30
See Section 6.2 for a discussion of the delta function and the units of .
31
See, for example, A. Papoulis, The Fourier Integral and Its Applications, McGraw-Hill, NY,
p. 44 (1962).
F ¿
o

It is noted from Eqs. (a) and (c) that the magnitude of the Fourier series coef-
ficients are constants, independent of the fundamental frequency of the pulse
train and its harmonics, and for n 1, these constants are equal. Thus, the pe-
riodic impulse train has a discrete, uniform harmonic spectrum, with each
spectral component occurring at integer multiples of v
o
.
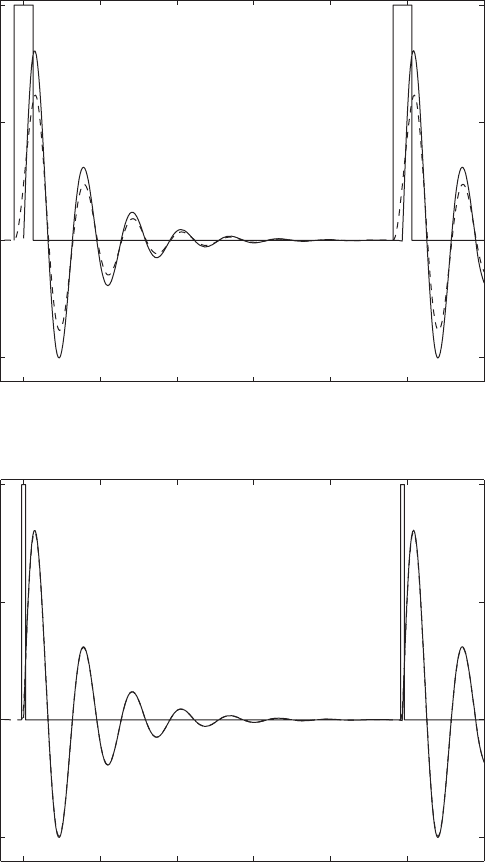
Equation (d) is plotted in Figure 5.43 along with the results of the peri-
odic pulse train given by Eq. (c) of Example 5.17. In order to compare the two
solutions, we note that . Thus, in Eq. (c) of Example 5.17, we have
(e)
We see from Figure 5.43b that when t
d
/T 0.01, the pulse train is a good ap-
proximation to the impulse train, since both responses overlap.
EXAMPLE 5.19
Base excitation: slider-crank mechanism
Consider the slider-crank mechanism that is attached to the base of the single
degree-of-freedom system shown in Figure 5.44. We shall determine the dis-
placement response of the mass and the corresponding response spectrum.
The displacement of the base due to the slider-crank is
32
(a)
where
(b)
and v
o
is the rotational frequency of the crank arm of length R. The corre-
sponding velocity is
(c)
In this notation, Eq. (5.76) takes the form
(d)
d
2
w
dt
2
2z
dw
dt
w 2z
dy
dt
y
o
R
L
csin 1
o
t2
1R/L 2sin 1
o
t2cos 1
o
t2
21 1R/L2
2
sin
2
1
o
t2
d
dy
dt
1
R
L
y
1
R
L
t v
n
t
y y/L
o
v
o
/v
n
y 1t2
R
L
cos 1
o
t2 B1 a
R
L
b
2
sin
2
1
o
t2R
1/2
aF
o
k
t
d
F
o
kT
씮
F¿
o
kT
F¿
o
mv
n
o
2p
t
d
F
o
씮 F¿
o
5.9 Response to Excitation with Harmonic Components 265
32
S. G. Kelly, Fundamentals of Mechanical Vibrations, 2nd ed., McGraw Hill, NY, pp. 171–173
(2000); E. Brusa et al., “Torsional Vibration of Crankshafts: Effects of Non-Constant Moments
of Inertia,” J. Sound Vibration, Vol. 205, No. 2, pp. 135–150 (1997).
0 10 20 30 40 50 60
0.5
0
0.5
1
t
x(t)/[F
o
′/(v
n
m)]
0 10 20 30 40 50
60
0.5
0
0.5
1
t
x(t)/[F
o
′/(v
n
m)]
(a)
(b)
FIGURE 5.43
Responses of a single degree-of-freedom system to periodic force impulses and periodic
force pulse train: (a) t
d
/T 0.05 and (b) t
d
/T 0.01. (The solid lines are the responses to the
periodic impulses and the dashed lines are the responses to the pulse train. For case (b), the
responses are indistinguishable.)

where the response of the slider has been scaled as
w x/L (e)
Numerical Results and Discussion
The excitation described by Eq. (a) is periodic and has the Fourier components
at frequencies given by the harmonics of the (dimensionless) fundamental
frequency
o
. Instead of using the analytical expressions presented in this sec-
tion, due to the form of and its derivative, it is convenient to solve this
equation numerically.
33
We assume the following sets of parameters: a) R/L
0.8, z 0.1, and
o
0.3, .5, and 1; and b) R/L 0.1, z 0.1, and
o
0.3,
.5, and 1. The results are shown in the Figures 5.45 and 5.46, respectively. The
dashed horizontal lines in these figures represent the amplitude limits of .
The presence of multiple frequency components in the excitation (the
slider-crank’s displacement) results in a response with more than one fre-
quency component. By expanding Eq. (a), we can see that the second har-
monic is a consequence of the second term’s contribution to the displacement.
Thus, for 1, Eq. (a) is approximated by
(f)
While expansion given by Eq. (f) is sufficient for R/L 0.1, higher order
terms will be needed for R/L 0.8.
We see from Figures 5.45 and 5.46 that the transient response has died
out by the time t 50. If we take the discrete Fourier transform (DFT) of the
steady-state portion of the displacement response (t 50), then we can de-
termine the frequency content of the steady-state response. The frequency
spectrum indicates that the relative magnitude of the second harmonic is a
function of the rotation frequency of the slider-crank mechanism and the ra-
tio R/L, as can be seen in Eq. (f).
The relationship of the rotation frequency of the slide-crank mechanism
to the natural frequency of the system influences the relative magnitudes of
the two dominant frequency components of the base’s displacement. From
Eq. (f), we see that the ratio of amplitude of the second harmonic to the
amplitude of fundamental frequency is a
21
R/(4L). However, the system’s
y
1 a
R
2L
b
2
R
L
cos 1
o
t2 a
R
2L
b
2
cos 12
o
t2 . . .
0R/L 0
y
y1t2
5.9 Response to Excitation with Harmonic Components 267
k
c
Crank
R
L
m
o
t
FIGURE 5.44
Slider-crank mechanism connected to the base of a system.
33
The MATLAB function ode45 was used to obtain the solution to Eq. (d) and the MATLAB
function fft was used to determine the corresponding amplitude spectrum.
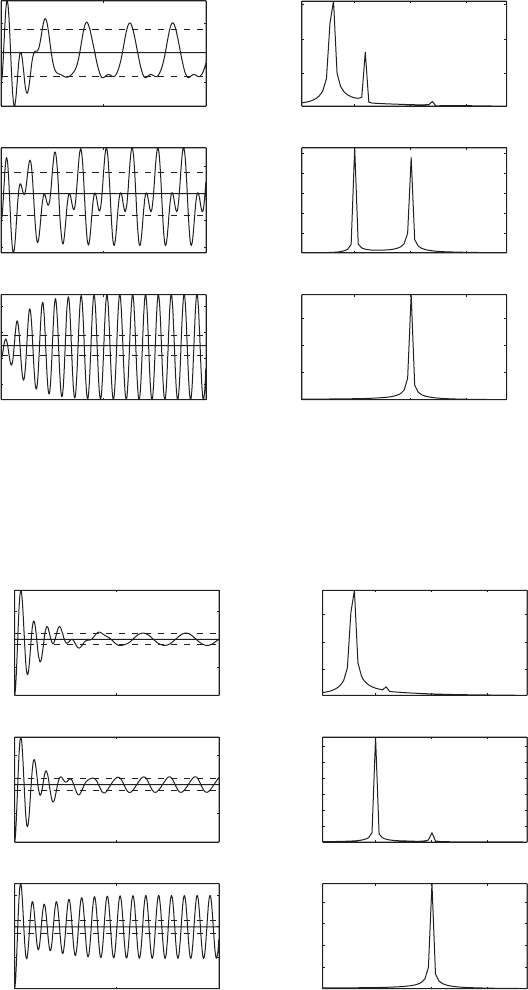
FIGURE 5.45
Slider-crank mechanism: displacement response of the mass and the steady-state response
spectrum of the displacement for R/L 0.8 and z 0.1.
FIGURE 5.46
Slider-crank mechanism: displacement response of the mass and the steady-state response
spectrum of the displacement for R/L 0.1 and z 0.1.
0 50 100
0
1
2
w(t)
0.5 1 1.5
0.2
0.4
0.6
Amplitude
0 50 100
1
0
1
2
w(t)
0.5 1 1.5
0.2
0.4
0.6
0.8
1
Amplitude
Ω
o
0 50 100
2
0
2
4
w(t)
t
0.5 1 1.5
1
2
3
Amplitude
Ω
Time domain Frequency domain
0 . 5
Ω
o
1
Ω
o
0 . 3
0 50 100
0
0.5
1
1.5
w(t)
0.5 1 1.5
0.02
0.04
0.06
Amplitude
0 50 100
0
0.5
1
1.5
w(t)
0.5 1 1.5
0.02
0.04
0.06
0.08
0.1
0.12
Amplitude
0 50 100
0
0.5
1
1.5
w(t)
t
0.5 1 1.5
0.1
0.2
0.3
0.4
Amplitude
Ω
Time domain Frequency domain
Ω
o
0 . 5
Ω
o
1
Ω
o
0.13

amplitude response function H
mb
(), given by Eqs. (5.82), modifies each of
these components at their respective frequencies. Thus, the ratio of the am-
plitude of the second harmonic to that of the fundamental is
(g)
We are now in a position to explain the amplitude spectral plots for
o
0.5.
From Eq. (5.89), we have seen that the magnification of a frequency located
at the natural frequency of the base-excited system is approximately 1/(2z)
for small damping factors. Since z 0.1, the magnification factor is 5. When
o
0.5, the second harmonic coincides with the system’s natural frequency,
thereby magnifying it by a factor of 5. Thus, for case (1), where R/L 0.8,
we find that
and when R/L 0.1,
which are comparable to the numerical values determined from the figures.
5.10 INFLUENCE OF NONLINEAR STIFFNESS ON FORCED RESPONSE
In this section, we examine the forced response of nonlinear single degree-of-
freedom systems to harmonic excitation of the form
f(t) F
o
cos(
o
t) (5.161)
where F
o
is the excitation amplitude,
o
v
o
/v
n
is the nondimensional fre-
quency, t v
n
t is the nondimensional time, and v
o
is the excitation fre-
quency. The single-degree-of-freedom systems considered in this section
have stiffness nonlinearity. In one case, the nonlinearity is cubic, while in an-
other case, the nonlinearity is due to loss of contact in the system. Notions
such as the backbone curve are discussed in this section and the effects of the
nonlinearity on the frequency response of the system are illustrated. The de-
pendence of the response on the excitation magnitude F
o
is also studied.
Case 1: System with Cubic Nonlinearity
In this case, the system has the form
(5.162)
where k is the linear stiffness and a is the coefficient of the nonlinear term
with units of (length)
2
.
d
2
x
dt
2
2z
dx
dt
x ax
3
F
o
k
cos 1
o
t2
R
21
10.5 2
0.1
4
H
mb
11 2
H
mb
10.5 2
0.025 a
5
1.32
b 0.095
R
21
10.5 2
0.8
4
H
mb
11 2
H
mb
10.5 2
0.2 a
5
1.32
b 0.76
R
21
1
o
2
R
4L
H
mb
12
o
2
H
mb
1
o
2
5.10 Influence of Nonlinear Stiffness on Forced Response 269