Bayer R.G. Mechanical Wear Fundamentals and Testing, Revised and Expanded
Подождите немного. Документ загружается.

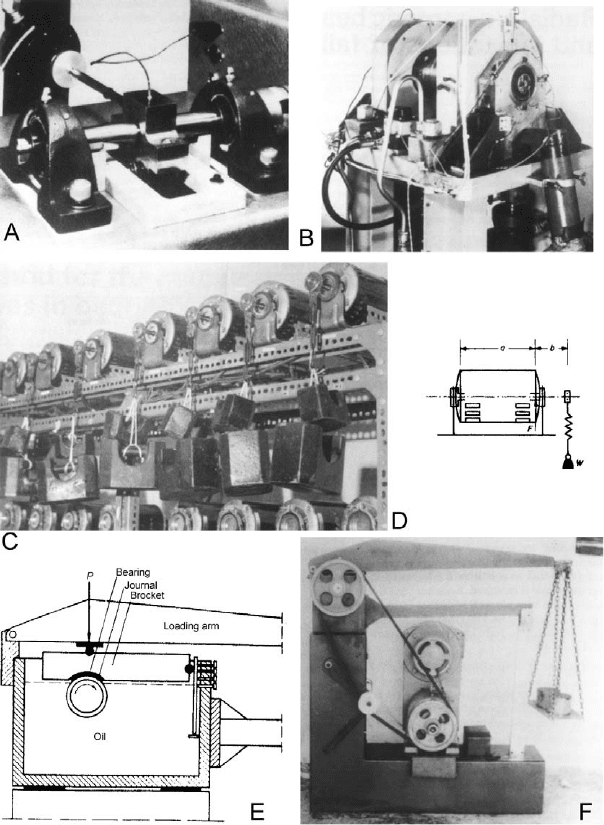
The general goal of these bearing tests is to correlate design and application param-
eters with life. This is typically done by adjusting and controlling the bearing and test
conditions to those of interest, including such things as the materials, dimensions, and
lubrication system of the bearings. Also, the loading conditions of the applications are
simulated, as well as the nature of the motion, stop=start conditions, and the environment.
The general approach is to monitor the wear measure during the test. In the case of ball
and roller bearings, the duratio n of the test is usually until failure occurs. This is often the
case with journal bearing tests as well, but these tests may be carried out only to the point
needed to establish a stable wear rate. These stable wear rates are then used to project life.
Figure 9.84 Examples of testers used in journal bearing wear tests. (‘‘A’’ from Ref. 89; ‘‘B’’ from
Ref. 129; ‘‘C’’ and ‘‘D’’ from Ref. 130; ‘‘E’’ and ‘‘F’’ from Ref. 131; reprinted with permission from
Butterworth Heinemann Ltd.)
Copyright 2004 by Marcel Dekker, Inc. All Rights Reserved.
These tests provide a value for the life of the bearing for a set of operational con-
ditions and, if the simulation is complete enough, this can be a direct assessment of field
life. However, there are more sophisticated approaches and uses of the data beyond this
direct and simple use of the test results. These methods of using the data vary with the
type of bearing. For ball and roller bearings, the tests are frequently used to establish the
parameters in the load-life relationships and adjustment factors used for these types
of bearings (86,90–93). For journal bearings, a common approach is to use a P-V
concept to interpret the data (94). In this case, the concept is either to identify acceptable
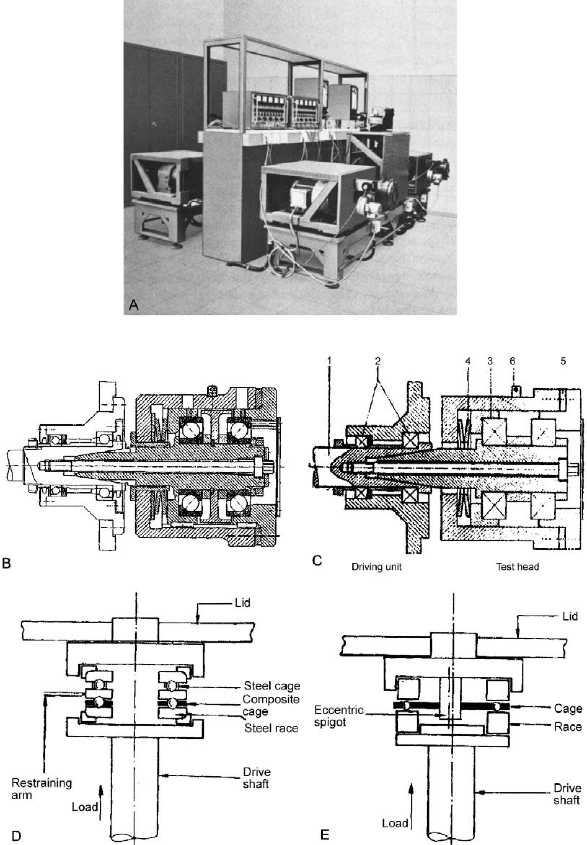
Figure 9.85 Examples of testers used in roller and ball bearing wear tests. (‘‘A’’, ‘‘B’’, and ‘‘C’’
from Ref. 131, reprinted with permission from FAG Bearing Corp.; ‘‘D’’, ‘‘E’’, and ‘‘F’’ from
Ref. 132, reprinted with permission from Butterworth Heinemann Ltd.)
Copyright 2004 by Marcel Dekker, Inc. All Rights Reserved.
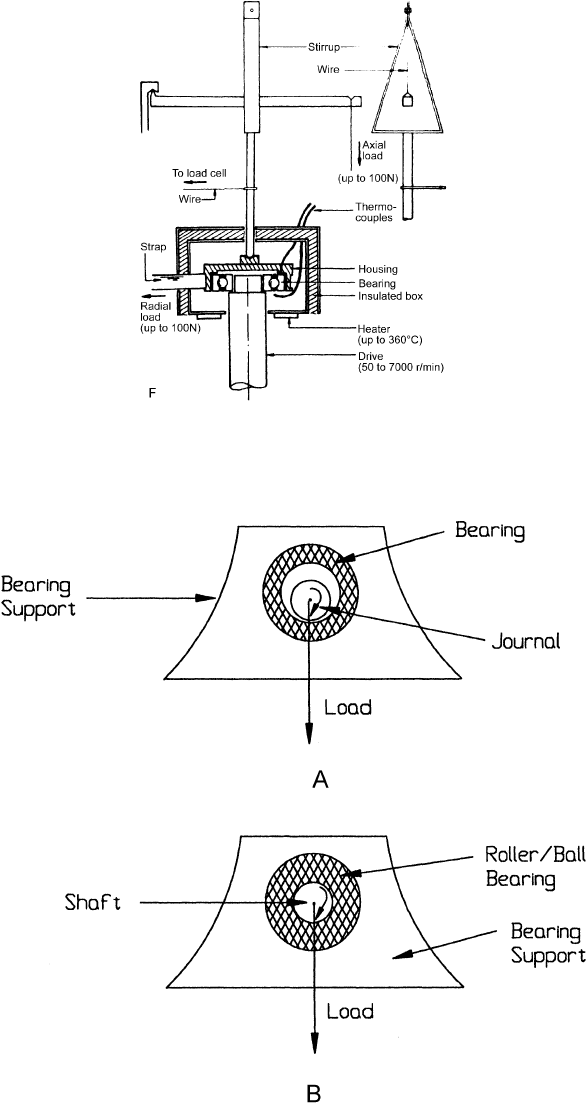
Figure 9.85 (continued )
Figure 9.86 General configuration of bearing wear tests: ‘‘A’’, journal bearings; ‘‘B’’, ball and
roller bearings.
Copyright 2004 by Marcel Dekker, Inc. All Rights Reserved.
combinations of pressure and velocity as a function of all the other variables or to deter-
mine the wear rate for conditions where the product of pressure and velocity are
constant as a function of the other parameters. These methods are covered in Secs.
2.7 and 2.8 (EDW2E).
Bearing tests of the type discussed are generally quite long, since they are similar to
applications in terms of operating parameters. Because of this and the complex nature of
these devices, these type of tests are generally combined with phenomenological tests.
Phenomenological tests provide initial screening to select candidate material and condi-
tions for the bearing tests. They also pro vide the opportunity to investigate in more
detail specific aspects that are involv ed in overall bearing performance (56,87,95).
A variety of sli ding and roll ing wear tests is used in this fashion. Pin-on-disk and crossed
cylinder tests (Secs. 9.2.8 and 9.2.7, respectively) have been used to simulate sliding
wear aspects in journal bearings under boundary lubrication conditions and between balls
and cages in ball bearings. The rolling wear test discussed previously in the pheno-
menological section (Sec. 9.2.10) and ball rolling tests have been us ed to simulate race
and roller wear in ball and roller bearings.
9.3.6. Brake Material Wear Tests
Dynamometers of various types are typically used to evaluate the wear and friction
behavior of brake material systems (96–98). Such tests are used to evaluate both the
friction (brake) material and the counterface (rotor) material. Two illustrations of typi-
caldynamometerconfigurationsareshowninFigs.9.88
and9.89. With this type of
apparatus, the wear behavior is evaluated under braking conditions which simulate
application conditions. This typically results in a complex testing procedure or sequence
to provide adequate simulation. A typical example of a test sequence used for automo-
tivebrakesisshowninTable9.6
. These sequences simulate the synergistic effects of
break-in, high speed stops, low speed stops, pulsed and continuous braking, etc. These
same test sequences are also used in conjunction with different ambient conditions to
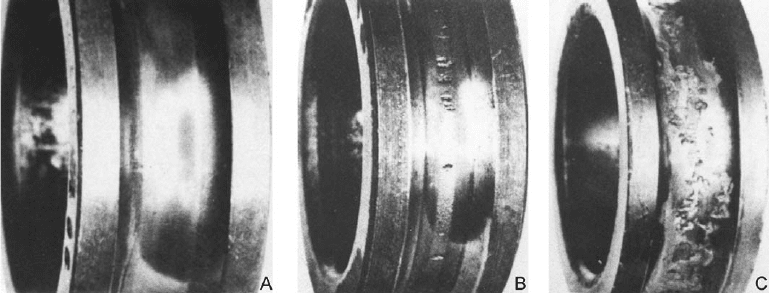
Figure 9.87 ‘‘A’’ shows an example of the appearances of the wear scars on the races of bearings
during the initial stages of wear. ‘‘B’’, in the intermediate stages. ‘‘C’’, in the final stages. Which stage
represents ‘‘end-of-life’’ depends on the application. For most applications ‘‘B’’ would be more
representative than ‘‘A’’, and ‘‘C’’ is generally unacceptable. (From Ref. 93. Original source SKF
Industries, reprinted with permission from Texaco’s magazine Lubrication.)
Copyright 2004 by Marcel Dekker, Inc. All Rights Reserved.
simulate use under different climatic conditions and at elevated temperatures. Typically,
mass loss or thickness measurements are used to determine wear of the brake material.
These techniques are usually not appropriate for the rotor material since their wear is
typically quite small in these tests. As a result, the degree or severity of rotor wear that
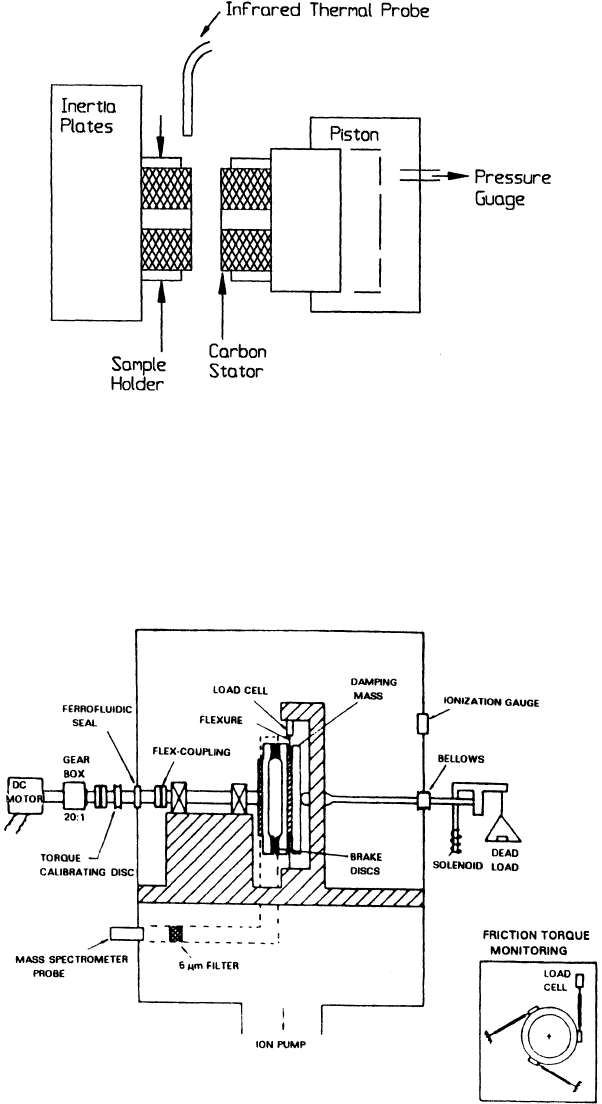
Figure 9.88 Basic configuration of a research dynamometer used for wear and friction evaluations
of brake materials. (From Ref. 96.)
Figure 9.89 Configuration of a high-vacuum dynamometer used for wear and friction evaluations
of brake materials. (From Ref. 133, reprinted with permission from ASME.)
Copyright 2004 by Marcel Dekker, Inc. All Rights Reserved.

occurs is usually characterized in terms of roughness changes. These wear measurements
are taken at various points in the test sequence.
Since the typical use of these dynamo meter tests is to provide a basis for selection
of materials and design parameters for more extensive and costly field evaluations, these
tests are designed to provide a relative ranking rather than an absolute determination of
wear behavior or wear coefficients. One approach is to simulate the contact conditions
with a standard configuration and a small sample of the brake material. In this case, the
dynamometers are smaller and less complex, and the tests are easier to implement. An
example of this approach is the use of the Chase dynamometer for these evaluations
(99). While this approach is attractive from an implementation standpoint, the reduction
in scale reduces simulation with the result that there is often poor correlation with field
performance (99). Another approach that is used is to evaluate full-sized brake systems.
This generally results in the need for large r, more complex, and expensive dynam-
ometers and more complex tests. However, this approach has generally been found to
correlate well with field performance (99). Because of this, full-sized testing is the recom-
mended method for establishing material rankings. The smaller scale tests are used for
more general purposes, such as investigating the effect of vacuum on performance and
determining general trends (100), but care must be taken in extrapolating the results to
specific applications.
The rankings in dynamometer tests are determined directly by the amount of wear
generated in the test sequence. The best performer is the one that has the least amount
of wear at the end of the test. While there is generally good correlation with test performed
with full-sized brakes, the tests do not provide universal rankings since the rankings are
for specific applications. Different rankings can be obtained with other tests. This is
because the test sequence is selected to simulate a specific application and, when a full-size
brakeisused,thewearperformanceisrelativetothatdesign.Table9.7
shows the results
of tests on four different materials using two different test apparatuses and test sequences.
In these tests, the rankings are based on thickness chan ge of the brake material. It can
be seen that differences in rankings are obtained with these two tests.
The complex and interactive nature of these full-scale dynamometer tests provides an
effective means of assessing wear performance in terms of application parameters. For
example, these tests provide a means of determining the effect of relative humidity, pul-
sing, or rotor roughness on brake performance. At the same time, this same nature inhibits
the determination of basic wear parameters or coefficients of fundamental wear relation-
ships. As an example, they do not provide a means of determining the coefficients of a
Table 9.6 Test Sequence Used in a Chase Sample Dynamometer Wear and Friction vs
Temperature Procedure
Initial burnishing Twenty min drag at 312 rpm with 100 lb load
with a maximum temperature of 200
F
Speed of drum 325 rpm
Load 350 in.-lbs
Test sequences,
Drum temperatures (
F) 250, 350, 450, 550, 650, 780, 250, 350, 450
Applications Forty of 20 sec duration at each temperature
Wear measurements Sample weighted and thickness measured after
each test at a different temperature
Source: Ref. 99.
Copyright 2004 by Marcel Dekker, Inc. All Rights Reserved.

fundamental equation proposed for wear of brake materials, Eq. (9.24), or verif ying the
applicability of the equation (101).
W ¼ KP
a
v
b
T
c
ð9:24Þ
In Eq. (9.24), W is the wear volume; P, the normal load; v, velocity; T, tempera-
ture. The situation is too complex and interactive in these full-scale dynamometer tests
to isolate the effect of these parameters and to allow the determination of the coeffi-
cients, a, b, and c associated with them. This is a co mmon feat ure of operational wear
tests. The effect of these parameters can be isolated and the coeffici ents, including K,
determined with phenomenological tests, which are generally simpler but less simulative.
9.3.7. Engine Wear Tests
Many of the wear situations encountered in engines are complex and are difficult to
simulate. One aspect is the simulation of the local environment, for example, the com-
bination of combustion products and temperature that exists in various locations within
the engine. Another aspect is associated with the complex lubrication phenomena that
take place in engines. Lubricants contain active agents which, along with co mbustion
products, can react with the surfaces and form a variety of surface layers which can
influence wear beh avior in the boundary lubrication regime. The high speeds, amount
of lubricant involved, and the conforming nature of the components can result in
hydrodynamic lubrication as well. At many points within an engine, the occurrence
of wear is associated with the presence or absence of this type of lubrication. These
different aspects are interrelated as well. For example, temperature can influence both
boundary and hydrodynamic lubrication, which in turn influence friction, which in turn
influences temperature. Wear also influences the conformity between surfaces, which
influences hydrodynamic and boundary lubrication, which influence wear. With this
type of complexity to simulate laboratory engine tests provide a ‘‘natural’’ simulation
and are often used as tests to address engine wear concerns. Additional advantages with
this type of test are that naturally occu rring wear points can be identified, and many
wear points can be evaluated simultaneously.
An example of this type of test is in a study of wear between cylinder liners and pis-
ton rings (102). In this study, three identical engines were laboratory tested under different
conditions of service. One engine was operated at high speed, another was operated at high
load, and the third was operated under mixed conditions. At the end of the test sequence,
Table 9.7 Wear Data Comparison as a Function of Fade and
Recovery Performance Sequences
Total wear (in)
Friction material
Chase
(Schedule J661A)
Inertial dynamometer
(Schedule 111)
A 0.009 0.006
B 0.011 0.019
C 0.022 0.027
D 0.017 0.031
Source: Ref. 99.
Copyright 2004 by Marcel Dekker, Inc. All Rights Reserved.
the cylinder liners and piston were removed and examined for wear. Several wear regions
could be observed on these parts, each with diffe rent wear characteristics. Figure 9.90
shows a cut-away section of a worn liner from these tests. The general nature of this wear
(e.g., small with irregular outlines), along with the size and shape of the parts, makes it
difficult to measure wear in terms of such measurements as volume, mass loss or dimen-
sional change. This is a common situation with these types of tests and therefore as a result
a variety of exami nation techniques and measur ement are used to assess the severity of the
wear and to provide a basis for comparison. In the liner study SEM, optical microscopy,
X-ray fluorescence spectroscopy (XFS) , energy dispersive X-ray spectroscopy (EDS), and
metallographic techniques were used for this purpose. Examples of some of the results of
theseanalysistechniquesareshowninFig.9.91
. Wear rates were estimated using the
amount of original surface roughness remaining. In other engine-wear studies rad ioactive
doping techniques have been used to quantify the wear (103) as have such measures as the
average width of a wear scar or amount of edge rounding. Mass loss is usually not possible
because of the large mass of the parts and the tendency for combustion products to coat
the parts, as well as multiple wear locations.
The states of wear found for the three different operating conditions were very simi-
lar and were not considered as significantly different. A fourth test, which was a field test,
was also done as a part of this study. The liners and pistons from the field test were
examined in the same manner as those from the laboratory tests. Little difference was
observed between the field and laboratory tests. This illustrates the good simulation that
laboratory tests of this type (e.g., full scale) can provide. It should be recognized that at
the same time it is difficult to quantify the results of these tests in terms of the more
fundamental measures of wear.
9.3.8. Tests for Glazing Coatings on Plastics
The purpose of these coatings is to protect plastic surfaces from optical degradation, either
in the form of reduced luster or transparency. These coatings are used extensively in the
mass transit industry to coat surfaces of such components as windows, windshields, lights,
and transparent panels. These surfaces can be worn or damaged by a variety of mechanisms
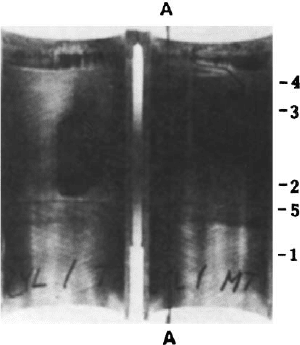
Figure 9.90 View of a cut cylinder liner from an engine test, indicating regions of different wear
behavior. (From Ref. 102, reprinted with permission from ASME.)
Copyright 2004 by Marcel Dekker, Inc. All Rights Reserved.
and as a result a variety of tests have been developed to address these different situations
(73). One of the modes encountered is the wear that is associated with the use of large,
rotating brushes in the washing of trains and buses; another is the wear associated with
the action of a windshield wiper. In both of these situations, sand or other abrasive par-
ticles can be drawn across the surface of the plastic by the action of the brush and the
wiper, causing wear. Operational tests have been developed to simulate both of these situa-
tions (104). The similarity of the tests to the wear situations is apparent in Figs.
9.92
and9.93. Controlled slurries, selected to be representative of those encountered in
practice, are used to provide the abrasive acti on in both tests. Loads and speeds
representative of these applications are used in these tests.
Wear in these tests is quantified by measuring the haze of the surface, which is
defined in ASTM D1003. These measur ements are used in different manners in the two
tests. In the Brush Abrasion Test, the change in the haze value from the initial value is
used as a measure of wear for comparing and ranking coatings. In the Wiper Test, the
amount of haze produced in the test is the measure since the specimens are initially trans-
parent. This type of functional wear measure is commonly used for the evaluation of
wear on optical surfaces.
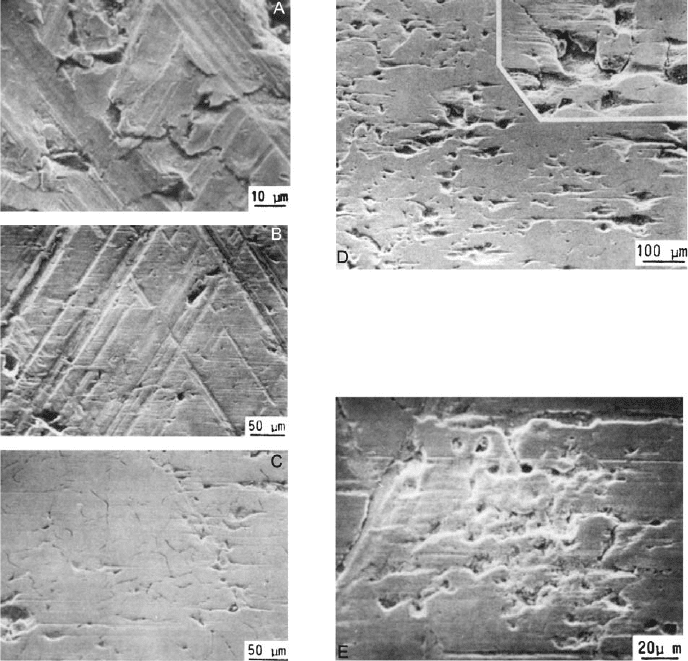
Figure 9.91 WearmorphologyatthelocationsindicatedinFig.9.90.‘‘A’’, unworn surface, A1;
‘‘B’’, A2; ‘‘C’’, A3; ‘‘D’’, A4; ‘‘E’’, A5. (From Ref. 102, reprinted with permission from ASME.)
Copyright 2004 by Marcel Dekker, Inc. All Rights Reserved.
Both of these tests correlate well with field experience. This is to be expected as a
result of their high degree of simulation provided by these tests. However less simulative,
more phenomenological tests can provide good correlation as well, provided they
simulate the basic wear mechanisms involved in the application. For example, tests with
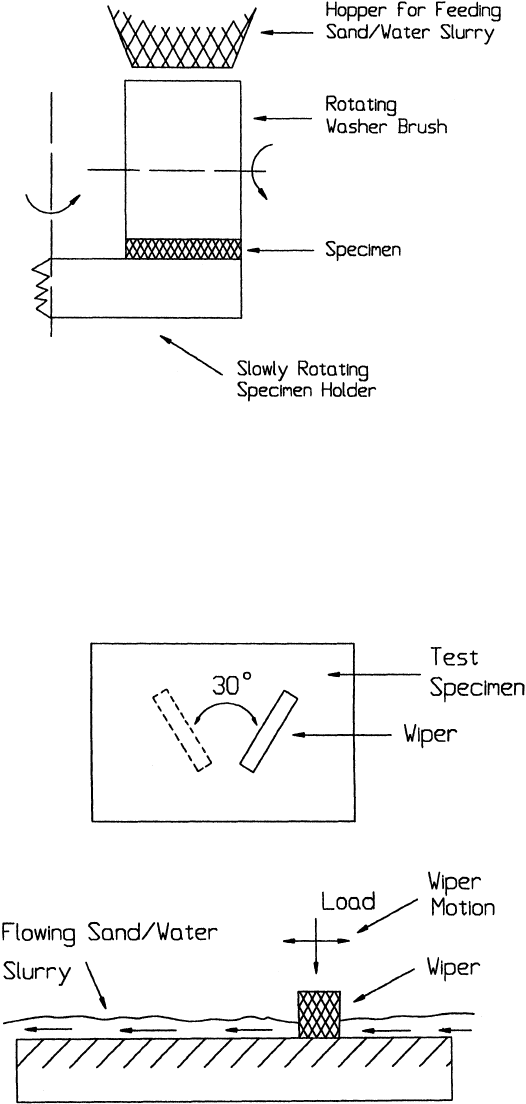
Figure 9.92 Diagram of test configuration used to simulate the wear caused by brushes during
the cleaning of vehicles.
Figure 9.93 Diagrams of the test configuration used to simulate the wear between wiper blades and
windshields.
Copyright 2004 by Marcel Dekker, Inc. All Rights Reserved.