Bayer R.G. Mechanical Wear Fundamentals and Testing, Revised and Expanded
Подождите немного. Документ загружается.

Table 10.1 ( Continued )
Standard (committee) Title Materials (parameters measured) Test configuration
D2047 (D-21 on
polishes)
Static Coefficient of Friction of Polish
Coated Floor Surfaces as Measured
by the James Machine
Flooring materials vs. shoe heels
and soles ( m
s
and m
k
)
D2394 (D-7 on wood) Simulated Service Testing of Wood
and Wood-base Finish Flooring
Wood and wood-base flooring vs.
sole leather (m
s
and m
k
)
D2714 (D-2 on
lubricants)
Calibration and Operation of Alpha
Model LFW-1 Friction and
Wear Testing Machine
Steel ring vs. block lubricated with
standard oil (m
k
)
Copyright 2004 by Marcel Dekker, Inc. All Rights Reserved.
D3028 (D-20 on plastics) Kinetic Coefficient of Friction
of Plastic Solids and Sheeting
Plastic sheets or solids vs. other solids
(m
s
and m
k
)
D3108
(D-13 on textiles)
Coefficient of Friction,
Yarn to Solid Material
Textile yarns vs. solids (m
k
)
D3247 (D-6 on paper) Coefficient of Static Friction of
Corrugated and Solid Fiberboard
Self-mated cardboard (m
s
)
D3248 (D-6 on paper) Coefficient of Static Friction of
Corrugated and Solid Fiberboard
(inclined plane method)
Self-mated cardboard (m
s
)
Copyright 2004 by Marcel Dekker, Inc. All Rights Reserved.
Table 10.1 ( Continued )
Standard (committee) Title Materials (parameters measured) Test configuration
D3334 (D-13 on textiles) Testing of Fabrics Woven from
Polyolefin Monofilaments
Self-mated woven fabric (m
s
)
D3412 (D-13 on textiles) Coefficient of Friction,
Yarn to Yarn
Continuous filament and spun
yarns self-mated (m
s
and m
k
)
Copyright 2004 by Marcel Dekker, Inc. All Rights Reserved.
E303 (E-17 on traveled
surfaces)
Measuring Surface Frictional
Properties Using the British
Pendulum Tester
Rubber vs. pavement (BPN,
British Pendulum Number)
E510 (E-17 on
traveled surfaces)
Determining Pavement Surface
Frictional and Polishing
Characteristics Using a Small
Torque Device
Rubber vs. pavement (TN,
torque number)
E670 (E-17 on traveled
surfaces)
Side Force Friction on Paved
Surfaces Using the Mu-Meter
Tires vs. pavement (m)
(F
fry
F
wet
)
Copyright 2004 by Marcel Dekker, Inc. All Rights Reserved.
Table 10.1 ( Continued )
Standard (committee) Title Materials (parameters measured) Test configuration
E707 (E-17 on
traveled surfaces)
Skid Resistance of Paved Surfaces Using
the North Carolina State University
Variable Speed Friction Tester
Rubber tires vs. pavement
(VSN, variable speed number)
F489 (F-13 on footwear) Rating of Static Coefficient of Shoe
Sole and Heel Materials as Measured
by the James Machine
Leather and rubber sole and heel
material vs. walking surfaces (m
s
)
F609 (F-13 on footwear) Test Method for Static Slip Resistance
of Footwear, Sole, Heel or Related
Materials by Horizontal Pull
Slipmeter (HPS)
Footwear materials vs. walking
surfaces (m
s
)
Copyright 2004 by Marcel Dekker, Inc. All Rights Reserved.
F695 (F-13 on footwear) Evaluation of Test Data Obtained by
Using the Horizontal Slipmeter or the
James Machine for Measurement of
Static Slip Resistance of Footwear,
Sole, Heel, or Related Materials
Footwear materials vs. walking surfaces
(reliable ranking of footwear for slip
resistance)(m
s
)
F732 (F-4 on medical
and surgical materials)
Reciprocating Pin-on-Flat Evaluation of
Friction and Wear Properties of Poly
meric Materials for Use in Total
Joint Prostheses
Materials for human joints (m
k
)
Copyright 2004 by Marcel Dekker, Inc. All Rights Reserved.
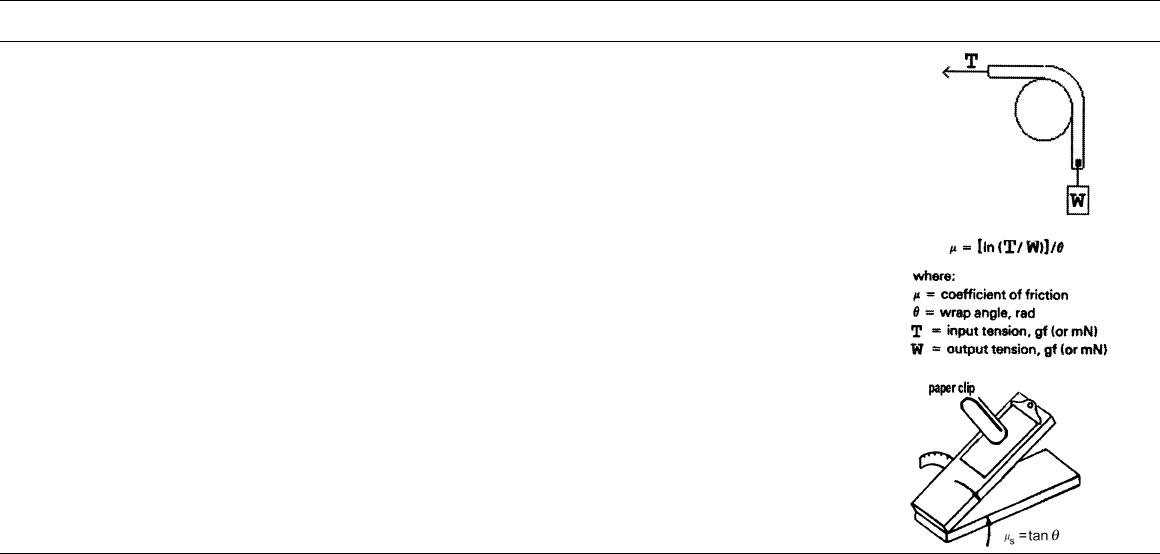
Table 10.1 ( Continued )
Standard (committee) Title Materials (parameters measured) Test configuration
G143 (G-2 on wear
and erosion)
Measurement of Web=Roller
Friction Characteristics
Plastic films and other flexible web
materials vs. roller surfaces (m
s
and m
k
)
G164 (G-2 on wear
and erosion)
Determination of Surface
Lubrication on Flexible Webs
Lubricated flexible web materials
vs. steel (detection of lubricant film
on surface) (m
s
)
Source: Refs. 1–4.
Copyright 2004 by Marcel Dekker, Inc. All Rights Reserved.
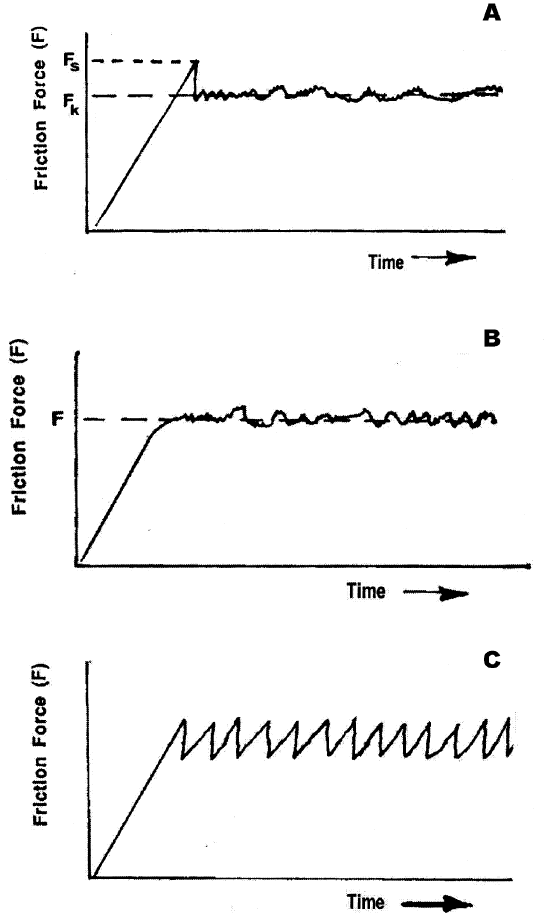
Figure 10.3 Examples of friction behavior in sliding tests. ‘‘A’’ illustrates a friction curve where the
force required to initiate sliding, F
s
, is higher than the average force needed to sustain motion, F
k
.
The static and dynamic coefficients are generally based on these two values, respectively. ‘‘B’’ illus-
trates a tribosystem which does not exhibit a higher breakaway force. This system has a single value
for the coefficient of friction, based on F, the average force to sustain motion. Stick-slip behavior is
illustrated in ‘‘C’’. In this case, the peak value is used to determine the static coefficient of friction.
(From Ref. 1. Reprinted with permission from ASM International.)
Copyright 2004 by Marcel Dekker, Inc. All Rights Reserved.

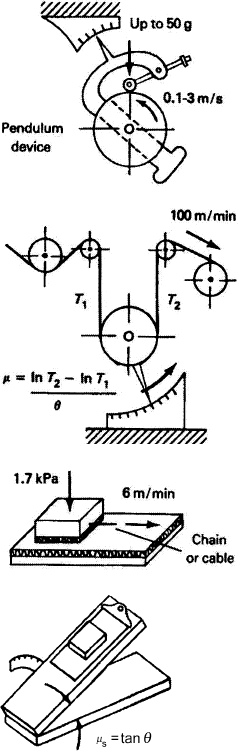
is the tilt angle. The tilt angle at which sliding starts gives the static coefficient of
friction. The minimum angle, which is needed to just susta in motion, gives the kin-
etic coefficient. For tests involving sliding over a cylindrical mandrel, the following
relationship is used:
m ¼
lnðT
1
=T
2
Þ
y
ð10:3Þ
In this equation, T
1
and T
2
are the tensions on each side of the mandrel (T
1
> T
2
) is the
difference in tension across the mandrel and is wrap angle in radians.
In friction tests where Eq. (10.1) is used, the friction force is usually measured as a
function of time during the test. Figure 10.3 shows two general forms of these data when
plotted as a function of time or sliding distance. Curve A illustrates a situation where the
static coefficient of friction is different than the kinetic coefficient of friction. In this
case, the static coefficient is based on the initial peak value of the force. The kinetic co-
efficient is generally based on a time-average of the force after slip takes place. Some
initial stick-slip behavior is also shown in this curve. Curve B is a general form where
there is no difference between the static coefficient and the dynamic, as well as no
stick-slip. In either case, these two graphs illustrate the fact that the friction force is
not usually constant but fluctuates in these tests. The ability to resolve such fluctuations,
including stick-slip behavior, curve C, and a difference between static and kinetic coeffi-
cients, depends on the resolution capability of the measuring system. In addition, the
stiffness of the apparatus can be a factor in stick-slip behavior and differences between
the static and kinetic coefficients. It is possible that both types of curves could be
observed for the same materials with different instrumentation and apparatus stiffness.
When the normal force is not constant, instantaneous values of the coefficient of friction
can be defined by simultaneously measuring the friction and normal. Again the ability to
resolve short-term fluctuations depends on the instrumentation.
An illustration of stick-slip behavior is also shown in Fig. 10.3, curve C. When this
occurs, only the static coefficient of friction can be determined, using the peak values of
the friction force. It is possible that variations in the peak force might be observed over
time, as a result of changing surface conditions.
As with wear test, it is generally recommended that details of the test be reported,
along with the results.
REFERENCES
1. K Budinski. In: P Blau, ed. Friction, Lubrication, and Wear Technology, ASM Handbook. 18.
Materials Park, OH: ASM International, 1992, pp 45–58.
2. Standard Guide for Measuring and Reporting Friction Coefficients. West Conshohocken,
PA: ASTM G115.
3. Standard Test Method for Measurement of Web=Roller Friction Characteristics. West
Conshohocken, PA: ASTM G143.
4. Standard Test Method for Determination of Surface Lubrication on Flexible Webs. West
Conshohocken, PA: ASTM G164.
Copyright 2004 by Marcel Dekker, Inc. All Rights Reserved.

Appendix
GALLING THRESHOLD STRESS
Material Pair
Threshold Stress
MPa Kpsi
Silicon bronze (Rb 94) Silicon bronze (Rb 94) 28 4
304 SS (Rb 77) 300 44
1020 (Rb 90) 440C SS (Rc 58) 14 2
1034 (Rc 45) 1034 (Rc 45) 14 2
Nitronic 32 (Rb 94) 14 2
4337 (Rc 48) Nitronic 60 (Rb 94) >350 >51
4337 (Rc 51) 4337 (Rc 45) 14 2
Nitronic 60 (Rb 94) >350 >51
201 SS (Rb 94) 201 SS (Rb 94) 105 15
304 SS (Rb 77) 14 2
630 SS [17-4Ph] (Rc 41) 14 2
S24100 (Rc 21) 284 41
Nitronic 32 (Rb 98) 250 36
Waukesha 88 (Rb 77) >350 >51
301 SS (Rb 87) 416 SS (Rc 37) 21 3
440C (Rc 56) 21 3
Nitronic 60 (Rb 94) >350 >51
303 SS (Rb 81) 303 SS (Rb 81) 14 2
304 SS (Rb 77) 14 2
316 SS (Rb 81) 21 3
410 SS (Rc 38) 28 4
416 SS (Rc 37) 60 8
430 SS (Rb 84) 14 2
440C SS (Rc 56) 35 5
630 SS [17-4Ph] (Rc 45) 21 3
Nitronic 32 (Rb 99) >350 >51
Nitronic 60 (Rb 94) >350 >51
303 SS (Rb 85) 303 SS (Rb 85) 138 20
303 SS (Rb 89) Waukesha 88 (Rb 77) >350 >51
304 SS (Rb 77) Silicon Bronze (Rb 94) 300 44
201 SS (Rb 94) 14 2
303 SS(Rb 81) 14 2
(Continued )
Copyright 2004 by Marcel Dekker, Inc. All Rights Reserved.