Bhushan B. Handbook of Micro/Nano Tribology, Second Edition
Подождите немного. Документ загружается.


© 1999 by CRC Press LLC
magnetic film and 20-nm-thick sputtered hydrogenated, DLC film) are compared in Figure 10.49.
Figure 10.49 also includes the friction force profile for a single-crystal silicon substrate for comparison.
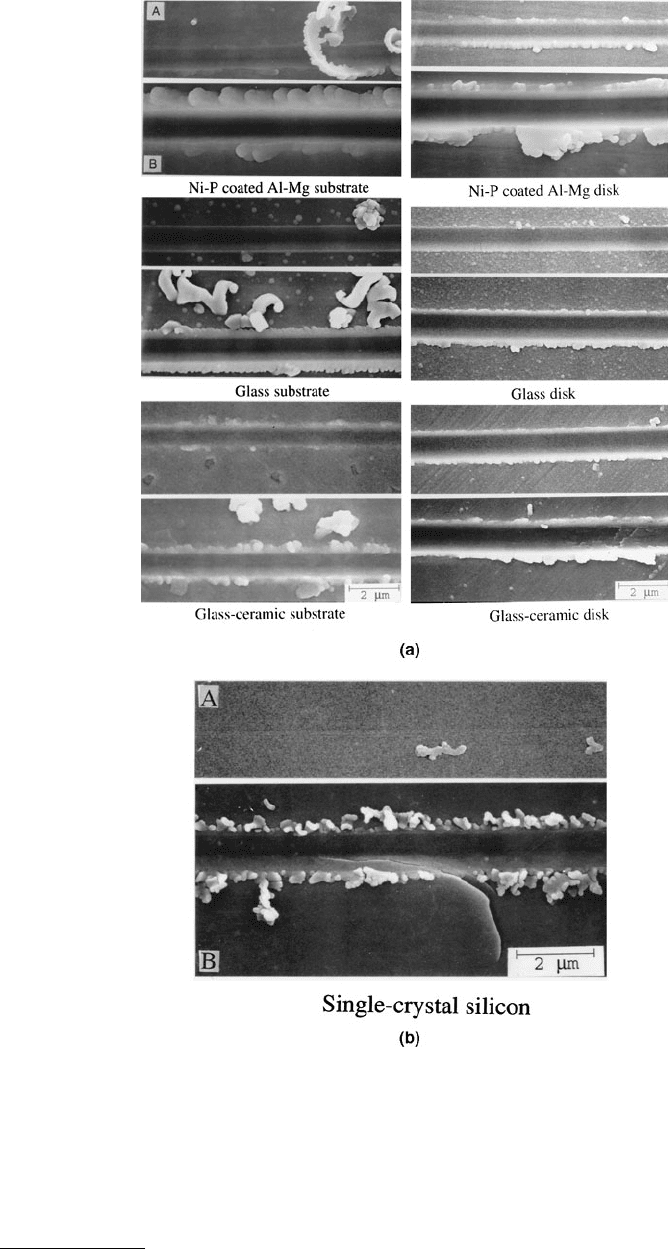
SEM images of two regions of 500-µm-long scratches made at 1 to 12 mN normal load on various samples
are compared in Figure 10.50. The upper images in the sets of two images for each sample correspond
to a region where friction increased abruptly. These are the points indicated by “A” in Figure 10.50. The
lower images in each set correspond to the region that is very close to the end of a scratch. These are the
points indicated by ‘B’ in Figure 10.50. The extent of a damage in a scratch is estimated by the width and
depth of the scratch and by the amount of debris generated toward the end of the scratch.
Single-crystal silicon exhibited the lowest friction with little plowing at a low load and cracking at
higher loads. This observation suggests that scratching of silicon took place primarily by brittle defor-
mation. In the case of the Ni–P-coated Al–Mg substrate, friction increase was continuous from the
beginning of the scratching, Figure 10.49. SEM images of the Ni–P-coated Al–Mg substrate presented in
Figure 10.50, show the material removal occurred by plowing with formation of curly ductile chips. It is
evident that scratching took place primarily by plastic deformation typical of ductile materials. Plowing
is responsible for the continuous increase in the friction for this substrate. Glass and glass–ceramic
substrates and corresponding disks and the Ni–P-coated Al–Mg disk exhibited relatively low friction with
a sudden increase at higher load. The glass substrate exhibited the lowest friction followed by the
glass–ceramic substrate. In the case of the Ni–P-coated Al–Mg disk, the load at which friction increased
was lower than that of the glass and glass–ceramic substrates. SEM images of these samples exhibit
plowing in addition to the formation of fine debris. There is no evidence of cracking of ceramic substrates
or the ceramic overcoats used in all disks at magnifications as high as 50,000¥. Glass is chemically
strengthened in order to produce significant compressive stresses in the glass surface. Glass–ceramic
consists of fine-grained polycrystalline material in a glass matrix. Chemical strengthening and the crystals
add to the fracture toughness of the material. Thus, both ceramic substrate materials are expected to
deform with ductile and brittle deformation modes. Ductile deformation results in plowing, whereas
brittle deformation aids in debris generation. Lower values of the coefficient of friction before a sudden
increase, as compared with Ni–P-coated Al–Mg substrate, suggest that brittle fracture contributes to
overall deformation. Hard overcoats generally consist of significant compressive residual stresses. It is
these compressive stresses that allow ductile deformation with little cracking. We further note that a
sudden increase in the coefficient of friction for ceramic substrates and for all disks at some load results
from significant damage to the bulk material or to the coating surface (Figure 10.50).
Based on the friction data, the width and depth of scratches, the amount of debris generated, and
scratch morphology, glass substrates and corresponding disks exhibit a lower coefficient of friction against
a diamond tip and a superior resistance to scratch, followed by glass–ceramic substrates and correspond-
ing disks.
This example clearly suggests that deformation modes and critical load to failure can be identified
using the scratch technique.
10.6 Nanoindentation and Microscratch Techniques
for Adhesion Measurements, Residual Stresses,
and Materials Characterization of Thin Films
Adhesion describes the sticking together of two materials. Adhesion strength, in a practical sense, is the
stress required to remove a coating from a substrate. Indentation and scratch on the micro- and nanoscales
are the two commonly used techniques to measure adhesion of thin hard films with good adhesion to
the substrate (>70 MPa)(Campbell, 1970; Mittal, 1978; Blau and Lawn, 1986; Bhushan, 1987; Bhushan
and Gupta, 1997). Nearly all coatings, by whatever means they are produced, and surface layers of treated
parts are found to be in a state of residual (intrinsic or internal) stress. These are elastic stresses that exist
in the absence of external forces and are produced through the differential action of plastic flow, thermal
contraction, and/or changes in volume created by phase transformation. Microindentation and nanoin-
© 1999 by CRC Press LLC
FIGURE 10.50 SEM images of two regions on 500-µm-long scratches made at 1 to 12 mN load on (a) various ceramic
substrates and corresponding magnetic disks and (b) single-crystal silicon. The scratching direction was from left to
right. The upper images in the sets of two images for each sample correspond to a location or normal load where the
friction increased abruptly and/or damage began to occur. These are the points indicated by “A” in Figure 10.49. The
lower images correspond to a location close to the end of the scratch (~11 mN). These are the points indicated by “B”
in Figure 10.49. (From Bhushan, B. and Gupta, B.K., 1995, Adv. Info. Storage Syst. 6, 193–208. With permission.)
© 1999 by CRC Press LLC
dentation techniques are also used to measure residual stresses (Bhushan and Gupta, 1997). Microscratch
and nanoscratch techniques (using nanoindenter) are also used to measure scratch resistance of surfaces
of bulk materials (Bhushan and Gupta, 1995; Bhushan et al., 1996). The nanoindenter has also been
modified to conduct microwear studies (Wu and Lee, 1994).
In this section, we describe adhesion measurements, residual stress measurements, and microwear
measurements using nanoindentation and microscratch apparatuses. We also present typical examples.
10.6.1 Adhesion Strength and Durability Measurements
Using Nanoindentation
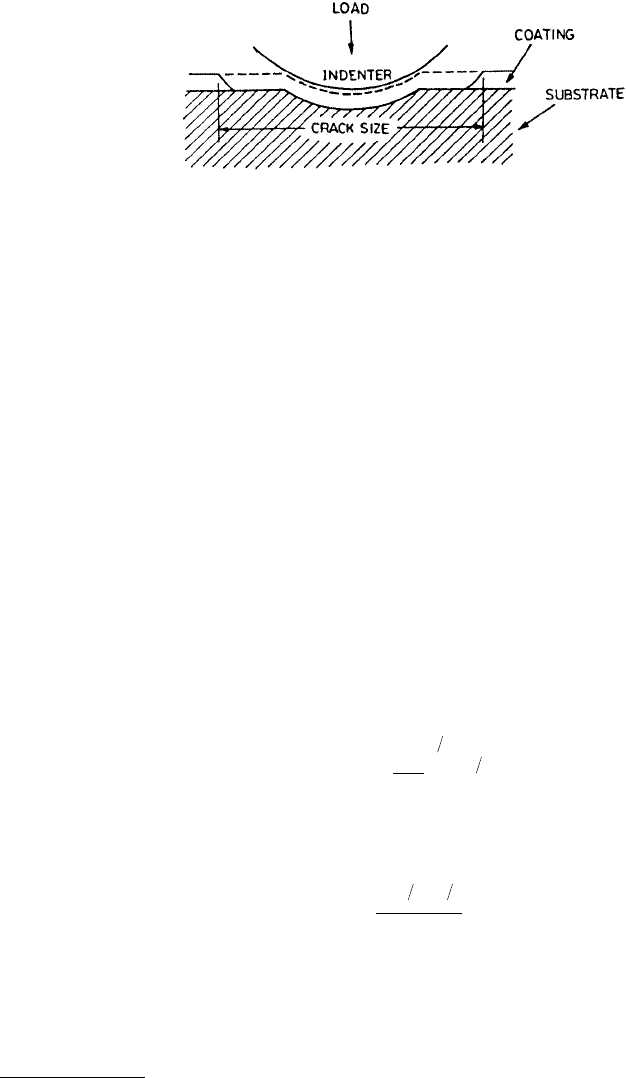
In the indentation test method, the coating sample is indented at various loads. At low loads, the coating
deforms with the substrate. However, if the load is sufficiently high, a lateral crack is initiated and
propagated along the coating–substrate interface. The lateral crack length increases with the indention
load. The minimum load at which the coating fracture is observed is called the critical load and is
employed as the measure of coating adhesion (Figure 10.51). For relatively thick films, the indentation
is generally made using a Brinell hardness tester with a diamond sphere of 20-µm radius (Tangena and
Hurkx, 1986), Rockwell hardness tester with a Rockwell C 120° cone with a tip radius of 200 µm (Mehrotra
and Quinto, 1985) or a Vickers pyramidal indenter (Chiang et al., 1981; Lin et al., 1990; Alba et al., 1993).
However, for extremely thin films, a Berkovich indenter (Stone et al., 1988) or a conical diamond indenter
with a tip radius of 5 mm and 30° of included angle (Tsukamoto et al., 1992) is used in a nanoindenter.
It should be noted that the measured critical load W
cr
is a function of hardness and fracture toughness
in addition to the adhesion of coatings. Chiang et al. (1981) have related the measured crack length
during indentation, the applied load, and the critical load (at which coating fracture is observed) to the
fracture toughness of the substrate–coating interface. A semianalytical relationship derived between the
measured crack length c and the applied load W:
(10.23)
where
a
1
is a numerical constant, t
c
is the coating thickness, H is the mean hardness, and (K
Ic
)
interface
is the
fracture toughness of the substrate–coating interface. Mehrotra and Quinto (1985) used this analysis to
calculate fracture toughness of the interface.
FIGURE 10.51 Schematic illustration of the indentation method for adhesion measurement.
c
W
W
W=−
α 1
12
14
cr
α
α
2
1
32 12
=
()
tH
K
c
cI
interface
,
© 1999 by CRC Press LLC
Marshall and Oliver (1987) estimated adhesion of composites by measuring the magnitude of shear
(friction) stresses at fiber/matrix interfaces in composites. They used a Berkovich indenter to push on
the end of an individual fiber, and measured the resulting displacement of the surface of the fiber below
the matrix surface (due to sliding). The shear stress was calculated from the force–displacement relation
obtained by analysis of the frictional sliding. The force and displacement measurements were obtained
only at the peak of the load cycle, and the sliding analysis was based on sliding at constant shear resistance
at the interface. These experiments provided measurements of average shear stresses at individual fibers.
10.6.2 Adhesion Strength and Durability Measurements
Using Microscratch Technique
Scratching the surface with a fingernail or a knife is probably one of the oldest methods for determining
the adhesion of paints and other coatings. In 1822, Friedrich Mohs used resistance to scratch as a measure
of hardness. Scratch tests to measure adhesion of films was first introduced by Heavens in 1950 (Heavens,
1950). A smoothly round chrome-steel stylus with a tungsten carbide or Rockwell C diamond tip (in the
form of 120° cone with a hemispherical tip of 200-mm radius) (Perry, 1981, 1983; Mehrotra and Quinto,
1985; Valli, 1986; Steinmann et al., 1987) or Vickers pyramidal indenter (Burnett and Rickerby, 1987a;
Bull and Rickerby, 1990) for macro- and microscratching a conical diamond indenter (with 1 or 5 µm
of tip radius and 60° of included angle) for nanoscratching (Wu et al., 1989, 1990b; Wu, 1991) is drawn
across the coating surface. A normal load is applied to the scratch tip and is gradually increased during
scratching until the coating is completely removed. The minimum or critical load at which the coating
is detached or completely removed is used as a measure of adhesion (Benjamin and Weaver, 1960;
Campbell, 1970; Greene et al., 1974; Ahn et al., 1978; Mittal, 1978; Perry, 1981, 1983; Laugier, 1981;
Jacobson et al., 1983; Mehrotra and Quinto, 1985; Je et al., 1986; Valli, 1986; Burnett and Rickerby, 1987a;
Steinmann et al., 1987; Sekler et al., 1988; Wu et al., 1989, 1990b; Wu, 1990, 1991; Bull and Rickerby,
1990; Cheng et al., 1990; Julia-Schmutz and Hintermann, 1991; White et al., 1993; Bhushan et al., 1995,
1998; Gupta and Bhushan, 1995a,b; Patton and Bhushan, 1996; Bhushan and Patton, 1996; Bhushan and
Li, 1997; Li and Bhushan, 1998b,c). It is a most commonly used technique to measure adhesion of hard
coatings with strong interfacial adhesion (>70 MPa).
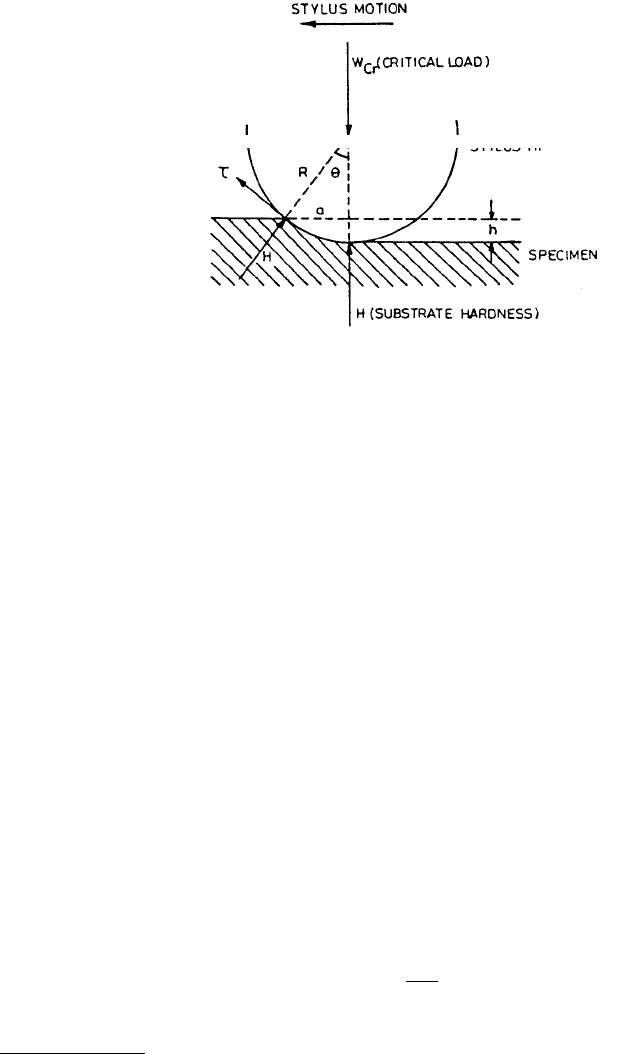
For a scratch geometry shown in Figure 10.52, surface hardness H is given by
(10.24)
FIGURE 10.52 Geometry of the scratch.
H
W
a
=
π
cr
2

© 1999 by CRC Press LLC
and adhesion strength t is given by (Benjamin and Weaver, 1960)
(10.25a)
or
(10.25b)
where W
cr
is the critical normal load, a is the contact radius, and R is the stylus radius.
Burnett and Rickerby (1987a) and Bull and Rickerby (1990) analyzed the scratch test of a coated
sample in terms of three contributions: (1) a plowing contribution which will depend on the indentation
stress field and the effective flow stress in the surface region, (2) an adhesive friction contribution due
to interactions at the indenter–sample interface, and (3) an internal stress contribution since any internal
stress will oppose the passage of the indenter through the surface, thereby effectively modifying the
surface flow stress. They derived a relationship between the critical normal load W
cr
and the work of
adhesion W
ad
(10.26)
where E is the Young’s modulus of elasticity and t is the coating thickness. Plotting of W
cr
as a function
of a
2
/t
1/2
should give a straight line of the slope π(2EW
ad
/t)
1/2
/2 from which W
ad
can be calculated. Bull
and Rickerby suggested that either the line slope (interface toughness) or W
ad
could be used as a measure
of adhesion.
An accurate determination of critical load W
cr
sometimes is difficult. Several techniques, such as (1)
microscopic observation (optical or SEM) during the test, (2) chemical analysis of the bottom of the
scratch channel (with electron microprobes), and (3) acoustic emission, have been used to obtain the
critical load (Perry, 1981, 1983; Je et al., 1986; Valli, 1986; Steinmann et al., 1987; Sekler et al., 1988; Wu
et al., 1990b; Wu, 1991). In some instruments, tangential (or friction) force is measured during scratching
to obtain the critical load (Jacobson et al., 1983; Valli, 1986; Wu et al., 1990b; Wu, 1990, 1991; Anonymous,
1991; Bhushan et al., 1995, 1997; Gupta and Bhushan, 1995a,b; Patton and Bhushan, 1996; Bhushan and
Patton, 1996; Bhushan and Li, 1997; Li et al., 1998b,c). The AE and friction force techniques have been
reported to be very sensitive in determining critical load. AE and friction force start to increase as soon
as cracks begin to form perpendicular to the direction of the moving stylus.
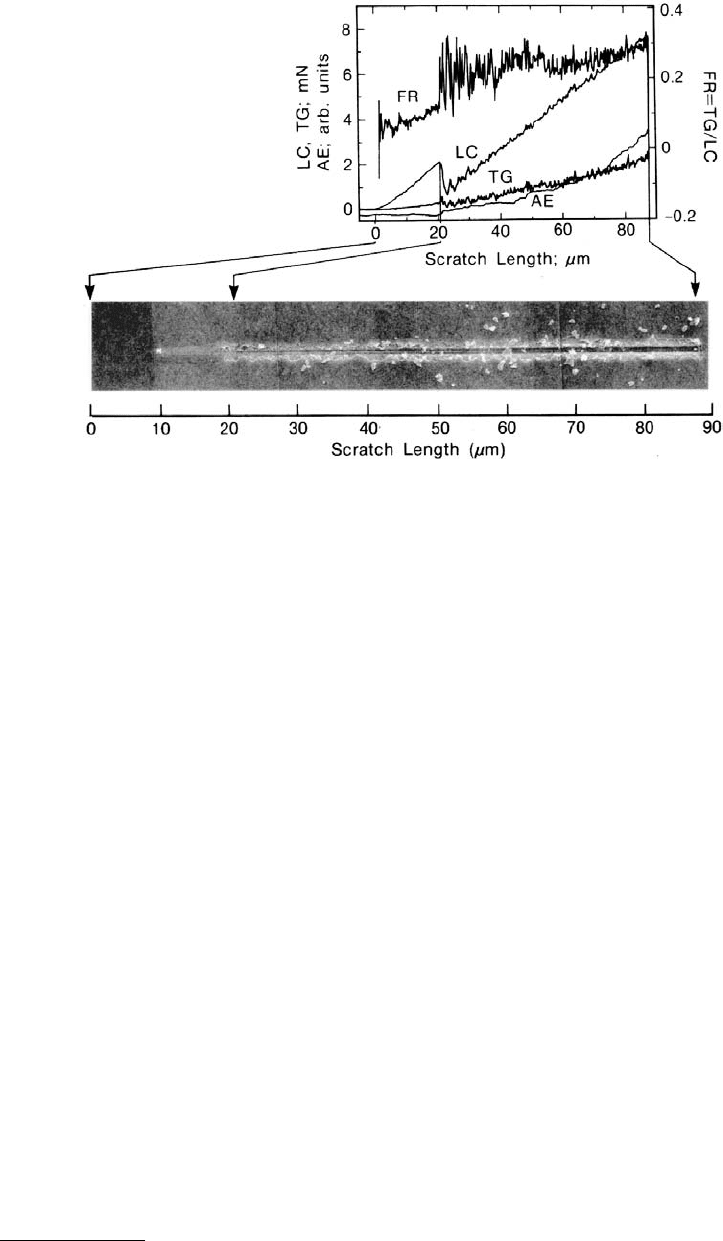
Wu (1991) has used the scratch technique to study the adhesion and scratch resistance of diamondlike
carbon and zirconia coatings deposited on Si(100) substrates. Figure 10.53 shows the scratch morphology
at increasing normal loads and typical scratch data (normal load, tangential load and acoustic emission
as well as calculated apparent coefficient of friction). We note that all three monitored outputs (LC, TG
and AE) detected the first spallation event of the carbon coating by showing sudden changes in their
output signals.
Bhushan et al. (1995, 1997), Bhushan and Li (1997), Gupta and Bhushan (1995a,b), Patton and
Bhushan (1996), and Li and Bhushan (1998b,c) have used the scratch technique to study adhesion and
scratch resistance (mechanical durability) of various ceramic films. Scratch tests conducted with a sharp
diamond tip simulate a sharp asperity contact. Bhushan et al. have also conducted accelerated friction
τθ=
=
π
−
()
H
W
a
a
Ra
tan
cr
2
22
12
τ=
π
W
aR
Ra
cr
if
W
a
EW
t
cr
ad
=
π
2
12
2
2
© 1999 by CRC Press LLC
and wear (ball-on-coated disk) and functional tests and have found a good correlation between the
scratch resistance and wear resistance measured using accelerated tests (Bhushan et al., 1995a, 1997;
Gupta and Bhushan, 1995b; Patton and Bhushan, 1996; Bhushan and Patton, 1996; Bhushan and Li,
1997; Li and Bhushan, 1998b,c) and functional tests (Patton and Bhushan, 1996; Bhushan and Patton,
1996; Bhushan et al., 1997). Based on this work, scratch tests can be successfully used to screen materials
and coatings for wear applications.
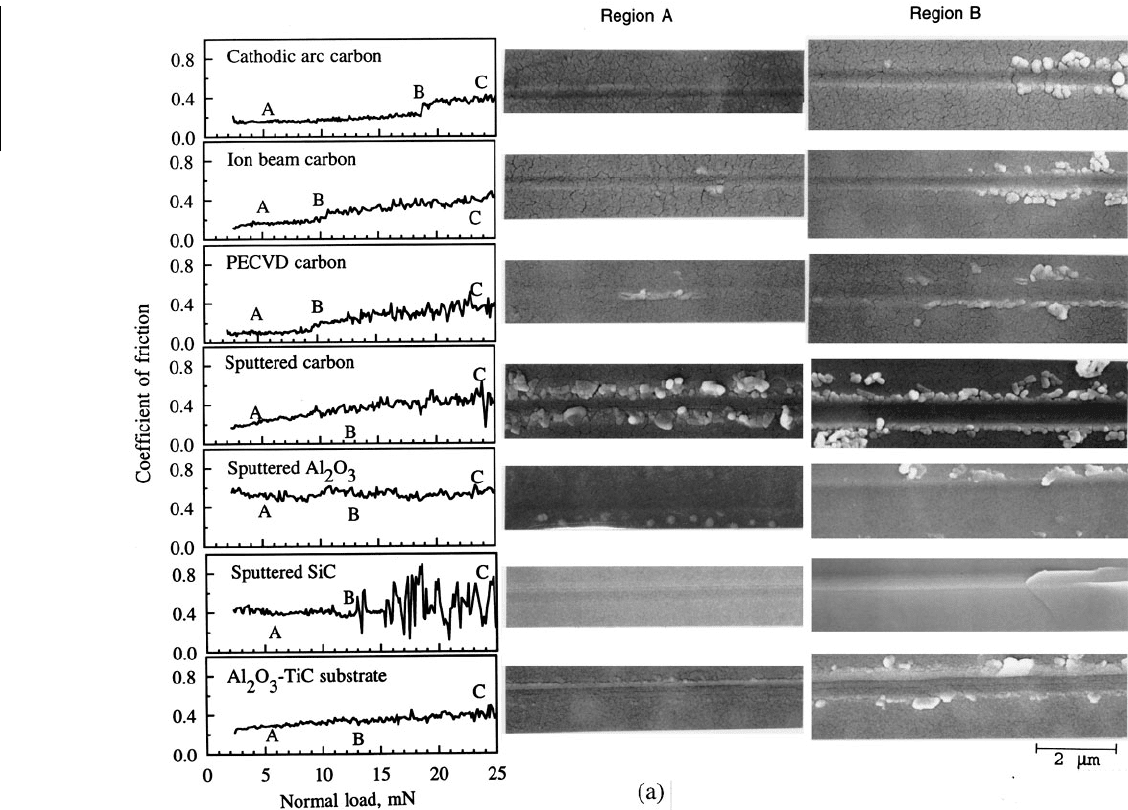
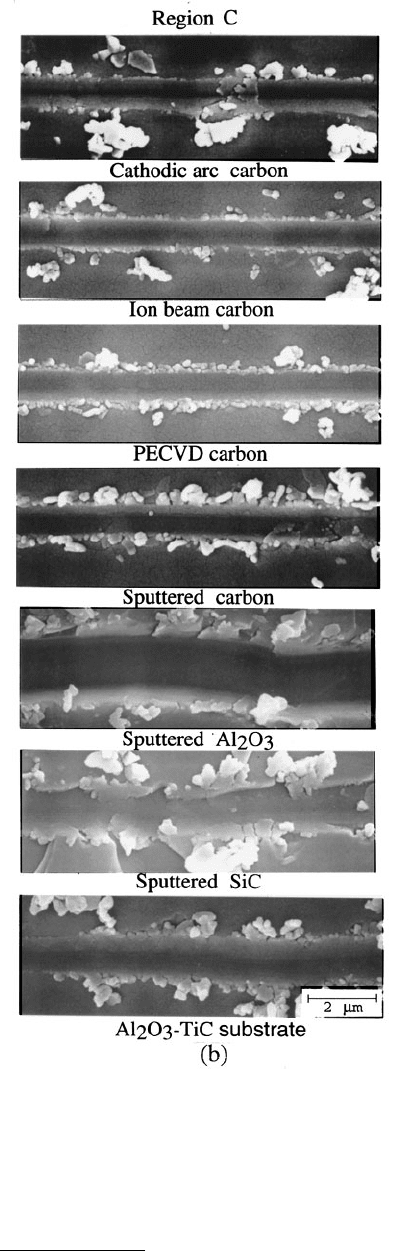
Gupta and Bhushan (1995b) conducted scratch tests on 20-nm-thick DLC films deposited by several
deposition techniques and sputtered Al
2
O
3
and sputtered SiC films on Al
2
O
3
–TiC (70–30 wt%) substrate.
Films were scratched using a 1-µm-radius conical tip at ramping loads ranging from 2 to 25 mN with a
scratch length of 500 µm. The friction profiles as a function of increasing normal load and SEM images
of three regions over scratches — at the beginning of the scratch (indicated by A on friction profile), at
the point of initiation of damage at which coefficient of friction increases abruptly to a very high value
(indicated by B on friction profile), and toward the end of scratch (indicated by C on friction profile) —
made on various carbon, ion beam-sputtered Al
2
O
3
, and DC-sputtered SiC films on Al
2
O
3
–TiC substrates
and uncoated substrate are compared in Figure 10.54. The cathodic arc carbon film exhibits a low
coefficient of friction of about 0.20 during scratch and a critical load of about 19 mN. All films except
cathodic arc carbon on Al
2
O
3
–TiC substrates exhibit a continuous increase in the coefficient of friction
during scratching and were damaged at much lower normal loads. Cathodic arc carbon film exhibited
scratches with a width of about 0.9 µm (at about 22 to 25 mN normal load) comparable to that of ion
beam carbon and sputtered carbon coating but lower than that PECVD carbon coating. A qualitative
comparison of the amount of debris generated during scratching reveals that minimum debris was formed
in the case of cathodic arc carbon coating, Table 10.6. These observations suggest that cathodic arc carbon
coating on Al
2
O
3
–TiC substrate has a superior scratch resistance compared with other coatings. The RF-
sputtered SiC coating on Al
2
O
3
–TiC exhibited lower scratch resistance than that of cathodic arc carbon
coating on Al
2
O
3
–TiC and higher scratch resistance than that of all other carbon coatings, Table 10.6.
FIGURE 10.53 Scratch morphology and typical scratch data of 0.11-µm-thick DC-sputtered DLC film on an Si
substrate. The monitored outputs are the normal load (LC), tangential load (TG), acoustic emission (AE). The
apparent coefficient of friction (FR = TG/LC) is also shown. (From Wu, T.W. et al., 1990, in Symp. Proc., Vol. 188,
pp. 207–212, Materials Research Society, Pittsburgh. With permission.)

© 1999 by CRC Press LLC
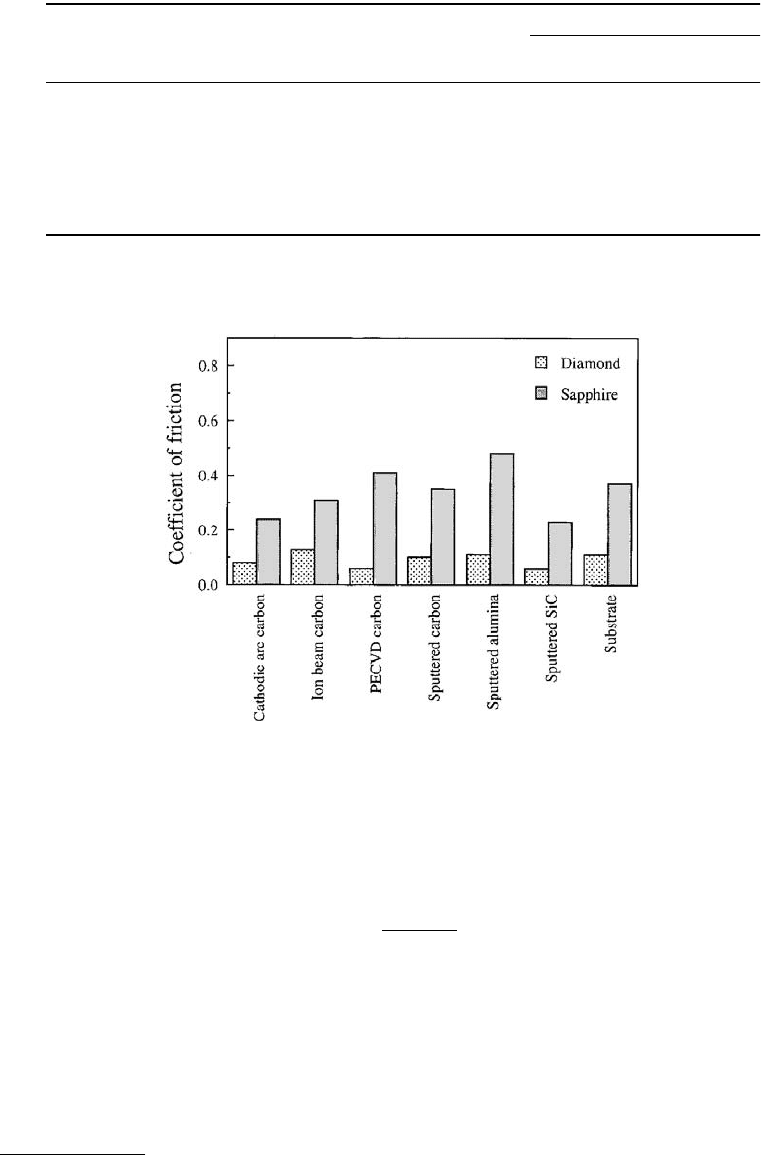
Accelerated friction tests were conducted by sliding a diamond tip (20-µm radius) and a single-crystal
sapphire ball (3-mm diameter) against the films. The data are compared in Figure 10.55. We note that
the coefficients of friction of all of the coatings are low (≈0.06 to 0.13) when these were slid against a
diamond tip, whereas these coatings exhibited higher coefficients of friction from 0.20 to 0.50 when slid
against a sapphire ball. SiC coating exhibited the lowest coefficients of friction among other coatings,
when it was slid against a sapphire ball. Based on optical examination of worn samples, there were no
wear tracks formed when cathodic arc carbon, ion beam carbon, PECVD carbon, and SiC coatings were
slid for 2 h against a diamond tip at 10 mN load. Sputtered carbon and sputtered Al
2
O
3
coatings exhibited
a small amount of wear debris, because of their lower scratch resistance. On the other hand, for the
coatings slid for 2 h against a sapphire ball, the cathodic arc carbon and SiC coatings on Al
2
O
3
–TiC
substrate did not form any wear track, Figure 10.56. The higher wear performances of cathodic arc carbon,
ion beam carbon, and SiC coatings are attributed to their high resistance to scratch and high hardnesses
and elastic moduli.
Magnetic thin-film head sliders made with Al
2
O
3
–TiC substrate are used in magnetic storage applica-
tions (Bhushan, 1996). Multilayered thin-film pole-tip structure present on the head slider surface wears
more rapidly than the Al
2
O
3
–TiC substrate, which is much harder. Pole-tip recession (PTR) is a serious
concern in magnetic storage. Two of the DLC coatings superior in mechanical properties — ion beam
and cathodic arc carbon — were deposited on the air bearing surfaces of Al
2
O
3
–TiC head sliders. The
functional tests were conducted by running a metal-particle (MP) tape in a computer tape drive. Average
PTRs as a function of sliding distance data are presented in Figure 10.57. We note that PTR increases for
the uncoated head, whereas for the coated heads there is a slight increase in PTR in early sliding followed
by little change. Thus, coatings provide protection.
This example clearly suggests that material characterizations (hardness, elastic modulus, and scratch
resistance) are powerful ways of screening materials and the data correlates well with the functional
friction and wear performance.
10.6.3 Residual Stress Measurements Using Nanoindentation
Indentation measurements similar to those used to determine the hardness and elastic modulus of a film
can also be used to measure the residual stresses in it. When a compressive force on a biaxially stressed
film during indentation is applied in a direction perpendicular to the film, yielding will occur at a smaller
applied compressive force while a film is stressed in biaxial tension as compared with the unstressed film.
Thus, the biaxial tension decreases hardness and the biaxial compression increases hardness (Swain et al.,
1977; Vitovec, 1986). LaFontaine et al. (1990c, 1991) used the nanoindentation technique to measure the
effect of residual stresses on the hardness of thin films. For samples that do not undergo large structural
changes, changes in hardness with time reflect a change in residual stress in the film (LaFontaine et al.,
1990c, 1991). LaFontaine et al. (1991) measured the stress relaxation in thin aluminum films and the
residual stresses on identical films using an X-ray stress measurement technique. Results of the indenta-
tion and X-ray stress measurements compared closely, implying that decrease in hardness with time
resulted from the relaxation of residual stresses. Thus, the indentation measurements can be used to
investigate stresses in thin films. Due to the presence of a stress gradient in thicker (>1 µm) films, the
technique is not applicable.
Tsukamoto et al. (1987) measured the deflection at the center of the bent beam (bent as a result of
residual stresses in the film) by pressing the beam flat with a nanoindenter. The bent beam is placed on
a flat glass surface supported by two fulcrums, and a load–deflection curve is generated (Figure 10.58).
The distance h
a
can be estimated from the inflection point in the curve. Because of limited flatness of
most substrates, the film is removed from the substrate, and then the initial deflection is measured. The
true deflection resulting from residual stresses in the film equal to h
a
– h
b
. The curvature (1/R) of the
substrate can then be calculated by the geometric relationship,
© 1999 by CRC Press LLC
© 1999 by CRC Press LLC
FIGURE 10.54 (a) Coefficient of friction profiles as
a function of normal load and SEM images of three
regions over scratches; at the beginning of the scratch
(indicated by A on friction profile), at the point of
initiation of damage at which coefficient of friction
increases abruptly to a very high value (indicated by
B on friction profile) and (b) toward the end of
scratch (indicated by C on friction profile), made on
various DLC, Al
2
O
3
, and SiC films on Al
2
O
3
–TiC sub-
strates and uncoated Al
2
O
3
–TiC substrate. (From
Gupta, B.K. and Bhushan, B., 1995, Wear 190,
110–122. With permission.)
© 1999 by CRC Press LLC
(10.27)
where L is the span.
Hong et al. (1990) used another deflection measurement technique. In this technique, a circular section
of the substrate is removed from beneath the film to produce a drum-headlike membrane and the load
is applied at its center. The stiffness of the membrane (film) is a sensitive function of the biaxial tension
in it. The deflection h is related to load W as
TABLE 10.6 Coefficient of Friction (at the beginning), Critical Load Estimated from an Abrupt Increase
in Friction during Scratching, and Width of Scratches at about 23–25 mN Normal Load, Measured
from SEM Images, and Qualitative Comparison of the Amount of Debris Generated during Scratching
for Various 20-nm-Thick Coatings on Al
2
O
3
–TiC Substrates
Coating Critical Load (mN)
Coefficient
of Friction
during Scratching
SEM Observations of Scratches
Width of
Scratch (µm)
Amount of
Debris Generated
b
Cathodic arc carbon 19.0 0.20 0.9 Low
Ion beam carbon 10.5 0.15 0.9 Medium
PECVD carbon 9.0 0.13 1.0 Medium
DC-sputtered carbon 6.0–9.0 0.20 0.9 Medium
Ion beam–sputtered Al
2
O
3
Plowing
a
0.55 1.6 Very large
RF-sputtered SiC 12.5 0.40 1.1 Medium
Al
2
O
3
–TiC substrate 7.0 0.30 1.5 Large
a
Tip plowed into the coating right at the beginning.
b
A qualitative comparison of debris generated toward the end of the scratch after catastrophic damage.
FIGURE 10.55 Initial coefficient of friction of various DLC, ion beam–sputtered Al
2
O
3
, and RF-sputtered SiC films
deposited on Al
2
O
3
–TiC substrates and the substrate, against a diamond tip (tip radius = 20 µm) and a single-crystal
sapphire ball (diameter = 3 mm) at a 10 mN normal load, 3.5 mm stroke length, 0.1 Hz frequency, 0.7 mm s
–1
average
linear speed, and under ambient temperature of 22 ± 1°C and humidity of 45 ± 5% RH. (From Gupta, B.K. and
Bhushan, B., 1995, Wear 190, 110–122. With permission.)
R
L
hh
ab
=
−
()
2
8