Bhushan B. Handbook of Micro/Nano Tribology, Second Edition
Подождите немного. Документ загружается.

© 1999 by CRC Press LLC
where h is the vertical deflection, W is the force applied, l is the effective length, n is Poisson’s ratio, b
is the width, t is the thickness, and E is the Young’s modulus of the beam. As mentioned previously, the
nanoindenter records the load required to displace its own spring and the microbeam. Consequently,
the load required by the springs of the nanoindenter must be substrated from the total applied load to
determine the load on the beam. For good accuracy, the spring constant of the microbeam must be
approximately equal to or greater than 10% of the spring constant of the nanoindenter.
The application of simple beam theory to the load deflection data of beams also enable one to determine
the yield strength of the microbeam material. For a homogeneous cantilever beam under load, the strain
in the beam varies linearly through the thickness such that the maximum strain at a given length occurs
at the top and at the bottom of the beam. For the loading shown in Figure 10.30, the top of the beam is
in tension and the bottom of the beam is in compression. In addition, the maximum stress in the beam
is located at the fixed end of the beam (B) where the applied moment is greatest. When this maximum
stress reaches the yield strength of the material, the beam begins to deform plastically. The onset of such
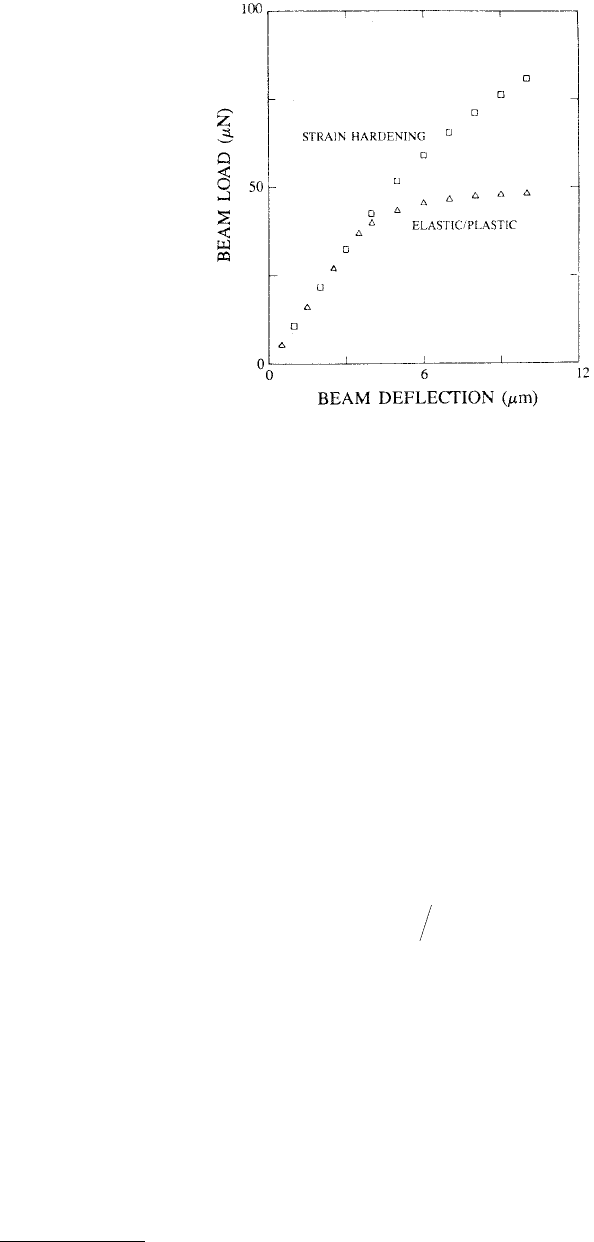
deformation can be recognized in the plot of load vs. deflection by a deviation from linearity, Figure 10.31.
The load that marks this deviation is defined as the yield load W
y
, and the yield strength is given by
(10.18)
Following yielding, the beam continues to bend as more load is applied, and some of the strain in the
beam is plastic and thus unrecoverable during unloading. The shape of the load vs. deflection curves
after yielding and prior to unloading depends on the elastic and plastic properties of the material.
10.3.7 Determination of Hardness and Modulus of Elasticity of Thin
Films from the Composite Response of Film and Substrate
As mentioned previously, for a thin film on a substrate, if the indentation exceeds about 30% of the film
thickness, measured hardness is affected by the substrate properties. A number of researchers have
FIGURE 10.31 Theoretical load–deflection curves for cantilever beam deflections. The lower and upper curves
represent an elastic–plastic material and a material that strain hardens, respectively. (From Weihs, T.P. et al., 1988,
J. Mater. Res. 3, 931–942. With permission.)
σ
yy
Wbt=
()
6
2
l

© 1999 by CRC Press LLC
attempted to derive expressions that relate thin-film hardness to substrate hardness, composite hardness
(measured on the coated substrate) and film thickness, and so allow the calculations of these quantities
given the remaining three (Buckle et al., 1973; Jonsson and Hogmark, 1984; Sargent, 1986; Burnett and
Rickerby, 1987b; Bhattacharya and Nix, 1988a,b; Bull and Rickerby, 1990). Here we discuss two models
based on the volume law of mixtures (volume fraction model) and finite-element simulation.
Sargent (1986) suggested that the hardness of a film/substrate composite is determined by a weighted
average of the volume of plastically deformed material in the film (V
f
) and that in the substrate (V
s
),
(10.19)
where V = V
f
+ V
s
. The deformed volumes of film and substrate can be calculated using the expanding
spherical cavity model (Johnson, 1985). Burnett and Rickerby (1987b) found it necessary to incorporate
a further weighting factor to deforming volume to obtain a reasonable fit to experimental data. This
factor accounts for the differences in relative sizes of the plastic zones in the film and substrate.
Equation 10.19 is modified as for a soft film on the hard substrate,
(10.20a)
and for the hard film on the soft substrate,
(10.20b)
where X is the ratio of plastic zone volumes given as
(10.20c)
They found that n, determined empirically, ranged from ½ to ⅓.
Bhattacharya and Nix (1988a) modeled the indentation process using the finite-element method to
study the elastic–plastic response of materials. Bhattacharya and Nix (1988b) calculated elastic and plastic
deformation associated with submicron indentation by a conical indenter of thin films on substrates,
using the finite-element method. The effects of the elastic and plastic properties of both the film and
substrate on the hardness of the film/substrate composite were studied by determining the average
pressure under the indenter as a function of the indentation depth. They developed empirical equations
for film/substrate combinations for which the substrate is either harder or softer than the film. For the
case of a soft film on a harder substrate, the effect of substrate on film hardness can be described as
(10.21a)
where E
f
and E
s
are the Young’s moduli, s
f
and s
s
are the yield strengths, and H
f
and H
s
are the hardnesses
of the film and substrate, respectively. H is the hardness of the composite, h
c
is the contact indentation
depth, and t
f
is the film thickness. Similarly, for the case of a hard film on a softer substrate, the hardness
can be expressed as
HH
V
V
H
V
V
f
f
s
s
=+
HHX
V
V
H
V
V
f
f
s
s
=+
3
HH
V
V
HX
V
V
s
f
s
s
=+
3
X
EH
HE
fs
fs
n
=
H
H
H
H
EE
ht
s
f
s
fs
fs
cf
=+ −
−
()
()
()
11
2
exp
σσ

© 1999 by CRC Press LLC
(10.21b)
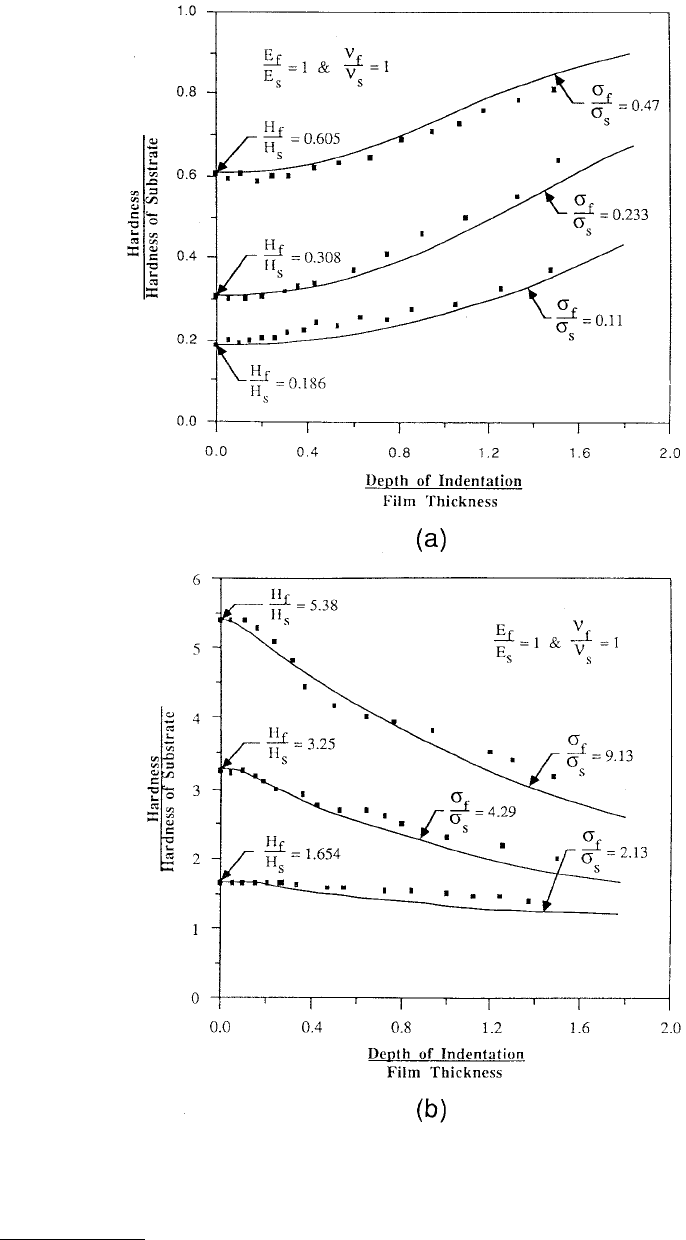
Composite hardness results were found to depend only very weakly on Poisson’s ratio (n), and for
this reason, this factor was not considered in the analysis. In Figure 10.32, they show the composite
hardness results as a function of (h
c
/t
f
) for cases in which the film and substrate have different yield
strengths. We note that hardness is independent of the substrate for indentation depths less than about
0.3 of the film thickness, after which the hardness slowly increases/decreases because of the presence of
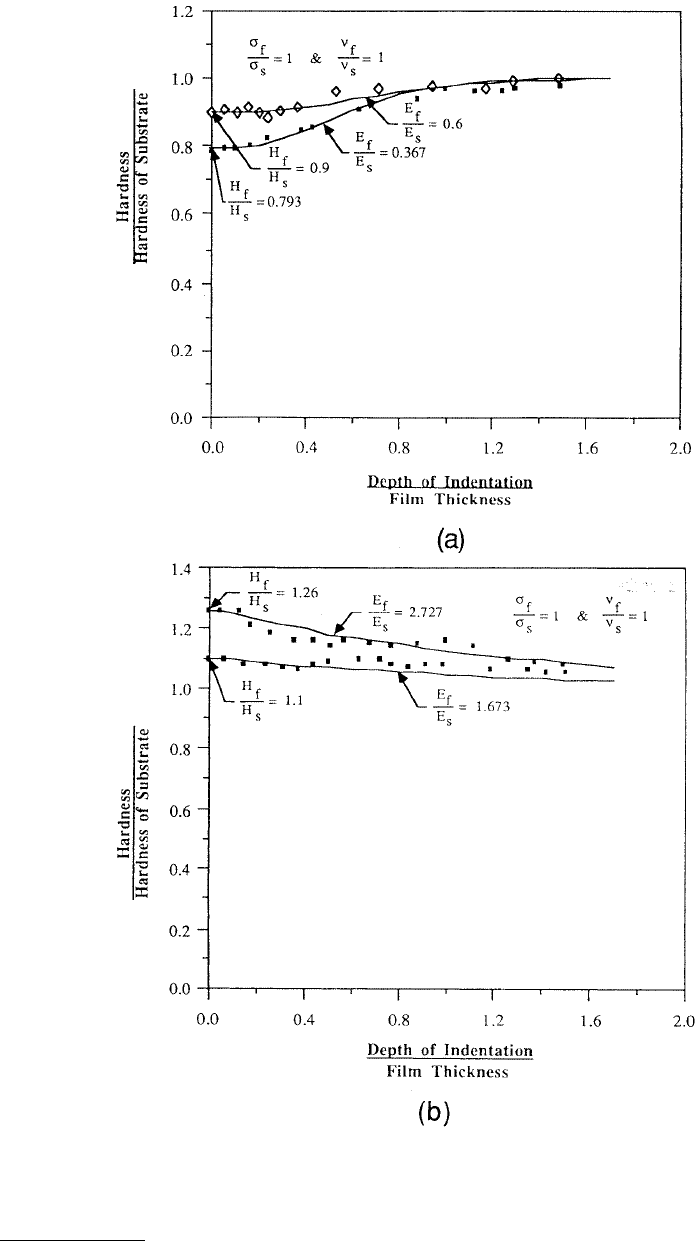
the substrate. In Figure 10.33, they show the composite hardness results for cases in which the film and
substrate have different Young’s moduli. It is observed that the variation of hardness with depth of
indentation in these cases is qualitatively similar to cases in which the film and substrate have different
yield strengths, although the hardness changes more gradually than in the previous cases. Burnett and
Rickerby (1987c) and Fabes et al. (1992) have applied Equations 10.19 through 10.21 to calculate the
film hardness from the measured data for various films and substrates.
Doerner and Nix (1986) empirically modeled the influence of the substrate on the elastic measurement
of very thin film in an indentation test using the following expression for the compliance:
(10.22)
where the subscripts f, s, and i refer to the film, substrate, and indenter, respectively. The term is
equal to (24.5)
1/2
h
c
for the Vickers or Berkovich indenter. The film thickness is t
f
, and b is the y-intercept
for the compliance vs. 1/depth plot, obtained for the bulk substrate, which can be neglected in most
cases. The weighing factors [1 – exp(at
f
/ ] and exp(–at
f
/ ) have been added to account for the
changing contributions of the substrate and film to the compliance. The factor a can be determined
empirically.
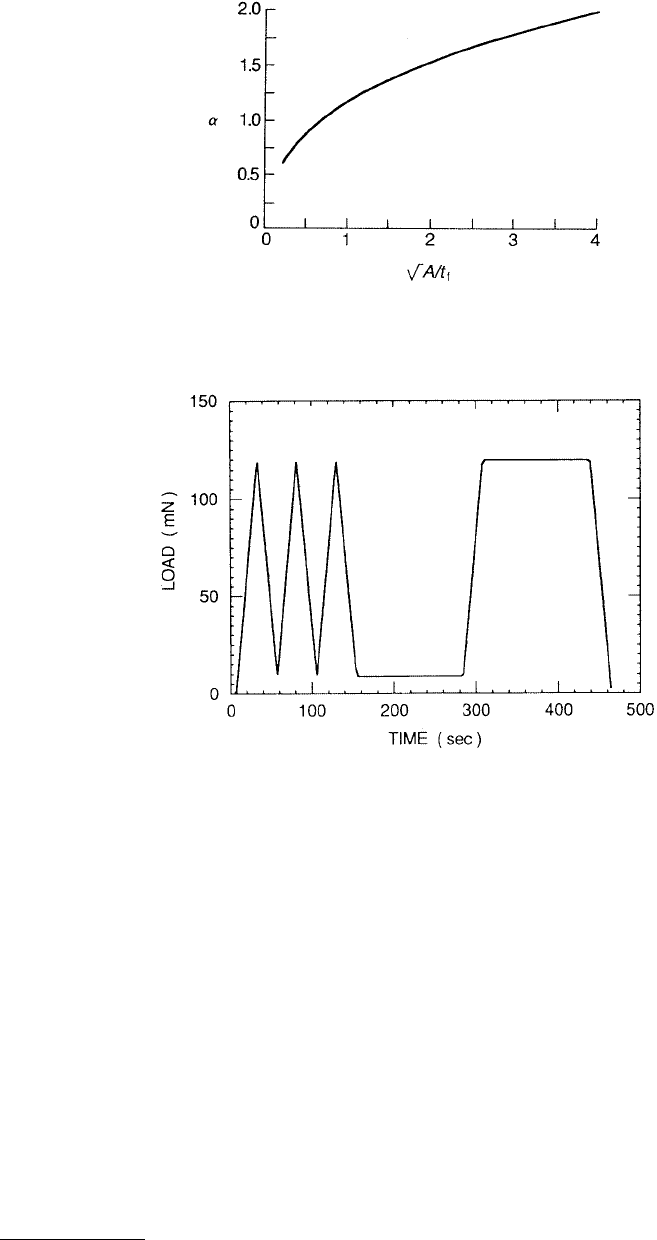
King’s analysis (1987) verified that Equation 10.22 is an excellent functional form for describing the
influence of the substrate and theoretically determined the values of a for various indenter shapes. The
value of a was found to depend on the indenter shape and size and film thickness and was found to be
independent of E
i
/E
s
. The values of a as a function of /t
f
for Berkovich (triangular) indenters are
shown in Figure 10.34. The values of a are found to be similar for square and triangular indenters.
Bhattacharya and Nix (1988b) analyzed the deformations of a layered medium in contact with a conical
indenter using the finite-element method. Their analysis also verified the relationship given in
Equation 10.22.
10.4 Examples of Measured Mechanical Properties
of Engineering Materials
To illustrate the usage of nanoindentation techniques, we present typical data obtained on various
materials, coatings, and surface treatments.
10.4.1 Load — Displacement Curves
A variety of mechanical phenomena, such as transition from elastic to plastic deformation, creep defor-
mation, formation of subsurface cracks, and crystallographic phase transition, can be studied by the
load–displacement curves obtained at different loading conditions (Pethica et al., 1983; Doerner and Nix,
1986; Stone et al., 1988; LaFontaine et al., 1990c, 1991; Pharr et al., 1990; Page et al., 1992; Oliver and
H
H
H
H
HH
EE
ht
s
f
s
fs
fsfs
cf
=+ −
−
()
()()
()
11
12
exp
σσ
C
dh
dW A E
t
A
E
t
A
E
b
f
f
f
s
s
f
i
i
==
π
−
−
−
+
−
−
+
−
+
1
2
1
1
11
12
2
22
να
ν
α
ν
exp exp
A
A A
A
© 1999 by CRC Press LLC
FIGURE 10.32 Effect of relative yield strengths of the film and the substrate on the composite hardness for (a) a
soft film on a hard substrate and (b) a hard film on a soft substrate. (From Bhattacharya, A.K. and Nix, W.D., 1988,
Int. J. Solids Struct. 24, 1287–1298. With permission.)
© 1999 by CRC Press LLC
FIGURE 10.33 Effect of relative Young’s moduli of the film and the substrate on the composite hardness for (a) a
soft film on a hard substrate and (b) a hard film on a soft substrate. (From Bhattacharya, A.K. and Nix, W.D., 1988,
Int. J. Solids Struct. 24, 1287–1298. With permission.)
© 1999 by CRC Press LLC
Pharr, 1992; Pharr, 1992; Whitehead and Page, 1992; Gupta et al., 1993, 1994; Gupta and Bhushan, 1994,
1995a,b; Bhushan et al., 1995, 1996, 1997; Bhushan and Gupta, 1995; Patton and Bhushan, 1996; Bhushan
and Li, 1997; Li and Bhushan, 1998b, c). The load–time sequence used by Oliver and Pharr (1992) for
study of various materials included three loading–unloading cycles, hold for 100 s at 10% of the peak
load, reload, hold for 100 s, and unload, Figure 10.35. Load–displacement curves for mechanically
polished single-crystal aluminum, electropolished single-crystal tungsten, soda lime glass, fused silica
and (110) single-crystal silicon are shown in Figures 10.36 through 10.40. Silicon included only two
loading–unloading cycles (Figure 10.40). The softest material is aluminum, with peak depth of almost
5000 nm at 120 mN load, while the hardest is silicon which was penetrated to a depth of only about
800 nm. Both the aluminum and tungsten data are typical of materials in which the hardness is relatively
small compared to the modulus, as is observed in most metals; most of the indenter displacement in
these metals is accommodated plastically and only a small portion is recovered on unloading. Soda lime
glass, fused silica, and silicon are harder which show larger elastic recovery during unloading, the largest
being that for fused silica.
The unloading/reloading behaviors of the various materials are different. For aluminum, the expanded
view in Figure 10.36b shows that the peak load displacements shift to higher values in successive
FIGURE 10.34 Parameter a as a function of normalized indenter size for a Berkovich indenter indenting a layered
solid surface. (From King, R.B., 1987, Int. J. Solids Struct. 23, 1657–1664. With permission.)
FIGURE 10.35 A typical load–time sequence; peak load = 120 mN. (From Oliver, W.C. and Pharr, G.M., 1992,
J. Mater. Res. 7, 1564–1583. With permission.)
© 1999 by CRC Press LLC
loading/unloading cycles. In addition, the relatively large displacement just prior to final unloading is
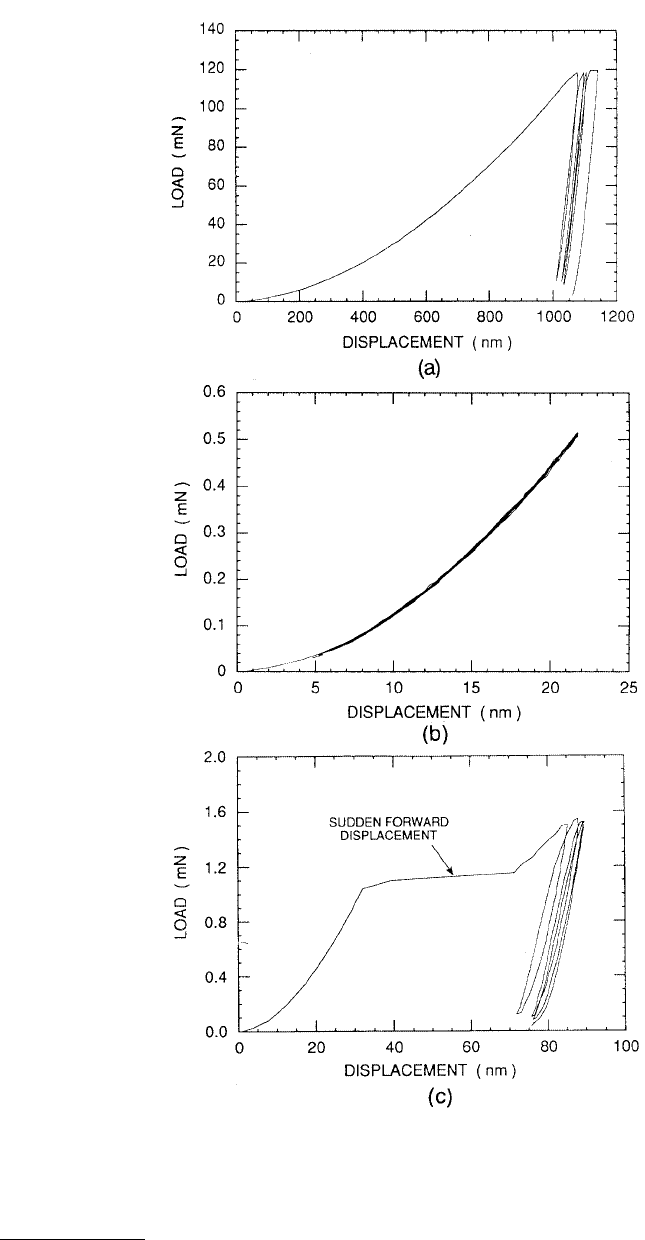
due to creep during the 100-s hold period at peak load. At 120 mN, the indentation depth in tungsten
is about one fourth of that in aluminum, Figure 10.37a. However, the behavior of tungsten is similar to
that of aluminum. Indentation at a very low load of 0.5 mN caused only elastic displacements,
Figure 10.37b. At higher peak loads, the indentation is not just elastic, Figure 10.37c. When a threshold
load of about 1 mN is reached, a sudden jump in displacement corresponding to the onset of plasticity
is observed, and a permanent hardness impression is formed. Soda lime glass (Figure 10.38) and tungsten
at low loads (Figure 10.37c) exhibit distinct hysteresis loops, as might be expected if there were a small
amount of reverse plasticity upon loading. However, the looping degenerates with cycling after three or
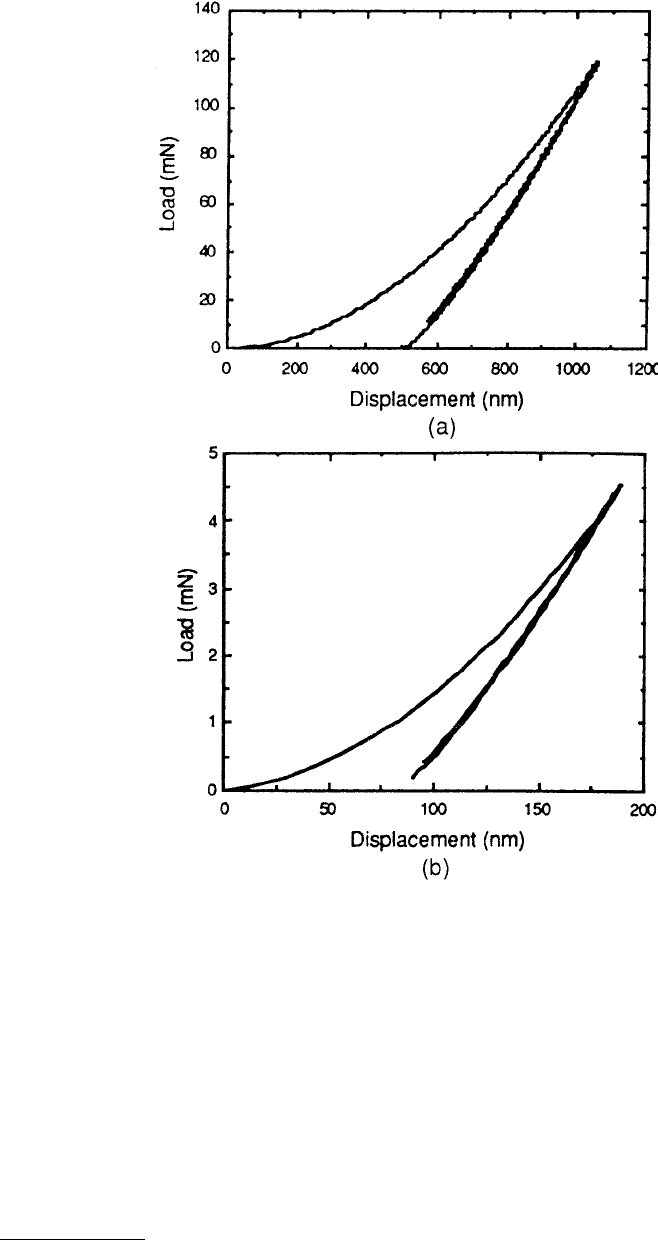
four cycles, the load–displacement behavior is largely elastic. The unloading/reloading curves for fused
silica are nearly the same, Figure 10.39. The near-perfect reversibility suggests that at peak loads of 120
and 4.5 mN, deformation after initial unloading is almost entirely elastic.
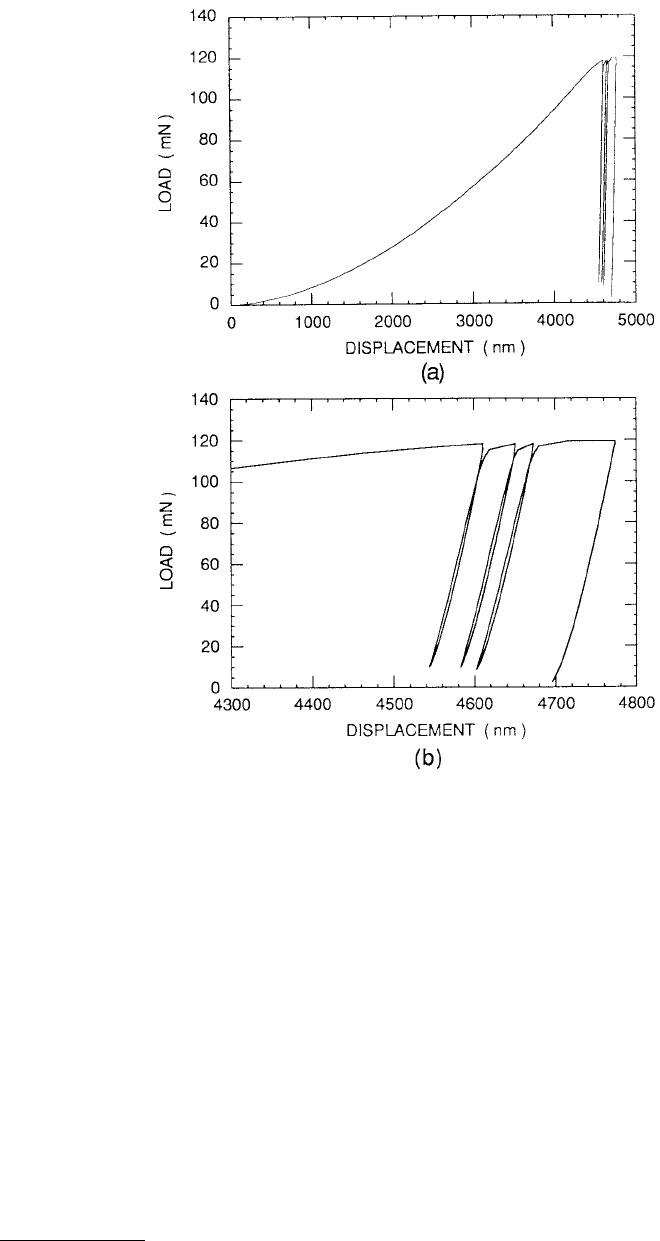
The behavior of silicon shown in Figure 10.40, is in sharp contrast to other materials (e.g., fused silica
data shown in Figure 10.39) (Pharr et al., 1989, 1990; Page et al., 1992; Pharr, 1992). The data presented
FIGURE 10.36 (a) Load vs. displacement plot for an mechanically polished single-crystal aluminum, (b) an
expanded view of the unloading/reloading portion of the load vs. displacement data. (From Oliver, W.C. and Pharr,
G.M., 1992, J. Mater. Res. 7, 1564–1583. With permission.)
© 1999 by CRC Press LLC
FIGURE 10.37 Load vs. displacement plot for an electropolished single-crystal tungsten (a) at a peak load of
120 mN, (b) at a peak load of 0.5 mN (elastic contact), and (c) at a peak load of 1.5 mN showing the yield point.
(From Oliver, W.C. and Pharr, G.M., 1992, J. Mater. Res. 7, 1564–1583. With permission.)
© 1999 by CRC Press LLC
in Figure 10.40 were taken over two cycles of loading and unloading. At high peak loads, the initial
unloading curve for silicon is not at all smooth, but exhibits a sharp discontinuity caused by the surface
of the specimen being suddenly thrust outward, Figure 10.40a. At lower peak loads, the behavior changes,
and below some critical value the discontinuity is no longer observed, Figure 10.40b. However, at this
load the load–displacement behavior shows another anomalous feature — a large hysteresis which shows
no sign of degeneration through several cycles of deformation. The fact that the curves are highly
hysteretic implies that deformation is not entirely elastic. The discontinuity at high loads and the
nondegenerative hysteresis at low loads are quite unique to silicon and are observed in each of the (100),
(110), and (111) orientations. The load below which the discontinuity disappears and the hysteresis
becomes apparent is generally in the range 5 to 20 mN. Pharr (1992) concluded that larger hysteresis
observed in the unloading curve at low loads is due to a pressure-induced phase transformation from
its normal diamond cubic form to a b–tin metal phase (Figure 10.41). At some point in the transforma-
tion, an amorphous phase is formed whose evidence is reported by Callahan and Morris (1992). The
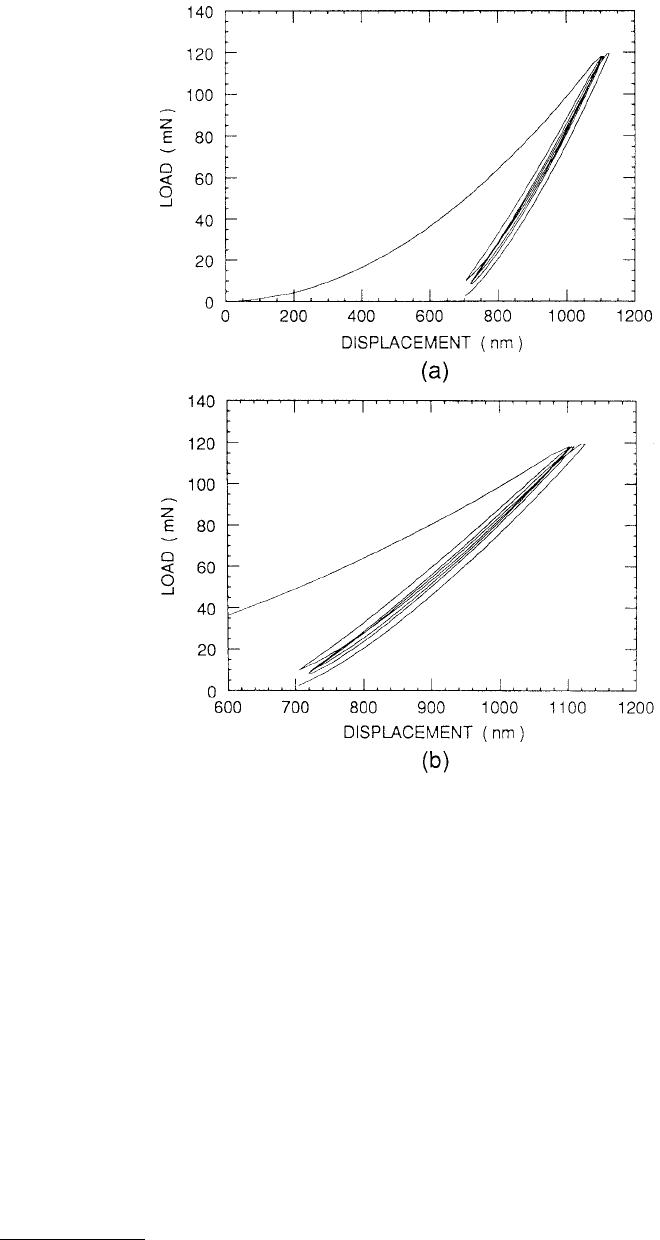
FIGURE 10.38 (a) Load vs. displacement plot for a soda lime glass and (b) an expanded view of the unload-
ing/reloading portion of the load vs. displacement data. (From Oliver, W.C. and Pharr, G.M., 1992, J. Mater. Res. 7,
1564–1583. With permission.)
© 1999 by CRC Press LLC
discontinuity in displacement observed during unloading at peak loads of greater than about 15 mN is
due to formation of a lateral crack which forms at the base of the median crack (Figure 10.41). Lateral
cracking is aided by the phase transformations.
Weihs et al. (1992) indented Si(100) with 120 mN of load. The load–displacement curve is shown in
Figure 10.42a and the first AE signal that was recorded for this test is shown in Figure 10.42b. The AE
signals were sharp and they correlated with small jumps in tip displacement. The rise time for the signal
in Figure 10.42b is 1.5 µs. After testing, radial cracks were visible at the corners of indentation. AE events
such as the one shown in Figure 10.42b were recorded at applied load as low as 48 mN on loading. In
the final stages of unloading, small AE signals that had an inverted shape compared with Figure 10.42b
FIGURE 10.39 Load vs. displacement plots for fused silica (a) at a peak load of 120 mN and (b) at a peak load of
4.5 mN. (From Pharr, G.M., 1992, in Thin Film: Stresses and Mechanical Properties III, W.D. Nix et al., eds., Vol. 239,
pp. 301–312, Materials Research Society, Pittsburgh. With permission.)