Czichos H., Saito T., Smith L.E. (Eds.) Handbook of Metrology and Testing
Подождите немного. Документ загружается.

608 Part C Materials Properties Measurement
a)
c)
b)
XXX
[110]
[110]
50 nm 50 nm
1.6 1.61 1.62
Photon energy (eV)
PL intensity (cps)
XX
X
10
8
6
4
2
0
12 43 3012
(cps) (cps)
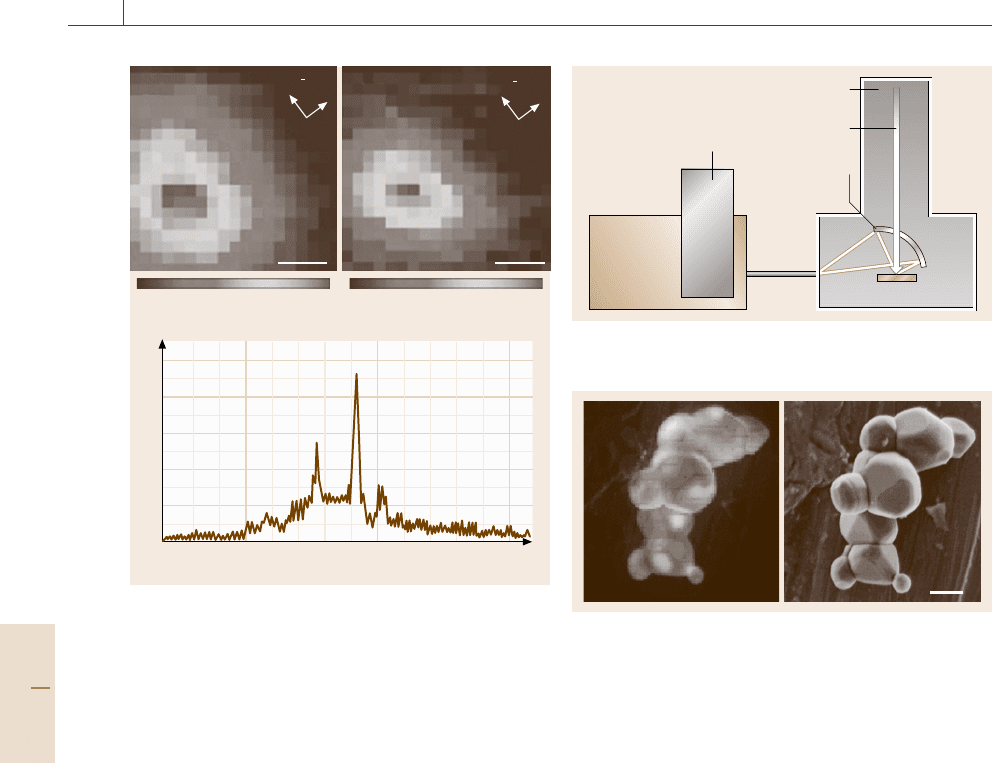
Fig. 11.27a–c High-resolution photoluminescence SNOM
images of (a) X – exciton state, and (b) XX – biexciton state
for a single GaAs quantum dot. The corresponding photo-
luminescence spectrum is also shown in (c) (after [11.32])
tric conductivity, since it induces an electric field which
disturbs the radiative recombination of carriers. In addi-
tion, incident electrons with high kinetic energy often
give rise to degradation of the sample. In CL spec-
troscopy, it is important to recognize those properties
and to treat samples with a metal coating if needed.
Figure 11.29 illustrates an example of CL measure-
ment on a system based on SEM. Spatial distribution of
spectrally integrated CL intensity as well as SEM im-
age is obtained, as shown in Fig. 11.29a,b. The sample
is ZnO:Zn which corresponds to ZnO with many oxy-
gen vacancies near the surface, and is a typical green
phosphor. The CL image consists of 100×100 pixels,
and the brightness of each pixel shows the CL intensity
under the excitation within an area of 63 × 63 nm
2
. The
CL intensity is different among spatial positions at the
nanoscale. The CL spectrum for each pixel can also be
derived from this measurement, and the feature varies
according to positions.
The penetration depth of incident electrons under
electron-beam excitation is controllable by changing the
accelerating voltage [11.33]. Electrons with high ki-
CCD camera
Ellipsoidal
mirror
Electron beam
Sample
Scanning electron microscope (SEM)
Optical
fiber
Spectro-
meter
Fig. 11.28 Configuration of the CL measurement system
based on SEM
a)
b)
1.0 μm
Fig. 11.29 (a) Spectrally integrated CL image of ZnO:Zn
particles, and (b) SEM image at the same position
netic energy are able to penetrate deeper than photons
which penetrate at most up to the depth correspond-
ing to the reciprocal of the absorption coefficient, and
therefore internal optical properties of substances can
be examined in CL measurement. An example of accel-
erating voltage dependence of CL spectra is illustrated
in Fig. 11.30. The sample is once again ZnO:Zn, in
which free-exciton luminescence by photoexcitation is
not observed at room temperature, since excitons are
separated into electrons and holes due to the electric
field in the surface depletion layer [11.34]. For an ac-
celerating voltage of 2 kV, at which the penetration
depth of incident electrons is comparable to the recip-
rocal of the absorption coefficient of photons, the CL
spectrum does not show any structure in the exciton
resonance region. On the other hand, the free exci-
ton luminescence appears for an accelerating voltage
of 5 kV, at which the penetration depth of the incident
electrons is estimated to be about five times larger than
that of photons. The luminescence is highly enhanced
for an accelerating voltage of 10 kV, at which incident
electrons are considered from the estimation of the pen-
etration depth to spread throughout the electron-injected
Part C 11.2
Optical Properties 11.3 Magnetooptical Measurement 609
15
10
5
0
3.0 3.1 3.2 3.3 3.4 3.5 3.6
Photon energy (eV)
CL Intensity (arb. units)
Room temperature
Beam current
10 nA
Accelerating
voltage
10 kV
5 kV
2 kV
Fig. 11.30 Accelerating-voltage dependence of CL spectra
in the exciton-resonance region at room temperature
ZnO:Zn particle. Although the total number of carriers
in the particle increases with the accelerating voltage,
the change in carrier density should be small because
of the increase in excitation volume, i.e. nonlinear en-
hancement of the luminescence is not attributed to any
high density effects. These facts indicate that injected
electrons penetrate into the internal region where many
excitons can recombine radiatively due to the lower con-
centration of oxygen vacancies, and the width of the
depletion layer in the particle is of the order of the
reciprocal of the absorption coefficient.
The electric field in the depletion layer can be
screened by increasing the density of photoexcited
carriers. However, photoexcitation with high carrier
density also induces strong nonlinear optical response
near the exciton resonance region, such as exciton–
exciton scattering and electron–hole plasmas [11.35].
In CL measurements, nonlinear effects do not appear in
ZnO:Zn, since the carrier density under electron-beam
excitation in the system based on SEM is much lower
than that under photoexcitation using pulsed lasers. The
free exciton luminescence does not appear with low ac-
celerating voltage and low beam current, as shown in
Fig. 11.30, whereas it can be observed with larger beam
current. In CL spectroscopy, the internal electric field
in the depletion layer is weakened with high efficiency
and the free exciton luminescence near the surface can
be observed without high density effects, since electrons
are directly supplied into the oxygen vacancies, which
are a source of the internal field.
11.3 Magnetooptical Measurement
11.3.1 Faraday and Kerr Effects
It is well known in magnetooptical effect that the polar-
ization plane of an electromagnetic wave propagating
through matter is rotated under the influence of a mag-
netic field or the magnetization of the medium [11.36].
This effect is called the Faraday effect, named after
the discoverer Michael Faraday [11.37]. This effect is
phenomenologically explained as the difference of the
refractive index between right and left circular polariza-
tions. In this effect the angle of optical rotation is called
the Faraday rotation angle. In the case of low applied
magnetic field the Faraday rotation angle θ
F
is propor-
tional to the sample thickness l and the applied magnetic
field H. Thus θ
F
is written as
θ
F
= VlH , (11.67)
where V is called the Verdet constant. The Faraday
effect appears even without a magnetic field in an opti-
cally active medium, e.g. saccharide, etc. Furthermore,
the magnetic Kerr effect is the Faraday effect for re-
flected light [11.38]. This effect is ascribed to the phase
difference between right and left circular polarizations
when the electromagnetic wave is reflected on the sur-
face of a magnetic material.
For practical use the Faraday effect is utilized for
imaging of magnetic patterns. These magnetic patterns
have been experimentally studied by various techniques,
1. moving a tiny magnetoresistive or Hall-effect probe
over the surface,
2. making powder patterns with either ferromagnetic or
superconducting (diamagnetic) powders (Bitter dec-
oration technique),
3. using the Faraday magnetooptic effect in transpar-
ent magnetic materials in contact with the surface
of a superconducting film as a magnetooptic layer
(MOL).
In order to get a high-resolution image of the mag-
netic pattern, one of these methods, Faraday microscopy
(3 above), is the most useful [11.39, 40]. A schematic
drawing of the Faraday imaging technique is shown in
Fig. 11.31.
The linearly polarized light enters the MOL,in
which the Faraday effect occurs and is reflected at the
mirror layer. In areas without flux, no Faraday rotation
Part C 11.3

610 Part C Materials Properties Measurement
takes place. This light is not able to pass through the an-
alyzer that is set in a crossed position with respect to the
polarizer, hence the superconducting regions stay dark
in the image. On the other hand, in regions where flux
penetrates, the polarization plane of the incident light is
rotated by the Faraday effect so that some light passes
through the crossed analyzer, thus the normal areas will
be brightly imaged.
Figure 11.31 shows the case of nonzero reflection
angle, whereas in the experiment perpendicular incident
light is normally used (Faraday configuration).
The Faraday rotation angle is transformed into light
intensity levels. The sample surface is imaged onto
a CCD detector array. In the case of crossed polarizer and
analyzer the intensity of the signal from the CCD detec-
tor is
I(r,λ,B) = I
0
(r,λ) sin
2
[θ
F
(r,λ,B)]+I
1
(r,λ) ,
(11.68)
where r is the spatial coordinate on the CCD surface, λ
is the wavelength of the incident light, B is the applied
magnetic field, θ
F
is the Faraday angle, and I
0
is the light
intensity reflected by the sample. I
1
is the background
signal ascribed to the dark signal of the CCD and residual
transmission through the crossed polarizer and analyzer.
When the analyzer is uncrossed by an angle θ,
I(r,λ,B) = I
0
(r,λ) sin
2
[θ +θ
F
(r,λ,B)]
+I
1
(r,λ) . (11.69)
The angular position θ of the analyzer should be
adjusted to obtain the best contrast between supercon-
ducting (θ
F
=0) and normal (θ
F
=0) areas. By changing
the sign of θ, normal areas can appear brighter or darker
than superconducting areas. In our experiment the angle
Analyzer
Polarizer
MOL
Mirror
Super-
conductor
SSN
Magnetic flux
Fig. 11.31 Schematic drawing of the Faraday effect
θ is set to yield black in normal areas and gray in super-
conducting areas.
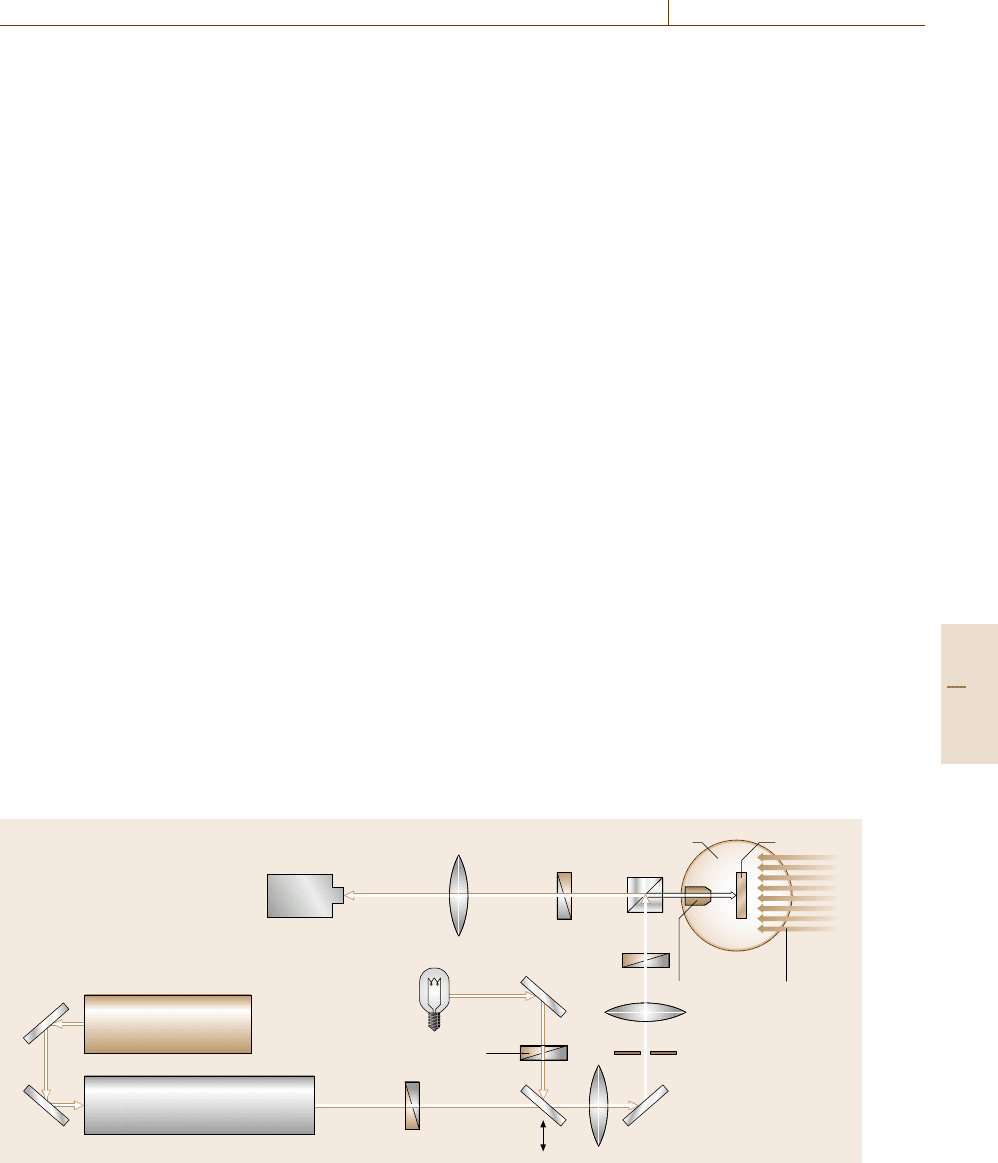
11.3.2 Application to Magnetic Flux Imaging
Experimental Set-up
Magnetooptical imaging is performed using a pumped
liquid-helium immersion-type cryostat equipped with
a microscope objective. This objective, with a numer-
ical aperture of 0.4, is placed in the vacuum part of
the cryostat and can be controlled from outside. The
samples are studied in a magnetic field applied from ex-
terior coils. The optical set-up is similar to a reflection
polarizing microscope as shown in Fig. 11.32. Before
measurement the samples are zero-field cooled to 1.8K.
The indium-with-QWs sample is illuminated with lin-
early polarized light from a Ti:sapphire laser, through
a rotating diffuser to remove laser speckle. In the case
of a lead-with-EuS sample a tungsten lamp with an in-
terference filter is used the light source. Reflected light
from the sample passes through a crossed or slightly
uncrossed analyzer and is focused onto the CCD cam-
era. The spatial resolution of 1 μm is limited by the
numerical aperture of the microscope objective.
Magnetooptic Layers
Conventional magnetooptic layers. As for typical con-
ventional MOLs, essentially, thin layers of Eu-based
MOL (Eu chalcogenides, e.g. EuS and EuF
2
mix-
tures, EuSe) and doped yttrium iron garnet (YIG)films
have been used [11.41]. These are usable up to the
critical temperature of the ferromagnetic–paramagnetic
transition (≈15–20 K) because their Verdet constants
decrease with increasing temperature.
Since EuS undergoes ferromagnetic ordering below
T
c
≈16.3 K, a mixture of EuS with EuF
2
is better used.
EuF
2
stays paramagnetic down to very low tempera-
tures, therefore the ordering temperature of the mixture
can be tuned by the ratio EuS :EuF
2
. But there are sev-
eral problems; difficulty of preparation due to difference
of melting temperatures, and the need for a coevapora-
tion technique.
Then the single-component EuSe layer has been
further used because, even in the bulk, EuSe is param-
agnetic down to 4.6 K and has a larger Verdet constant.
Below 4.6 K, EuSe becomes metamagnetic, however,
the reappearance of magnetic domains in the EuSe lay-
ers is not seen down to 1.5 K. However, there is also
a problem owing to the toxicity of Se compounds.
On the other hand, due to their high transition
temperature (Curie temperature), bismuth- and gallium-
Part C 11.3
Optical Properties 11.3 Magnetooptical Measurement 611
doped yttrium-iron garnets (YIG) have been developed
and used for the study of high-T
c
superconductors. They
are disadvantageous since they show ferrimagnetic do-
mains, however, these MOLs are developed further
by the introduction of ferrimagnetic garnet films with
in-plane anisotropy. Using such films, the optical res-
olution is about 3 μm, but a direct observation of the
magnetic flux patterns is possible and the advantages
of the garnet films, i.e. high magnetic field sensitivity,
large temperature range, are retained.
Generally this kind of MOL often has the demerit of
poor spatial resolution because of their thickness of sev-
eral micrometers. Furthermore, self-magnetic ordering
that may modify the flux distributions in supercon-
ducting samples may limit their use. However, it was
recently reported that an optimized ferrite garnet film
allowed the observation of single flux quanta in super-
conducting NbSe
2
[11.42].
Novel magnetooptic layers. In this section we re-
fer to an alternative type of MOL [11.39, 40] based on
semimagnetic semiconductor (SMSC)Cd
1−x
Mn
x
Te. It
consists of SMSC (also called diluted magnetic semi-
conductor (DMS)) Cd
1−x
Mn
x
Te quantum wells (QWs)
embedded in a semiconductor–metal optical cavity. It is
well-known that SMSCs exhibit a large Faraday rotation
mainly due to the giant Zeeman splitting of the exci-
tonic transition ascribed to sp–d exchange interactions
between spins of magnetic material and band electron
spins. The most advantageous point is no self-magnetic
ordering due to paramagnetic behavior of Mn ions.
Therefore, it is very convenient since there is no possibil-
ity to modify the magnetic flux patterns of intermediate
CCD camera
Analyzer
Cryostat
Sample
Magnetic
field
Microscope
objective
Polarizer
Lamp
Interference filter
Rotating diffuser
Ar
+
Laser
Ti:sapphire laser
Fig. 11.32 Experimental set-up for the Faraday imaging technique
state of type-I superconductors. There are several other
advantages of this MOL. It is easy to increase Fara-
day rotation by making an optical cavity (metal/semi-
conductor/vacuum) with a thickness of = (2n +1)λ/4.
Multiple reflections of light take place inside the cavity.
Moreover, in order to adjust the cavity thickness at the
desired wavelength, a wedged structure is constructed.
The highest spatial resolution is obtained when the su-
perconducting film is evaporated directly onto the MOL.
This is because, the smaller the distance between the
MOL and the sample, the better the magnetic imaging
becomes since there is little stray-field effect.
In addition to these ideas already proposed for con-
ventional MOL (EuSe) [11.41], there is another strong
point. Using QWs is also interesting due to low absorp-
tion, easy adjustment of the balance between absorption
and Faraday rotation by choosing the number of QWs,
and the possibility to have a thin active layer (QWs) in
athickMOL in order to keep good spatial resolution.
When a Cd
1−x
Mn
x
Te QW is inserted in an optical cav-
ity the Faraday rotation can be further increased by using
a Bragg structure, that is, placing the QWs at antinodes
of the electric field in the optical cavity.
In order to make an optical cavity Al, or the su-
perconductor itself if it is a good reflector, should be
evaporated on top of the cap layer as a back mirror.
In order to obtain the largest Faraday rotation, a min-
imum of the reflectivity spectrum has to be matched
with the QWs transition. This is the resonance condi-
tion. However, the reflectivity, which decreases at the
QW transition when the resonance condition is fulfilled,
has to be kept to a reasonable level that is compat-
ible with a good signal-to-noise ratio. Therefore an
Part C 11.3
612 Part C Materials Properties Measurement
optimum number of QWs has to be found in multi-
quantum-well structures. The Mn composition of the
QWs also has to be optimized. It governs not only the
Zeeman splitting of the excitonic transition but also the
linewidth.
The time decay of the magnetization of the Mn ions
in SMSC is known to be fast, in the subnanosecond
range, since it is governed by spin–spin relaxation rather
than by spin–lattice relaxation [11.43, 44]. This opens
the way for time-resolved imaging studies with good
temporal resolution, e.g. the study of the dynamics of
flux penetration. On the other hand, there are also prob-
lems in fabrication. It is troublesome to remove the GaAs
substrate by chemical etching while retaining fragile lay-
ers. Furthermore, the chemical etching solution strongly
reacts with some metals e.g. lead.
Lead with europium sulfide magnetooptic layers.
Since lead reacts strongly with the chemical etching
solution used to remove the GaAs substrate from the
Mirror (Al)
1500 A
Glue
Glass
Glass
Superconducting film
(PB) 120 μm
MOL (EuS) 1450 A
Fig. 11.33 Schematic drawing of Pb with EuS sample.
The thickness of EuS, Al, and Pb are 145, 150 nm, and
120 μm, respectively. EuS is fabricated by Joule-effect
evaporation. The EuS MOL is fixed on the Pb by pressing
overnight
1.0
0.5
0.0
–0.5
–1.0
70
60
50
40
30
20
10
0
500 550 600 650 700 750 800
Faraday angle (deg)
Wavelength (nm)
Reflectivity (arb. units)
EuS
H = 53.3 (mT)
Fig. 11.34 Right scale: light reflection spectrum for zero applied
magnetic field H = 0mTat T = 2K.Left scale: Faraday rotation-
angle spectrum for H = 53.3 mT (after T. Okada, unpublished)
SMSC sample, we tried to use EuS as a MOL. The
sample is shown in Fig. 11.33.
The thickness of the EuS MOL fabricated by Joule-
effect evaporation on a 0.4 mm glass substrate is 145 ±
15 nm, hence it is thin enough for good spatial resolution.
A 150-nm-thick Al layer is evaporated on the EuS MOL
as a mirror in order to get high reflectivity. The EuS MOL
is pressed onto Pb with a weight and left overnight.
A typical reflectivity spectrum and Faraday angle
curve of EuS MOL are displayed in Fig. 11.34. The
Ti:sapphire laser is tuned to 700 nm to get good reflected
light and large Faraday rotation angle from the sample.
Indeed EuS MOL may be expected to disturb the flux
pattern, but no self-magnetic domain could be observed
in this EuS sample, probably because the layer consists
of a mixture of EuS and EuO. Figure 11.35 shows the im-
ages of the magnetic flux pattern at the surface of a 120-
μm-thick superconducting lead film for magnetic field
values of 20 mT. The temperature is 2 K, that is, much
lower than the critical temperature of lead (7.18 K). The
critical field of lead at 2 K is H
c
(2 K) =74.1mT.
The raw image has to be processed in order to cor-
rect the intensity fluctuations of the reflected light for
thickness fluctuations in the MOL and for the sensitiv-
ity of CCD detector. In order to obtain an intensity level
proportional to the Faraday angle, the gray level of each
pixel should be calculated as
I
= I
α
H
/I
α
H=0
. (11.70)
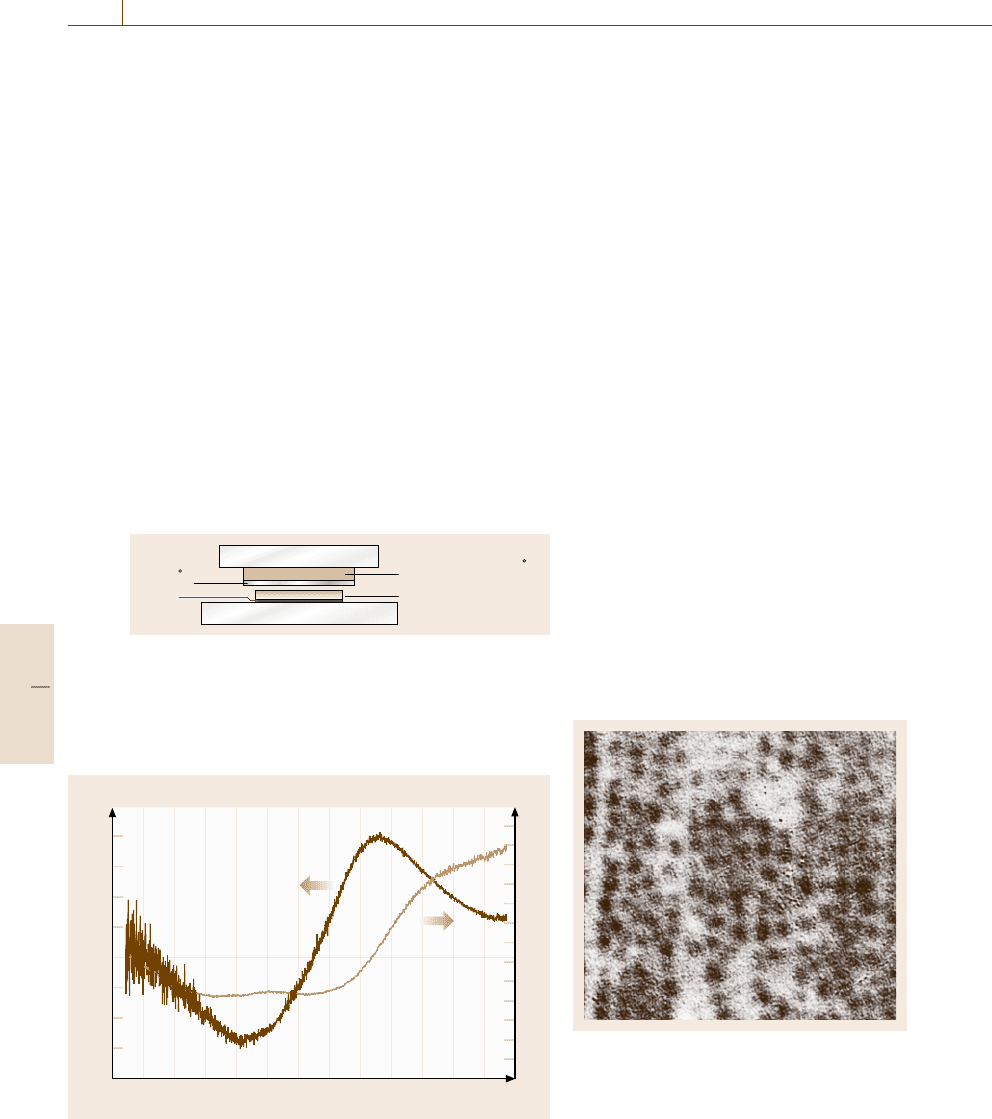
Fig. 11.35 The image of the magnetic flux patterns at the
surface of 120-μm-thick superconducting Pb revealed with
an EuS magneto-optical layer in an applied magnetic field
of 20 mT (h = 0.270). Normal and superconducting do-
mains appear in black and gray, respectively. The image
size is 233 μm×233 μm. The temperature is T =2 K (af-
ter T. Okada, unpublished)
Part C 11.3
Optical Properties 11.3 Magnetooptical Measurement 613
Indium
10 μm
Cd
0.94
Mn
0.06
Te 100 A QWs
Cd
0.85
Mg
0.15
Te QWs
617 A 558 A 558 A Wedged barrier
6 μm
Fig. 11.36 Schematic representation of the sample compo-
sition (not to scale) after the etching of the GaAs substrate
6
5
4
3
2
1
0
6
5
4
3
2
1
0
1600 1650 1700 1750 1800
Photon energy (meV)
Reflectivity (arb. units) Faraday angle (deg)
Fig. 11.37 Left scale: light reflection spectrum for zero ap-
plied magnetic field H = 0mT at T =2K. Right scale:
Faraday rotation-angle spectrum for H =56 mT
where I
α
H
is the raw gray level obtained for an applied
field H and an analyzer angle α and θ is the Faraday
angle. The quality of the image is further improved by
Fourier-transform filtering, but the magnetic contrast is
not very good because the contact between lead and the
MOL may not be as good as for an evaporated metallic
sample.
Indium with quantum-well magnetooptic layers.
The sample consists of an indium layer as the super-
conducting material and a Cd
1−x
Mn
x
Te/Cd
1−y
Mg
y
Te
heterostructure as the MOL. The structure is sketched
in Fig. 11.36 [11.40].
The semiconductor heterostructure was grown by
molecular beam epitaxy. The Cd
0.85
Mg
0.15
Te buffer
was deposited on (001)GaAs substrate without rota-
tion of the sample holder, resulting in a slight gradient
of both the thickness of the buffer and its refrac-
Fig. 11.38 The image of the magnetic flux patterns at the
surface of 10-μm-thick superconducting In film revealed
with the Cd
1−x
Mn
x
Te QWs structure as the magneto-
optical layer in an applied magnetic field of 6.3mT (h =
0.325). Normal and superconducting domains appear in
black and gray, respectively. The edge of the indium film
can be seen on the right-hand side of images where the
flux pattern disappears. The image size is 527 μm ×527 μm.
The analyzer was uncrossed by α =20
◦
with respect to the
polarizer. The temperature is T =1.9 K (after T. Okada, un-
published)
tive index. The buffer was followed by three 10-nm
Cd
0.94
Mn
0.06
Te QWs separated by Cd
0.85
Mg
0.15
Te
barriers that were 55.8 nm thick. A 10-μm-thick indium
layer was then evaporated directly on top of the 61.7-nm
Cd
0.85
Mg
0.15
Te cap layer. The MOL is designed as an
optical cavity and indium serves both as the supercon-
ducting layer and the cavity back mirror. The first and
third QWs are nearly located at antinodes of the electric
field in the cavity in order to enhance Faraday rotation.
The indium-covered side was glued onto a glass plate
and the GaAs substrate was removed by mechanical
thinning and selective chemical etching. For the Fara-
day microscopy the spatial resolution was checked as
1 μm, with a magnetic resolution of 10 mT; the range of
temperature for use should be up to 20 K.
A typical reflectivity spectrum and Faraday angle
curve are displayed in Fig. 11.37. The reflectivity spec-
trum presents an interference pattern associated with
the metal/semiconductor/vacuum optical cavity. This
pattern shows a spectral shift when the illuminating
spot is scanned along the sample surface, according
to the thickness variation of the cavity. The maximum
Faraday angle is observed when a minimum of reflec-
Part C 11.3

614 Part C Materials Properties Measurement
tivity is matched with the QW transition energy (the
cavity resonance condition). The peak Faraday angle
was found to vary linearly with the applied magnetic
field H. The measured slope equals 54.4
◦
T
−1
at the
QWs (e1-hh1) exciton transition. Fig. 11.38 shows an
intermediate state structure at the surface of the indium
superconducting layer obtained at T = 1.9K at mag-
netic field values 6.3 mT. The critical field of indium
at 1.9Kis19.4mT.
Black and gray areas are normal and supercon-
ducting state, respectively. The intricate flux pattern
results from the competition between long-range re-
pulsive magnetic interactions between normal zones
and short-range interactions due to the positive in-
terfacial energy between normal and superconducting
areas [11.45,46].
In the same way as for the lead sample, the raw
images were processed in order to eliminate intensity
fluctuations of the reflected light due to thickness in-
homogeneities of the MOL and the sensitivity of CCD
detector. The quality of the image is further improved
compared with Fig. 11.35.
11.4 Nonlinear Optics and Ultrashort Pulsed Laser Application
Nonlinear optical effects with lasers are utilized in fre-
quency conversion, optical communication (Sect. 11.5)
and spectroscopy of materials. This chapter deals with
nonlinear optics and its application to pulsed lasers.
11.4.1 Nonlinear Susceptibility
Definition of Nonlinear Susceptibility
and Symmetry Properties
Nonlinear optical phenomena originate from nonlin-
earity of materials. Linear and nonlinear polarization
induced in the material is expressed as follows
P
i
=χ
ij
E
j
+χ
(2)
ijk
E
j
E
k
+χ
(3)
ijkl
E
j
E
k
E
l
+···,
(11.71)
where i, j, k and l represent x, y,orz and χ
(n)
,whichis
an (n +1)th-rank tensor, is called the n-th-order nonlin-
ear optical susceptibility. Each term corresponds to the
n-th order polarization
P
(n)
i
1
=χ
(n)
i
1
i
2
···i
n+1
n
E
i
2
E
i
3
···E
i
n+1
, (11.72)
where i
1
, i
2
,...,ori
n+1
represents x, y,orz. The
second-order nonlinearity in the argument ω is de-
scribed by
P
(2)
i
(ω
1
+ω
2
) =χ
(2)
ijk
(ω
1
+ω
2
;ω
1
,ω
2
)
× E
j
(ω
1
)E
k
(ω
2
) . (11.73)
The χ
(2)
tensor has the following symmetry proper-
ties [11.47].
1. Intrinsic permutation symmetry
χ
(2)
ijk
(ω
1
+ω
2
;ω
1
,ω
2
) =χ
(2)
ik j
(ω
1
+ω
2
;ω
2
,ω
1
)
(11.74)
2. Permutation symmetry for materials without losses
χ
(2)
ijk
(ω
1
+ω
2
;ω
1
,ω
2
)
=χ
(2)
jki
(ω
1
;−ω
2
,ω
1
+ω
2
)
=χkij
(2)
(ω
2
;ω
1
+ω
2
, −ω
1
) (11.75)
3. Kleinman’s relation (for the nonresonant case χ
(2)
is independent of the frequency ω)
χ
(2)
ijk
=χ
(2)
jki
=χ
(2)
kij
=χ
(2)
ik j
=χ
(2)
jik
=χ
(2)
kji
,
(11.76)
where the arguments are (ω
1
+ω
2
;ω
1
,ω
2
). A con-
sideration of crystal symmetry allows us to reduce
the number of elements of the χ
(n)
tensor of the ma-
terial [11.47,48]. A typical example is as follows.
If the material has inversion symmetry,
−P
(2)
i
=χ
(2)
ijk
(−E
j
)(−E
k
) ,
P
(2)
i
=0 .
In the same way, we obtain
P
(2n)
=0(n : integer) .
Then if the material has inversion symmetry,
χ
(2n)
=0(n : integer). (11.77)
Oscillator Model
Including Nonlinear Interactions
The nonlinear optical susceptibility can be calculated
quantum mechanically using the density matrix formal-
ism [11.47]. Here we use a classical model [11.49], mod-
ifying the Lorentz oscillator model (11.15) to include
nonlinear interactions of light and matter as follows
m
d
2
x
dt
2
=−mγ
dx
dt
−mω
2
0
x −amx
2
−bmx
3
+eE(t) , (11.78)
Part C 11.4

Optical Properties 11.4 Nonlinear Optics and Ultrashort Pulsed Laser Application 615
where the third and fourth terms on the right-hand side
correspond to the second- and third-order anharmonic
potentials, respectively. Here we assume that the driving
term can be expressed by
E(t) ={E
1
[exp(−iω
1
t)+exp(iω
1
t)]
+E
2
[exp(−iω
2
t)+exp(iω
2
t)]}/2 . (11.79)
We can solve (11.78) by perturbative expansion of x(t)
in powers of the electric field E(t),
x(t) ≡ x
(1)
+x
(2)
+x
(3)
+···,
where x
(i)
is proportional to [E(t)]
i
. Then we get the suc-
cessive equations as follows
d
2
x
(1)
dt
2
+γ
dx
(1)
dt
+ω
2
0
x
(1)
=
eE(t)
m
, (11.80)
d
2
x
(2)
dt
2
+γ
dx
(2)
dt
+ω
2
0
x
(2)
=a(x
(1)
)
2
, (11.81)
d
2
x
(3)
dt
2
+γ
dx
(3)
dt
+ω
2
0
x
(3)
=2ax
(1)
x
(2)
+b(x
(1)
)
3
. (11.82)
If we define a common denominator
D(ω) ≡
1
ω
2
0
−ω
2
−iγω
, (11.83)
the solution of (11.80) is expressed by
x
(1)
=[E
1
D(ω) exp(−iω
1
t)
+E
2
D(ω) exp(−iω
2
t)]×e/(2m)+c.c. ,
(11.84)
where c.c. means complex conjugate. This is just a su-
perposition of (11.95). Then we substitute this result for
the right-hand side of (11.81). The solution consists of
five groups as follows
x
(2)
(2ω
1
) =−
E
2
1
D(2ω
1
)D(ω
1
)
2
×exp(−2iω
1
t)
ae
2
/(4m
2
) +c.c. ,
(11.85)
x
(2)
(2ω
2
) =−
E
2
2
D(2ω
2
)D(ω
2
)
2
×exp(−2iω
2
t)
ae
2
/(4m
2
) +c.c. ,
(11.86)
x
(2)
(ω
1
+ω
2
) =−
E
1
E
2
L(ω
1
+ω
2
)D(ω
1
)D(ω
2
)
×exp[−i(ω
1
+ω
2
)t]
ae
2
/(2m
2
)
+c.c. , (11.87)
x
(2)
(ω
1
−ω
2
) =−
E
1
E
∗
2
D(ω
1
−ω
2
)D(ω
1
)D(ω
2
)
∗
×exp[−i(ω
1
−ω
2
)t]
ae
2
2m
2
+c.c. ,
(11.88)
x
(2)
(0) =−
|E
1
|
2
D(ω
1
) +|E
2
|
2
D(ω
2
)
×
ae
2
2m
2
. (11.89)
These equations indicate that new frequency compo-
nents arise from the second-order nonlinearity. These
components are used in frequency conversion. Details
are discussed in the following subsection.
Next, the third-order nonlinearity is treated similarly,
assuming three frequency components
E(t) =
E
1
exp(−iω
1
t)+E
2
exp(−iω
2
t)
+E
3
exp(−iω
3
t)
/2+c.c. (11.90)
Thenusing(11.82–11.89) for all combinations of ω
1
, ω
2
and ω
3
, we finally obtain 22 groups
x
(3)
for ω
1
+ω
2
+ω
3
,ω
1
+ω
2
−ω
3
,ω
1
−ω
2
+ω
3
,
−ω
1
+ω
2
+ω
3
, 2ω
1
±ω
2
, 2ω
1
±ω
3
,
2ω
2
±ω
3
, 2ω
2
±ω
1
, 2ω
3
±ω
1
, 2ω
3
±ω
2
,
ω
1
,ω
2
,ω
3
, 3ω
1
, 3ω
2
and 3ω
3
.
For example,
x
(3)
(ω
1
,ω
2
, −ω
2
)
=−E
1
E
2
E
∗
2
D(ω
1
)
2
D(ω
2
)D(ω
2
)
∗
exp(−iω
1
t)
+c.c. , (11.91)
x
(3)
(ω
1
,ω
1
, −ω
2
)
=−E
2
1
E
∗
2
D(2ω
1
−ω
2
)D(ω
1
)
2
D(ω
2
)
∗
×exp[−i(2ω
1
−ω
2
)t]
3b
2
−2a
2
D(ω
1
−ω
2
)
−a
2
D(2ω
1
)
e
2
4m
3
+c.c. (11.92)
The i-th-order polarization is given by
P
(i)
=−nex
(i)
. (11.93)
Then from (11.72), (11.91) we obtain a frequency com-
ponent of the third-order polarization
P
(3)
(ω
1
) =neD(ω
1
)
2
|D(ω
2
)|
2
|E(ω
2
)|
2
E(ω
1
)
≡χ
(3)
(ω
1
;ω
1
+ω
2
−ω
2
)
×|E(ω
2
)|
2
E(ω
1
) . (11.94)
This term means that the optical constant, e.g. refractive
index n for the ω
1
light, can be controlled by the other
light of ω
2
.
Part C 11.4

616 Part C Materials Properties Measurement
Table 11.6 Va lu es of χ
(2)
for typical nonlinear crystals
Material Maximum value Fundamental
of χ
(2)
(10
−8
esu) wavelength (μm)
α-SiO
2
0.19 1.06
Te 2.5×10
3
10.6
BaNaNb
5
O
15
9.6 1.06
LiNbO
3
19 1.06
BaTiO
3
−8.5 1.06
ADP (NH
4
H
2
PO
4
) 0.24 0.694
KDP (KH
2
PO
4
) 0.25 1.06
β-BBO (BaB
2
O
4
) 0.98 1.06
ZnO −3.3 1.06
LiIO
3
−2.8 1.06
CdSe 26 10.6
GaAs 95 10.6
GaP 18 3.39
Estimation of Nonlinear Susceptibility
We can estimate the value of χ
(2)
using the anharmonic
oscillator model, e.g. in the case of (11.84) as follows
P
(2)
(ω
1
+ω
2
) =−nex
(2)
≡χ
(2)
(ω
1
+ω
2
,ω
1
,ω
2
)E(ω
1
)E(ω
2
) ,
(11.95)
if we neglect the complex conjugate term,
χ
(2)
(ω
1
+ω
2
,ω
1
,ω
2
)
=
D(ω
1
+ω
2
)D(ω
1
)D(ω
2
)nae
3
m
2
.
=
χ
(1)
(ω
1
+ω
2
)χ
(1)
(ω
1
)χ
(1)
(ω
2
)ma
N
2
e
3
.
Then we obtain Miller’s rule
χ
(2)
ω
1
+ω
2
,ω
1
,ω
2
χ
(1)
(ω
1
+ω
2
)χ
(1)
(ω
1
)χ
(1)
(ω
2
)
=
ma
n
2
e
3
(const.) .
(11.96)
The density is estimated approximately
n ≈
1
d
3
,
where d is a lattice constant. If we assume mω
2
0
d =mad,
a =
ω
2
0
d
.
In the nonresonant case, the denominator is approxi-
mated by
D(ω) ≈
1
ω
2
0
.
Table 11.7 Second-order nonlinear effects
Name of frequency conversion Conversion process
Second harmonic generation
(SHG) ω →2ω
Sum frequency generation
(SFG) ω
1
,ω
2
→ω
1
+ω
2
Difference frequency generation
(DFG) ω
1
,ω
2
→ω
1
−ω
2
Optical rectification (OR) ω →0(DC)
Optical parametric generation
(OPG) ω →ω
1
,ω
2
(ω = ω
1
+ω
2
)
Finally we can estimate the value of χ
(2)
χ
(2)
≈
e
3
m
2
ω
4
0
d
4
≈10
−8
esu , (11.97)
if we assume ω
0
≈10
16
s
−1
and d ≈0.1nm.Table11.6
showsvaluesofχ
(2)
for typical nonlinear crystals.
Frequency Conversion
As seen in (11.85–11.89), second-order nonlinearity en-
ables frequency conversion by mixing of two photons.
Frequency conversion processes using χ
(2)
are summa-
rized in Table 11.7.
Second-harmonic generation (SHG), expressed by
(11.85), is widely used for generation of visible or ul-
traviolet lights, because most solid-state lasers including
LDs deliver infrared or red lights; e.g. a green line at
532 nm is the SH of a Nd:YAG laser (1064 nm) and
near-UV region (350–500 nm) is covered by the SH of
a Ti:sapphire laser (Fig. 11.16). The SHG is also used
to measure the pulse width of an ultrashort pulsed laser
(Sect. 11.4.3).
Sum-frequency generation (SFG)in(11.87) is also
used for the generation of the higher frequency region
from the lower frequency region; the third-harmonic
generation (THG) at 355 nm is achieved by SFG of the
SH and fundamental of the Nd:YAG laser. The SFG pro-
vides up-conversion spectroscopy (Sect. 11.4.3).
Difference-frequency generation (DFG)in(11.88)is
used for generation of infrared light. A combination of
DFG and OPO enables us to tune the frequency in the in-
frared region (3–18 μm) with AgGaS
2
or GaSe crystals.
Optical rectification (OR)in(11.89) is a special case of
DFG and provides ultra-broadband infrared pulse gener-
ation by using femtosecond lasers (Sect. 11.4.5).
Optical-parametric generation (OPG) is the reverse
process of SFG; one photon is divided into two pho-
Part C 11.4
Optical Properties 11.4 Nonlinear Optics and Ultrashort Pulsed Laser Application 617
Crystal length
Coherence length 2l
c
SHG intensity
Fig. 11.39 SHG intensity with respect to crystal length
tons. This process is utilized in a tunable laser, optical-
parametric oscillator (OPO), pumped with a fixed-
frequency laser.
Phase-matching condition is crucial for efficient fre-
quency conversion [11.47]. The wavevector should be
conserved in the frequency conversion processes; in the
SHG case the phase-matching condition is described by
k(2ω) =2k(ω) , (11.98)
where k(ω) is the wavevector at frequency ω.Inother
cases, the converted component 2ω and the incident
component ω interfere with each other destructively, as
seen in Fig. 11.39. Here the coherence length l
c
is de-
fined by
l
c
=
πc
2
[ω|n(ω) −n(2ω)|], (11.99)
where n(ω) is the refractive index at frequency ω. The
condition in (11.98) means that l
c
becomes infinity. The
phase-matching condition can be achieved using bire-
fringence of a nonlinear crystal [11.47].
Third-order Nonlinear Effects
The third-order nonlinearity causes a variety of effects,
which are summarized in Table 11.8.
Though the third-harmonic generation (THG)is
used in frequency conversion, this process is useful for
obtaining the spectroscopic information on the magni-
tude of χ
(3)
or electronic structures, which is called THG
spectroscopy [11.50].
Refractive index of the material depends on the in-
tensity of the incident light as follows
n = n
0
+n
2
I , (11.100)
where n
2
is nonlinear refractive index and I is the in-
tensity of the light. As already seen in (11.94), the n
2
is
proportional to χ
(3)
n
2
=
χ
(3)
n
2
0
cε
0
. (11.101)
This refractive index change that is dependent on the
light intensity is called the optical Kerr effect(OKE), and
Table 11.8 Third-order nonlinear effects
The third-order effect Notes
Third-harmonic generation (THG) ω → 3ω
Optical Kerr effect (OKE) n →n
0
+n
2
I
Two-photon absorption (TPA) α → α
0
+β I
Four-wave mixing (FWM) ω
1
,ω
2
,ω
3
→ω
4
produces a nonlinear phase shift ΔΦ
ΔΦ =
2π
λ
n
2
Il , (11.102)
where l is the sample length. The nonlinear phase
shift is utilized in optical switching (Sect. 11.5). The
OKE gives rise to transverse variations of a light beam
which cause the wavefront distortion that leads to self-
focusing [11.47], used in Kerr lens mode-locking
(Sect. 11.4.2) or Z-scan measurement (Sect. 11.4.4). The
OKE also leads to temporal variations of the phase of the
light pulse, called self-phase modulation (SPM), which
cause frequency shift, called frequency chirp [11.51],
shown in Fig. 11.40. If a strong beam is focused on a ma-
terial with large nonlinearity, white-light continuum can
be generated via the SPM. This phenomenon is widely
used in spectroscopy (Sect. 11.4.4).
The imaginary part of the complex refractive index
also depends on the intensity of the incident light due to
the third-order nonlinearity. Thus the absorption coeffi-
cient is defined by
α(I) =α +β I , (11.103)
where β is called the two-photon absorption (TPA) co-
efficient. TPA is explained in Sect. 11.4.4. We apply the
Kramers–Kronig relation (11.21) to the nonlinear optical
constants
n
2
(ω) =
c
π
∞
0
β(ω
)
ω
2
−ω
2
dω
. (11.104)
Light electric field
Time
Fig. 11.40 Schematic illustration of a frequency chirp. The
instantaneous frequency changes from red to blue
Part C 11.4