Czichos H., Saito T., Smith L.E. (Eds.) Handbook of Metrology and Testing
Подождите немного. Документ загружается.

598 Part C Materials Properties Measurement
where σ is called the optical conductivity.From(11.23)
and (11.27),
σ(ω) =
σ
0
1 −iωτ
, (11.37)
where
σ
0
≡
ne
2
τ
m
. (11.38)
σ
0
corresponds to the DC conductivity. Thus the DC
conductivitycan be estimated by purely optical measure-
ments without electrical contacts. Optical conductivity is
written in terms of the dielectric function as follows
σ(ω) =−iε
0
ω [ε(ω) −1] . (11.39)
The Kramers–Kronig relations of the optical conductiv-
ity are as follows
σ
1
(ω) =
2
π
P
∞
0
ω
σ
2
(ω
)
ω
2
−ω
2
dω
, (11.40)
σ
2
(ω) =
−2ω
π
P
∞
0
σ
1
(ω
)
ω
2
−ω
2
dω
, (11.41)
where σ
1
(σ
2
) is the real (imaginary) part of the σ.
Optical Conductivity of Superconductors
Superfluid electrons in superconductors can move with-
out dissipation, therefore one can take the limit τ
−1
→0
in (11.37),
σ(ω) →−
n
S
e
2
iωm
,
where n
S
corresponds to the superfluid electron density.
Accordingly, the real part σ
1
for the superfluid electrons
is zero unless ω = 0. Using (11.40), σ
1
is expressed by
a delta function,
σ
1
(ω) =
πn
S
e
2
m
δ(ω) . (11.42)
1.0
0.8
0.6
0.4
0.2
0.0
0
21
Reflectivity
φ/φ
p
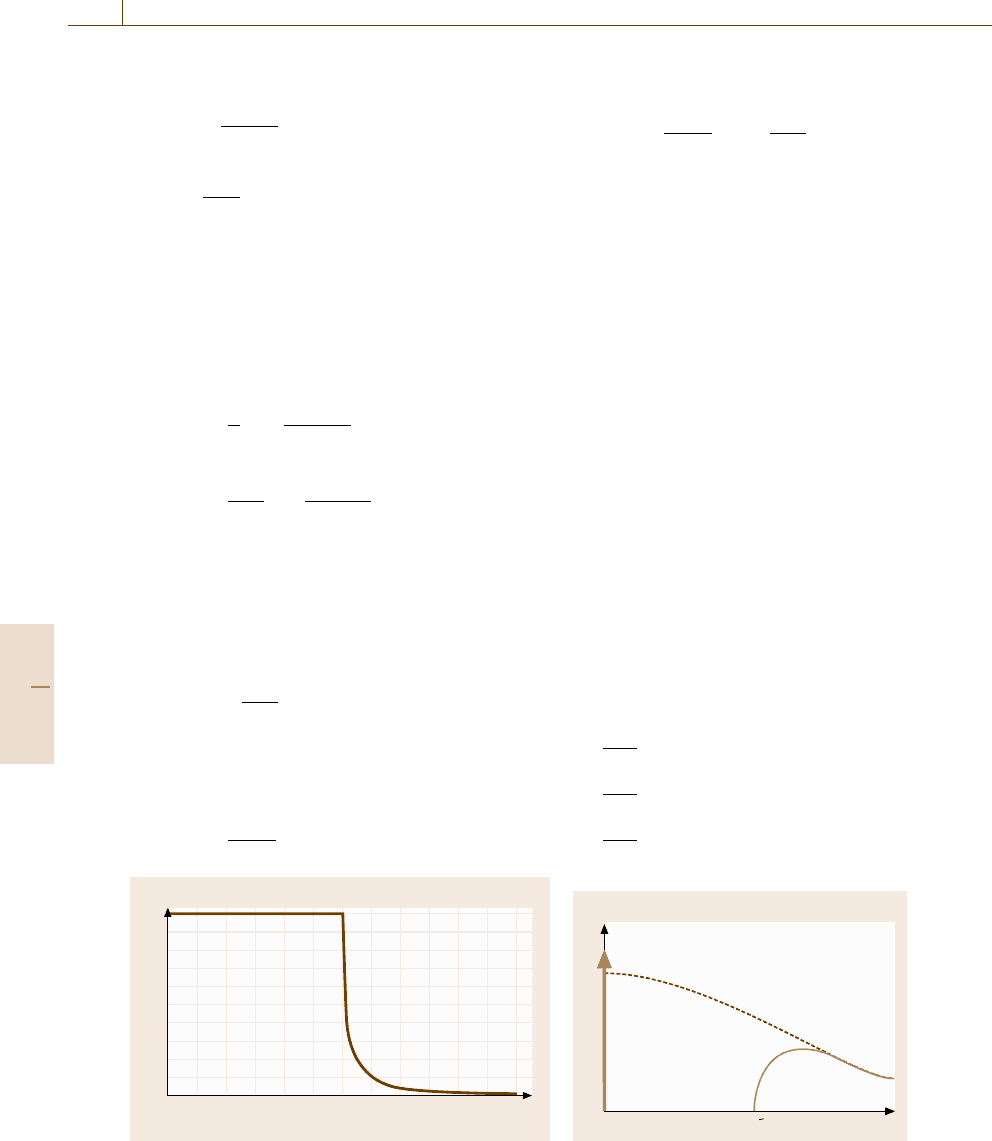
Fig. 11.9 The reflectivity of free electrons in the case of γ =
0
Finally, the optical conductivity of superfluid electrons
is given by
σ(ω) =
πn
S
e
2
m
δ(ω) −
n
S
e
2
iωm
. (11.43)
Superconductivity originates from the formation of
Cooper pairs. In the higher-frequency region above the
binding energy of the Cooper pair, σ
1
should be finite.
A schematic illustration of optical conductivity spec-
trum in superconductors is depicted in Fig. 11.10. Here
Δ is called the Bardeen–Cooper–Schrieffer (BCS)gap
parameter and 2Δ corresponds to the energy gap in
the superconductor [11.17]. Thus we can measure the
superconducting gap by optical spectroscopy in the in-
frared region.
11.1.5 Luminescence and Lasers
Materials emit light by spontaneous emission when elec-
trons in the excited states drop to a lower level. The
emitted light is called luminescence. Such materials with
excited electrons can amplify the incident light via stim-
ulated emission, which is utilized in lasers, an acronym
for light amplification by stimulated emission of radia-
tion.
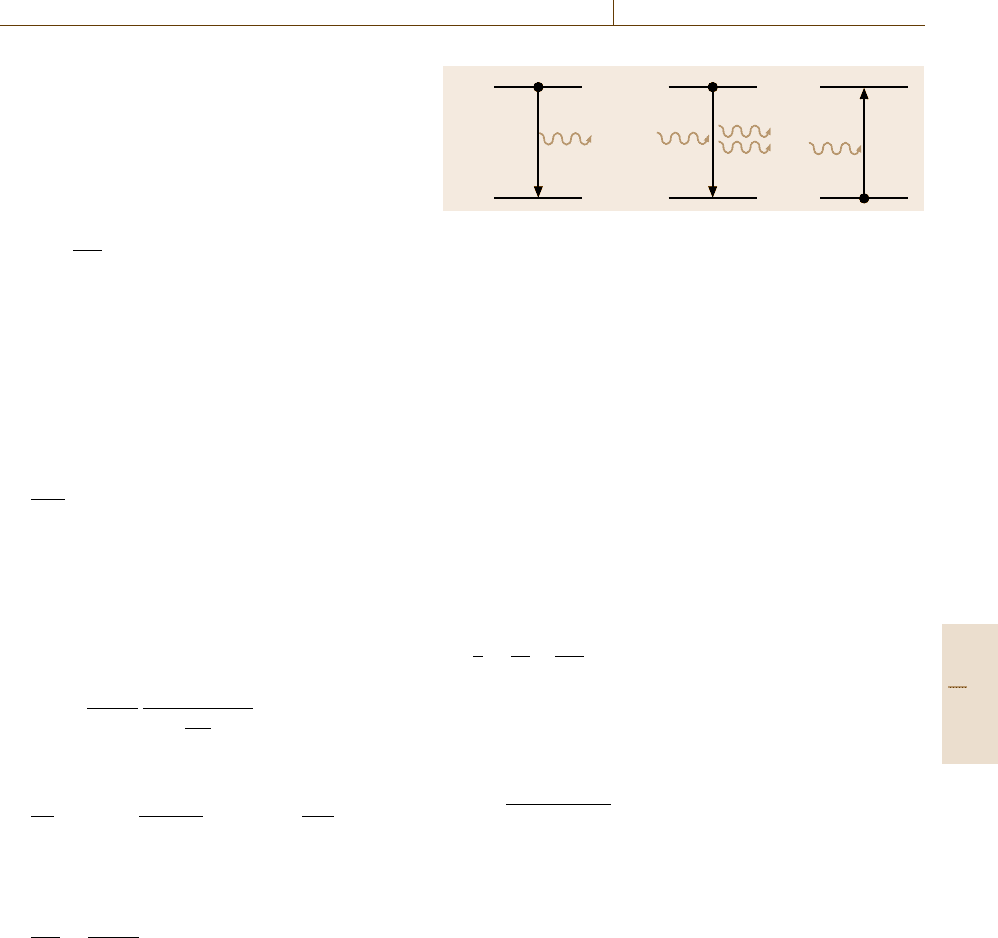
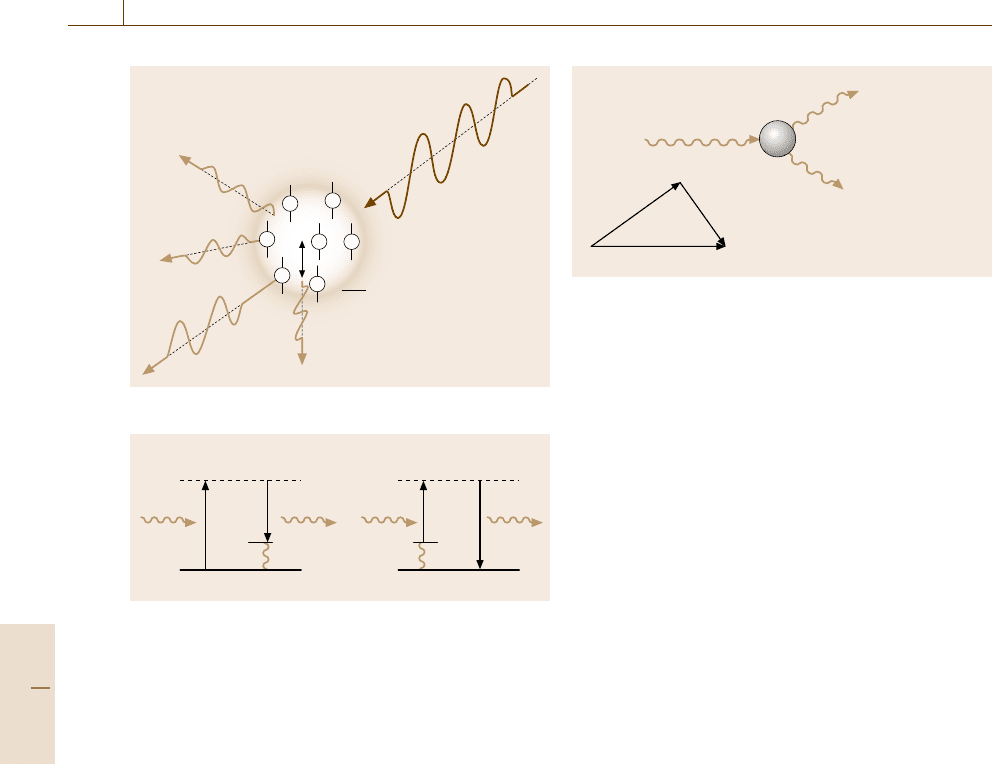
Emission and Absorption of Light
The processes of spontaneous emission, stimulated emis-
sion and absorption are illustrated in Fig. 11.11 in the
case of a two-level system.
The rate equations are as follows
dN
2
dt
=−A
21
N
2
, (11.44)
dN
2
dt
=−B
21
N
2
ρ(ν) , (11.45)
dN
1
dt
=−B
12
N
1
ρ(ν) , (11.46)
Re (σ)
0 ωΔ/h
πn
s
e
2
δ(ω)/m
Fig. 11.10 Optical conductivity of a normal metal (dashed
line) and a superconductor (solid line)
Part C 11.1
Optical Properties 11.1 Fundamentals of Optical Spectroscopy 599
where N
1
and N
2
are the populations of a ground state
|1 and an excited state |2, respectively, ρ(ν)isanen-
ergy density of the incident light, and A
21
, B
21
and B
12
are Einstein coefficients. The right-hand side of (11.44)
shows spontaneous emission (Fig. 11.11a) of a photon
with the energy hν = E
2
−E
1
. A radiative lifetime τ
R
of
the excited state is defined by
τ
R
=
1
A
21
. (11.47)
The right-hand side of (11.45) shows stimulated emis-
sion (Fig. 11.11b) from |2to |1. The rate is proportional
to the energy density at the resonant frequency ν. Equa-
tion (11.46) represents absorption (Fig. 11.11c) from |1
to |2. As seen in the derivation of Beer’s law, (11.1), the
rate of absorption is proportional to the energy density of
the incident light. Combining (11.44–11.46), we obtain
the rate equation
dN
2
dt
=−A
21
N
2
−B
21
N
2
ρ(ν) +B
12
N
1
ρ(ν) .
(11.48)
In the steady state, N
1
/dt = N
2
/dt =0, then
A
21
N
2
+B
21
N
2
ρ(ν) = B
12
N
1
ρ(ν) . (11.49)
In thermal equilibrium, the Planck distribution for cavity
radiation is
ρ(ν) =
8πhν
3
c
3
1
exp
hν
k
B
T
−1
, (11.50)
and the Boltzmann distribution between two levels is
N
2
N
1
=exp
−
E
2
−E
1
k
B
T
=exp
−
hν
k
B
T
.
(11.51)
From (11.49–11.51) we obtain the Einstein relations
A
21
B
21
=
8πhν
3
c
3
, (11.52)
B
21
= B
12
. (11.53)
Luminescence
Luminescence is categorized as follows
1. Photoluminescence (PL)
The reemission of light after absorbing an excitation
light. Details are described in this section.
2. Electroluminescence (EL)
The emission of light caused by an electric current
flowing through the material. This is utilized in op-
a) b) c)
E
2
E
1
E
2
E
1
E
2
E
1
hv = E
2
– E
1
Fig. 11.11a–c Transition processes in a two-level system: (a) sponta-
neous emission, (b) stimulated emission, and (c) absorption
toelectronic devices: the light emitting diode (LED)
and the laser diode (LD).
3. Cathodoluminescence (CL) The emission of light
due to irradiation by an electron beam. Details are
explained in Sect. 11.2.
4. Chemiluminescence
The emission of light caused by a chemical reaction.
Bioluminescence which originates in an organism
belongs to chemiluminescence.
The process involved in luminescence does not simply
correspond to the reverse process of absorption in con-
densed matter. Nonradiative processes, e.g. a phonon-
emission process, compete with the radiative process.
Hence the decay rate of an excited state 1/τ is described
by
1
τ
=
1
τ
R
+
1
τ
NR
, (11.54)
where the two terms on the right-hand side represent the
radiative and nonradiative decay rates, respectively. The
luminescence efficiency or quantum efficiency η is de-
fined by
η =
1/τ
R
1/τ
R
+1/τ
NR
. (11.55)
If the radiative lifetime τ
R
is faster than the nonradia-
tive lifetime τ
NR
, luminescence is a main de-excitation
process and luminescence spectroscopy is a powerful
method for the investigation of the excited state. Time-
resolved measurements introduced in Sect. 11.4.3 pro-
vide direct information on 1/τ
R
. In many cases, non-
radiative decay processes give rise to heating of the
material. Therefore, photocalorimetric or photoacoustic
spectroscopy is utilized to obtain the information on the
nonradiative decay processes [11.23].
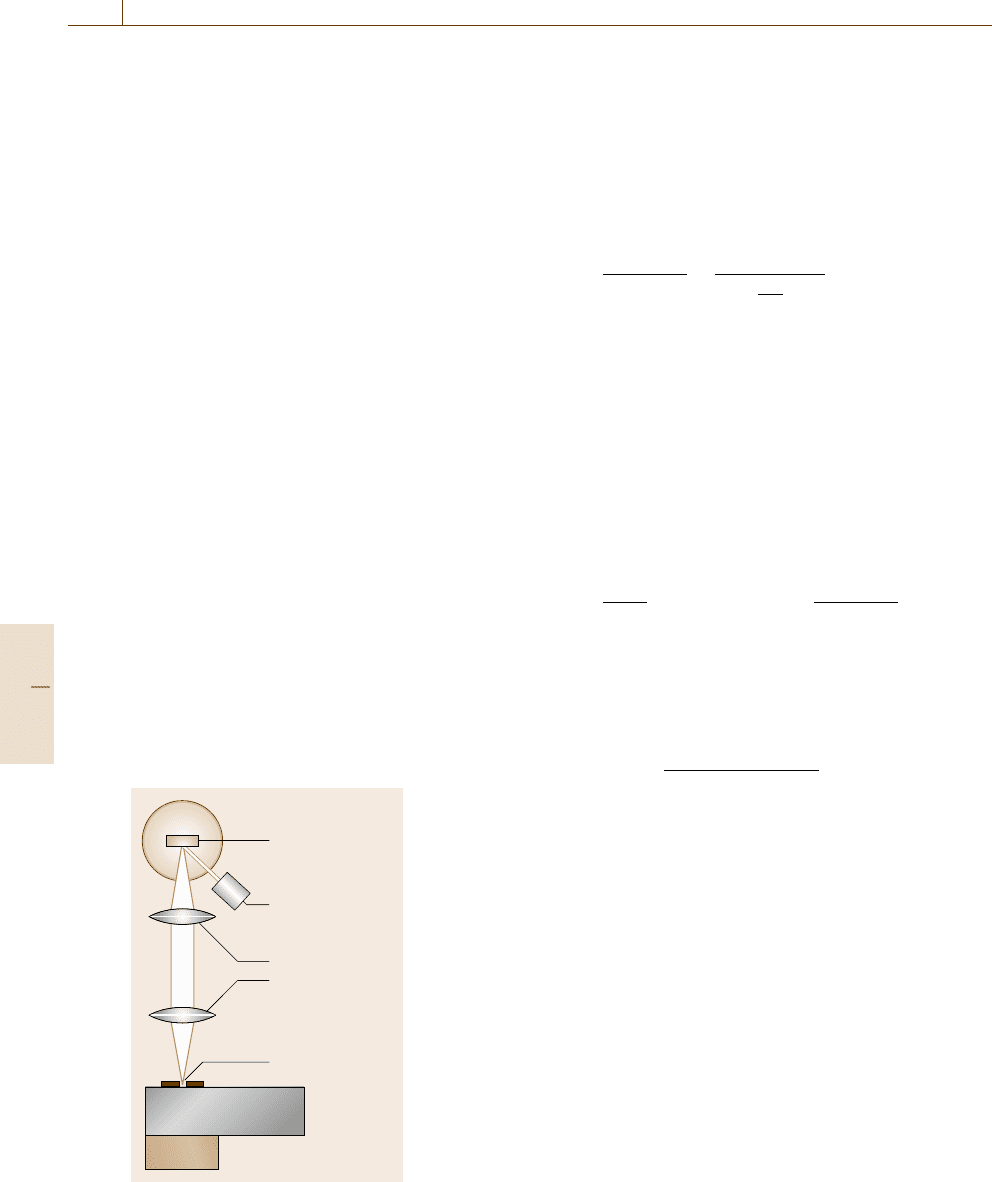
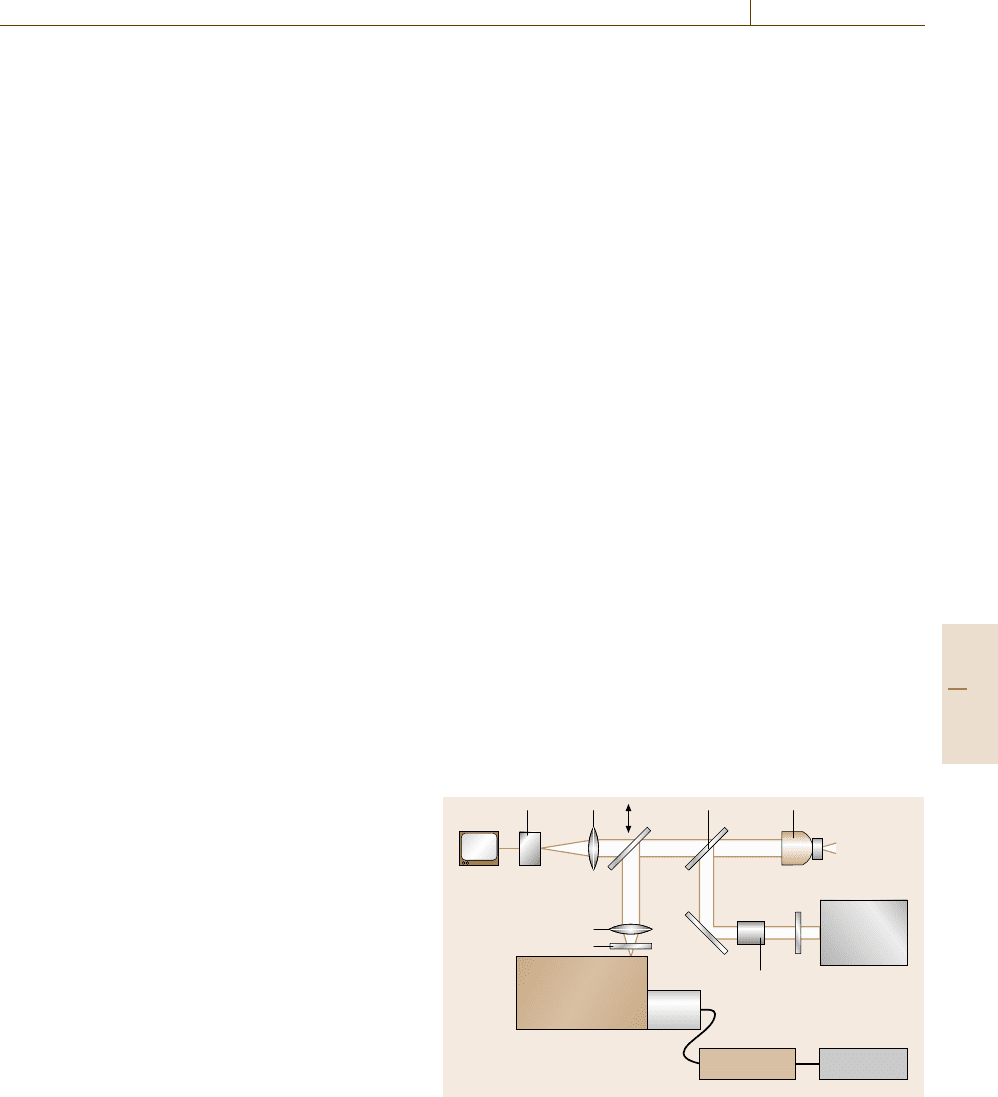
PL Spectroscopy
The experimental set-up for the PL measurement is
shown in Fig. 11.12. The sample is excited with a laser
or a lamp. The PL spectrum is obtained by using array
detectors, e.g. a CCD, or by scanning the wavelength
Part C 11.1
600 Part C Materials Properties Measurement
of the spectrometer with a PMT. The sample is usu-
ally mounted in a cryostat to cool it to liquid nitrogen
or helium temperatures, because the nonradiative pro-
cess is activated at higher temperature. Conversely, the
temperature dependence of PL gives information on the
nonradiative decay mechanism. The spectra obtained
should be corrected to take into account the sensitivity
of the detection system (the spectrometer and the CCD
or PMT), while this correction is not required in the case
of reflection and absorption measurements, in which the
response function of the detection system is canceled
in the calculation of I/I
0
(see (11.1)). Reabsorption ef-
fects should also be taken into account [11.22]ifthe
frequency region of the luminescence overlaps that of
the absorption. Time-resolved PL spectroscopy provides
the radiative decay time and direct information on the re-
laxation process in the excited states. The experimental
set-up will be reviewed in Sect. 11.4.3.
PL excitation spectroscopy (PLE) in which the de-
tection wavelength is fixed and the excitation wave-
length is scanned allows the absorption spectrum to be
measured in the case that direct transmission measure-
ments are impossible because of very weak absorption or
an opaque surface of the material. PLE spectroscopy is
similar to ordinary absorption measurements but is sub-
ject to the condition that there exists a relaxation channel
from the (higher) excited state to the emission state be-
ing monitored. Fluorescence line narrowing (FLN)or
luminescence line narrowing is a high-resolution spec-
troscopic technique that uses laser excitation to selected
specific subpopulations optically from the inhomoge-
neously broadened absorption band of the sample, as
Sample in cryostat
Light source
Collection
lenses
Entrance slit
PL
Spectrometer
CCD
Fig. 11.12 Exper-
imental setup for
PL measurement
showninFig.11.23a,b [11.24]. One can obtain the ho-
mogeneous width using FLN spectroscopy (Sect. 11.2).
Optical Gain
Laser action arises from stimulated emission, while
spontaneous emission prevents lasing. Using (11.44,
11.45, 11.52) the ratio between the rates of stimulated
emission and spontaneous emission is calculated as
N
2
B
21
ρ(ν)
N
2
A
21
=
1
exp
hν
k
B
T
−1
. (11.56)
This ratio is less than unity if T is positive. Hence a neg-
ative temperature is required for the lasing. From (11.51)
this negative temperature corresponds to N
2
> N
1
,which
is called population inversion.
If population inversion is realized, the incident light,
called seed light, is amplified by stimulated emission.
In the case that the seed light originates from the lumi-
nescence of the material itself, amplified spontaneous
emission (ASE) appears, as shown in Figure 11.13.
Optical gain is calculated using (11.45,11.46)asan
extension of Beer’s law (11.1)
dI(x)
dx
=(B
21
N
2
−B
12
N
1
)
g(ν)hνI(x)
c
, (11.57)
where g(ν) is a spectral function which describes the
frequency spectrum of the spontaneous emission. Then,
using the Einstein relation (11.52), we obtain
I(x) = I
0
exp[G(ν)x], (11.58)
G(ν) =
(N
2
−N
1
)A
21
c
2
g(ν)
8πν
2
, (11.59)
where I
0
and I are the input and output light intensities,
respectively. G(ν) is called the gain coefficient.
The population inversion can be obtained in the fol-
lowing ways
1. Optical pumping
This method is used in solid-state lasers (except LDs)
and dye lasers.
2. Electric discharge
Gas lasers and flash lamps which are used for the
optical pumping of solid state lasers, e.g. Nd:YAG
laser.
3. Electron beam
Large excimer lasers are pumped with a large-
volume electron beam.
4. Current injection
This method allows compact, robust and efficient
laser device (LDs).
Part C 11.1
Optical Properties 11.1 Fundamentals of Optical Spectroscopy 601
Spontaneous
emission
ASE
ASE
Stimulated emission
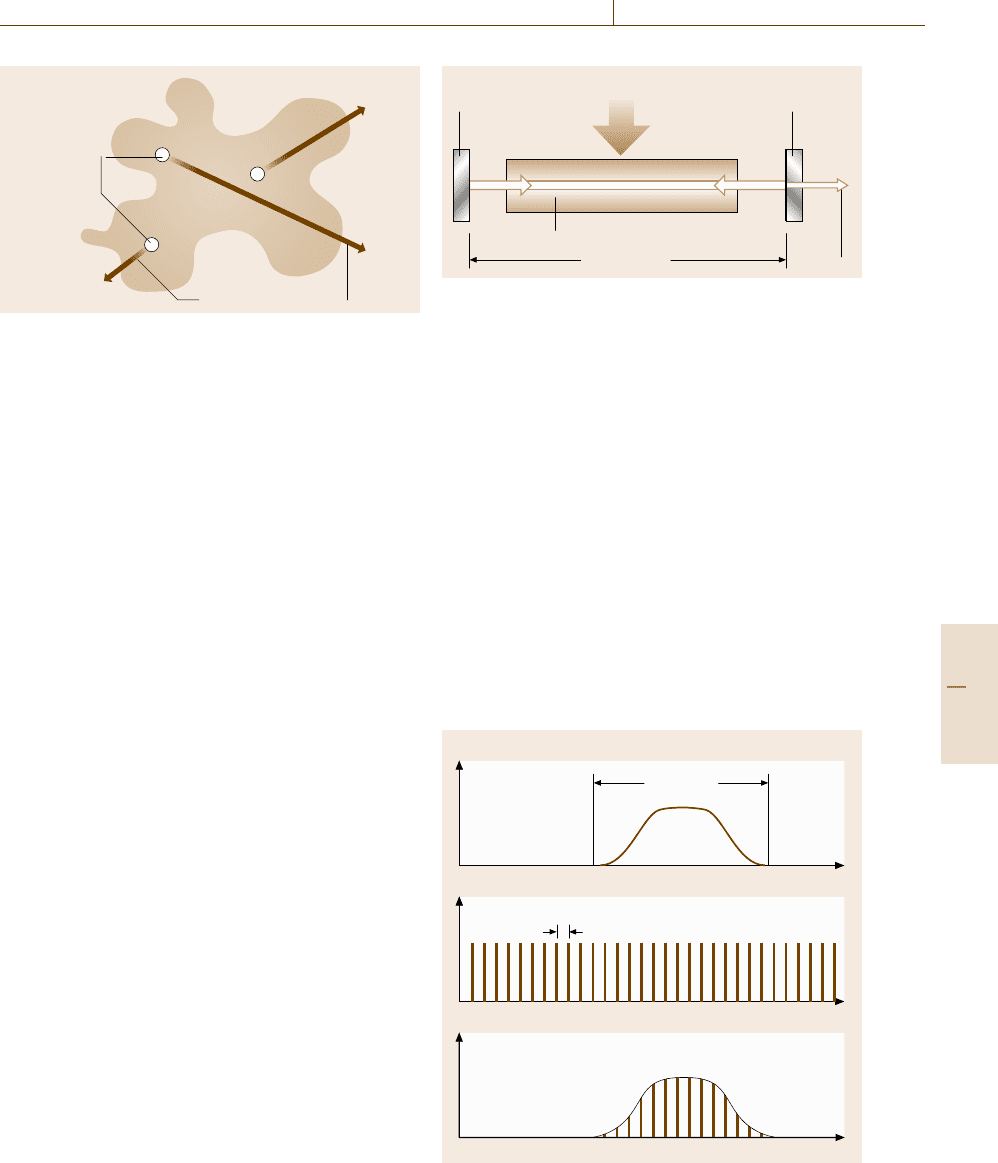
Fig. 11.13 Schematic illustration of amplified spontaneous
emission. The shaded area shows an excited volume where
population inversion is established
Laser Configuration
A combination of the population-inverted medium and
the optical cavity which gives optical feedback provides
the laser oscillation, which is like an electronic oscillator.
Thus the laser consists of a laser medium, a pump-
ing source and an optical cavity. Figure 11.14 shows
a schematic arrangement of a laser. ASE with the cor-
rect frequency and direction of propagation is reflected
back and forth through the laser medium. One of the
mirrors, called the output coupler, is partially transpar-
ent to extract the light within the cavity. The cavity acts
as a Fabry–Pérot resonator, so that the cavity modes are
formed inside the cavity. The mode separation is ex-
pressed by
Δν =c/2l, (11.60)
where l is a cavity length. We see lasing in the frequency
region in which the intensity is above the threshold,
asshowninFig.11.15. As seen in the figure, several
modes oscillate simultaneously, which is called multi-
mode operation. The random phases between these laser
modes may cause a chaotic behavior of the output power.
To avoid this effect, there are two solutions: single-
mode operation in which a single cavity mode is se-
lected by introducing another interferometer within the
cavity and mode-locked operation, which is introduced
in Sect. 11.4.2. The former operation achieves very nar-
row line widths down to 1 Hz.
Typical Lasers
Typical lasers are concisely summarized in the follow-
ing. The lasers are classified depending on the laser me-
dia: gas, liquid and solid. Solid-state lasers are catego-
rized into rare-earth metal lasers, transition-metal lasers
Energy input by pumping
Total
reflector
Partial
reflector
Amplifying medium
Laser cavity
Output
beam
Fig. 11.14 Schematic arrangement of a laser. The partial re-
flector corresponds to the output coupler
and semiconductor lasers (LD). There are two laser op-
eration modes: continuous wave (CW) and pulsed.
Gas lasers utilize atomic or molecular gases, as
showninTable11.3. Though they are fixed-wavelength
lasers in principle, multiple lines exist in molecular gas
lasers and tunable operation is possible in CO
2
lasers.
Excimer lasers utilize an excited diatomic molecule ex-
cimer, which is unstable in the ground state, and provide
high-intensity pulses at UV wavelengths.
Dye lasers provide tunable operation, because dyes
are organic molecules and have broad vibronic emission
bands due to interaction with the solvent. Figure 11.16
shows the tuning range of typical dye lasers.
Solid-state lasers with transition-metal ions, as sum-
marized in Table 11.4, also show broad emission bands
(except the ruby laser) caused by the strong interac-
Intensity
Intensity
Intensity
Frequency
Frequency
Frequency
Laser gain
bandwidth
Cavity longitudinal mode structure
Laser output spectrum
Δv = c/2l
Fig. 11.15 Schematic illustration of laser output spectrum
Part C 11.1

602 Part C Materials Properties Measurement
Table 11.3 Typical gas lasers
Laser media Oscillation wavelength (μm) Notes
He-Ne 0.6328, 1.15/1.52/3.39, 0.604/0.612, 0.594, 0.543 CW, used in metrology (length standard) and in optical align-
ment
He-Cd 0.636, 0.538, 0.442, 0.325 Typical CW laser in UV region
Cu (vapor) 0.511, 0.578 Pulse operation with 10 kHz repetition in visible region
Ar ion 0.275–1.09 (discrete), 0.515, 0.488 (typical lines) Typical CW laser in visible region
CO
2
9–11 (tunable), 10.6 CW or pulse operation, giant pulse in infrared region, used in
material processing
N
2
0.337 Compact pulsed laser
XeCl 0.308 Used in pumping for dye lasers
KrF 0.248 Highest power among excimer lasers
ArF 0.193 LSI fabrication
F
2
0.157 Commercially shortest wavelength
tion between 3d electrons and phonons, e.g. the Ti ion
in sapphire provides very wide tuning range shown
in Fig. 11.16 and are widely used, in particular, as ultra-
fast pulsed lasers (Sect. 11.4.2).
Solid-state lasers with rare-earth ions, as summa-
rized in Table 11.5, work as fixed-wavelength lasers
because of the narrow emission lines due to the weak
interaction between 4f ions and their environments.
They are pumped with flash lamps or LDs and, are
themselves used for the optical pumping of tunable
lasers.
Finally, semiconductor diode lasers, as summarized
in Fig. 11.17, are nowadays most widely applied in tiny
light sources for optical fiber communication, optical
recording of CDs, DVDs, MOs, etc. Current injection is
used for the laser pumping, which makes their combina-
tion with electronic circuitry feasible.
Tunable lasers
Cyanine
Xanthene
Coumarine
Stilbene
Dyes
Alexandrite
Cr:LiSAF
Cr:LiCAF
Ce:YLF
Cr:forsterite Th:YAG
Ti-sapphire
Yb:YAG, Yb:glass
SHG
300 500 700 900 1100 1300 1500 1700 1900
λ (nm)
Fig. 11.16 Tuning range of typical dye and solid-state lasers
11.1.6 Scattering
Scattering is the phenomenon in which the incident light
changes its wavevector or frequency. Scattering is called
elastic if the frequency is unchanged, or inelastic if the
frequency changes.
Elastic Scattering
This phenomenon occurs due to variation of the re-
fractive index of the material. The scattering can be
classified into two types depending on the size of the
variation a as follows [11.18]
1. Rayleigh scattering: in the case of a λ
The probability (cross section) of Rayleigh scatter-
ing is proportional to 1/λ
4
.
2. Mie scattering: in the case of a ≥λ
The size dependence of the probability of the
Mie scattering is not simple but is approximately
proportional to 1/λ
2
in the case of a ≈λ. This phe-
nomenon enables us to monitor the sizes of the
particles in the air or in transparent liquid.
Inelastic Scattering
This phenomenon occurs due to fluctuation of the elec-
tric susceptibility of electrons or lattices in a material.
The electric field E of the incident light and the polar-
ization P of the material are described by (Sect. 11.1.4)
E = E
0
cos ωt ; P = P
0
cos ωt . (11.61)
If the fluctuation of the electric susceptibility can be
written by
χ = χ
0
+χ
Q cos Ωt , (11.62)
Part C 11.1
Optical Properties 11.1 Fundamentals of Optical Spectroscopy 603
Table 11.4 Typical transition-metal-ion lasers
Laser media Oscillation wavelength (μm) Notes
Ruby (Cr:sapphire (Al
2
O
3
)) 0.6943 Pulse, the first laser invented in 1960
Ti:sapphire (Al
2
O
3
) 0.65–1.1 CW or pulse, ultrafast pulse generation (Sect. 11.4.2)
Alexandrite (Cr:BeAl
2
O
4
) 0.70–0.82 CW or pulse, removal of hair, tattoos, and visible leg veins
Cr:LiSAF (LiSrAlF
6
) 0.78–1.01 Pumped with LD, medical imaging and remote sensing
Cr:forsterite (Mg
2
SiO
4
) 1.13–1.35 Frequency-doubled range located at missing region covered
with Ti:sapphire laser
Table 11.5 Typical rare-earth-ion lasers
Laser media Oscillation wavelength (μm) Notes
Nd:YAG 1.064 CW or pulse, used in material processing.
SHG, THG and FHG are also used.
Nd:glass 1.062 (SiO
2
glass), 1.054 (PO glass) CW or pulse, very strong pulse operation
Nd:YLF 1.053, 1.047, 1.323, 1.321 CW or pulse, good thermal stability
Nd:YVO
4
1.065 CW, pump source for Ti:sapphire laser
Yb:YAG 1.03 CW, used in a disk laser
Er:glass 1.54 CW, fiber laser, optical communication
Ce:LiSAF 0.285–0.299 UV operation
Compound Laser media Oscillation wavelength (μm)
0.5 5 101
InGaN
AlGaAs
GaInAsP
AlGaInP
AlGaAsSb
InAsSbP
PbSnSeTe
PbS
CdZnSe
MgZnSSe
III–V
IV–VI
II–VI
Fig. 11.17 Typical laser diodes
the polarization of the material is described as
P = ε
0
χ E
0
cos ωt +ε
0
χ
E
0
Q cos Ωt cos ωt
=ε
0
χ E
0
cos ωt +
1
2
ε
0
χ
E
0
Q
× [cos(ω +Ω)t +cos(ω −Ω)t] . (11.63)
The first term corresponds to the Rayleigh scattering
and the second term means that new frequency com-
ponents with ω ±Ω, called Raman scattering, arises
from the fluctuation. The down- and upshifted compo-
nents are called the Stokes scattering and the anti-Stokes
scattering, respectively.
In the case of the Raman scattering due to phonons,
the Stokes (anti-Stokes) process corresponds to a phonon
emission (absorption), as shown in Fig. 11.19. The scat-
tering caused by acoustic phonons has a special name:
Brillouin scattering. The frequency shift with respect
to the incident light is called the Raman shift,andis
determined by the phonon energy. In other words, the en-
ergy of the phonons or other elemental excitations can
be obtained by Raman spectroscopy. Nowadays Raman
spectroscopy is indispensable for material science and is
applied to a huge number of materials [11.25].
Selection Rules for Raman Scattering
In the case of Raman or Brillouin scattering of phonons
in crystals, energy and momentum conservation rules
hold
ω
i
=ω
s
±Ω, (11.64)
k
i
=k
s
±K , (11.65)
where ω
i
and k
i
(ω
s
, k
s
) are the frequency and wavevec-
tor of the incident (scattered) photon and Ω and K are
those of the phonon. The plus sign corresponds to the
Stokes process, which is shown in Fig. 11.20 and the
minus sign corresponds to the anti-Stokes process.
If the incident light is in the optical region (from
IR to UV), the wavevector is negligibly small in com-
parison with the Brillouin zone of the crystal. Hence,
phonons with q ≈0 are usually observed in the Raman
scattering.
In a crystal with inversion symmetry, the phonon
modes which are observed in the Raman scattering,
called Raman-active modes, are not infrared active (not
Part C 11.1
604 Part C Materials Properties Measurement
+
–
–
+
+
–
+
Oscillating dipole
p
Incident photon
φ
1
Scattered photon
φ
s
= φ
1
± Ω
Fig. 11.18 Oscillator model for light scattering
Stokes process Anti-stokes process
E
e
E
g
E
e
E
g
ω
i
ΩΩ
ω
s
ω
s
= ω
i
– Ω
ω
s
= ω
i
+ Ω
ω
i
ω
s
Fig. 11.19 Energy-level diagram of the Raman processes.
Stokes and anti-Stokes processes are illustrated
observed in the infrared absorption), and vice versa.
Thisiscalledtherule of mutual exclusion [11.26].
In general, the coefficient χ
of the Raman scatter-
ing term in (11.62) is a tensor and is related to a Raman
tensor R, which is determined by the symmetry of the
crystal or molecule. The intensity of the Raman scatter-
ing I is proportional to
I ∝|e
i
Re
s
|, (11.66)
where e
i
and e
s
are the polarization vectors of the inci-
dent and scattered light, respectively. The configuration
for Raman spectroscopy is specified as k
i
(e
i
e
s
)k
s
and
the allowed combination of the polarizations are found
if the Raman tensor R is given. This is called the polar-
ization selection rule [11.26].
Electronic Raman Scattering
An electronic transition as well as a phonon is observed
in the Raman scattering. This is called electronic Ra-
Incident photon
(φ
i
, k
i
)
Scattered photon
(φ
s
, k
s
)
Phonon
(Ω, q)
k
s
k
i
q
Fig. 11.20 Schematics of the Stokes scattering process. The
wavevector conservation rule is also depicted
man scattering. This is a very useful probe for plasmons
in semiconductors, magnons in magnetic materials, or
in determining the superconducting gap and the sym-
metry of the order parameter of superconductors, in
particular, strongly correlated electron systems; a new
type of elementary excitation was found by this tech-
nique [11.27].
Resonant Raman Scattering
If the frequency of the incident light ω
i
approaches
the resonance of the material ω
0
, the scattering prob-
ability is enhanced and the process is called resonant
Raman scattering. In this case violation of the selection
rules and multiple-phonon scattering occur. In the just-
resonant case (ω
i
≈ω
0
), the discrimination between the
scattering, which is a coherent process, and the lumines-
cence, an incoherent process, is a delicate problem. The
time-resolved measurement of resonant Raman scatter-
ing reveals the problem and provides information on the
relaxation process of the material [11.28].
Experimental Set-up
The configuration for Raman spectroscopy is similar to
that used for luminescence spectroscopy, but a spec-
trometer with less stray light is required, because strong
incident laser or Rayleigh scattering is located near the
signal light. A double or triple spectrometer instead of
a single spectrometer is usually used in Fig. 11.12 to
reduce the stray light. An alternative method is to cut
the laser light with a very narrow-line sharp-cut fil-
ter placed just in front of the entrance slit of a single
spectrometer. This kind of filter is called a notch fil-
ter, which is a kind of dielectric multilayer interference
filter.
Part C 11.1
Optical Properties 11.2 Microspectroscopy 605
11.2 Microspectroscopy
In nanoscience and nanotechnology the optical spec-
troscopic study of the individual properties of nanos-
tructured semiconductor materials or biomolecules with
ultrahigh spatial resolution is useful. This is achieved
by avoiding the inhomogeneity caused by differences
in the size, shape or surrounding environment. This
kind of spectroscopy is called single-quantum-dot or
single-molecule spectroscopy. In this section, we will
introduce the principles and the application of three
kinds of microspectroscopic methods based on con-
ventional microscopy, near-field optical microscopy
and cathodoluminescence spectroscopy with the use of
scanning electron microscopy.
11.2.1 Optical Microscopy
Since light has a wave nature and suffers from diffrac-
tion, the spatial resolution of an optical microscope
cannot go below approximately a half of the optical
wavelength: the so-called diffraction limit. The typi-
cal set-up of microphotoluminescence spectroscopy is
illustrated in Fig. 11.21. A laser beam for the photoex-
citation source is focused on a sample surface with
a spot diameter of about 1 μm through an objective
lens with a high magnification factor. The luminescence
from the sample is collected by the same objective lens
and passed through an achromatic beam splitter to sep-
arate the luminescence from the scattered light of the
excitation laser, and the luminescence image is focused
onto a CCD camera or the luminescence spectrum is
analyzed through the combination of spectrometer and
intensified CCD camera.
The principle of single-quantum-dot or single-
molecule spectroscopy is illustrated in Fig. 11.22.For
example, the luminescence from the ensemble of quan-
tum dots of semiconductors having a size distribution
shows the inhomogeneous spectral broadening due to
the size-dependent luminescence peak energy, as shown
in Fig. 11.22a. If the spot size of the focused point is
comparable to the mean separation distance between
the quantum dots, the number of quantum dots de-
tected by the objective lens is limited and the sharp
luminescence lines with discrete photon energies are de-
tected, as shown in Fig. 11.22c. If the distribution of
the dots is dilute enough, one can detect a single dot,
as shown in Fig. 11.22b where the line width is limited
by intrinsic homogeneous broadening corresponding to
the inverse of the phase relaxation time of the excited
state.
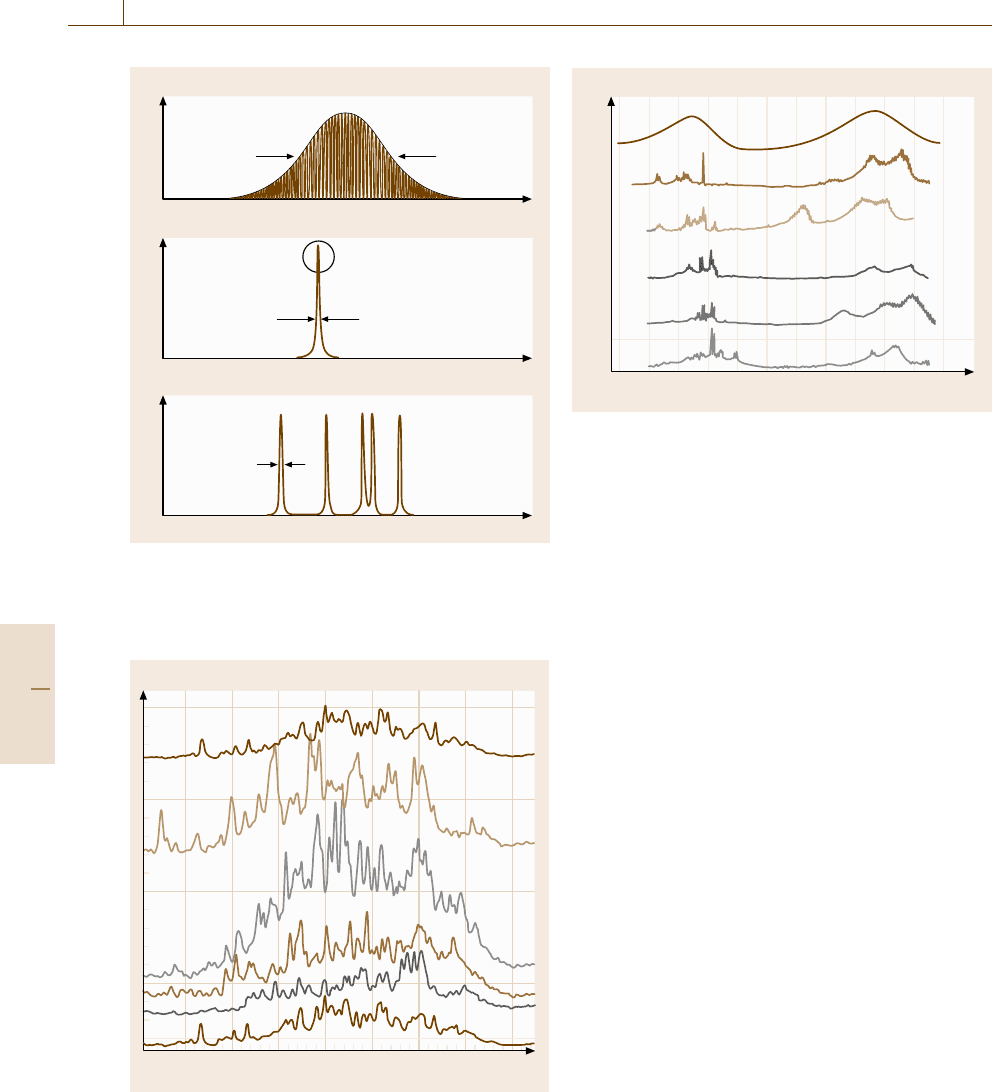
As an example of laser microphotoluminescence
spectroscopy, Fig. 11.23 shows the result of the ZnCdSe
quantum dots grown on a ZnSe substrate [11.29]. Al-
though the diameter of the quantum dots is 10 nm on
average and has a wide size distribution, the micropho-
toluminescence spectra show the spiky structures that
critically depend on the spot position of observation.
From the top to the bottom spectra, the spot position
is shifted successively by 10 μm distance. The bottom
spectrum is taken at the original position to check the
reproducibility, from which one notes that the change
in the spectra comes from fluctuation not in time but in
position.
As another example of single-molecule spec-
troscopy, Fig. 11.24 illustrates the microluminescence
excitation spectroscopy for light-harvesting complexes
LH2 acting as an effective light antenna in photosyn-
thetic purple bacteria at 2 K [11.30]. The complexes
contain two types of ring structure of bacterio-
chlorophyll molecules (BChl a) with 9 and 18 mol-
ecules stacked against each other. Since the 9- and
18-molecule rings have their absorption bands at 800
and 860 nm, respectively, the ensemble of LH2 com-
plexes, as illustrated in curve (a), shows two broad
peaks with inhomogeneous broadening caused by dif-
ferent surrounding environment. On the other hand,
when the complexes are dilutely dispersed in polyvinyl
acetate (PVA) polymer film, individual complexes
are found to show different spectra, as illustrated in
curves (b)–(f). Here sharp structures are found around
Sample
Monitor
CCD L2 M2 HM OL
Ti:sapphire
laser
HWPSHG
M1
L1
F
Spectrometer
ICCD
Controller Computer
Fig. 11.21 Experimental set-up of microphotoluminescence spec-
troscopy. HM – dichroic reflection mirror for excitation light; OL
– objective lens; HWP – half-wave plate; F – laser-blocking filter or
linear polarizer
Part C 11.2
606 Part C Materials Properties Measurement
a)
b)
c)
Luminescence intensity
Luminescence intensity
Luminescence intensity
Photon energy
Photon energy
Photon energy
Γ
inhomo
2Γ
homo
Γ
homo
Excitation laser
Fig. 11.22a–c Schematic drawing of luminescence spectra
for samples with inhomogeneous broadening observed by:
(a) broadband excitation, (b) site- or size-selective excita-
tion, and (c) single-molecule/particle spectroscopy
PL intensity (arb. units)
Position
Photon energy (eV)
7K
0
0
10
20
30
40
2.7 2.72 2.74 2.76
Fig. 11.23 Focussed position dependence of exciton lumi-
nescenceofZnCdSe quantumdotsobservedat 2 Kbymicro-
photoluminescence spectroscopy. The positions moved on
a straight line are given in units of μm (after [11.29])
0
200
cps
780 800 820 840 860 880
Fluorescence
Wavelength (nm)
(a)
(b)
(c)
(d)
(e)
(f)
Fig. 11.24 Comparison of fluorescence-excitation spectra
for an ensemble of LH2 complexes (a), and for several in-
dividual LH2 complexes (b–f) of photosynthetic bacteria at
1.2 K (after [11.30])
800 nm, while still broad structures around 860 nm. The
former result indicates the localization of photoexcita-
tion energy at one molecule, while the latter, indicates
delocalization over the ring.
11.2.2 Near-field Optical Microscopy
In order to realize the spatial resolution beyond the
diffraction limit, one can illuminate the sample with an
extremely close light source of evanescent wave having
large wavevectors produced from an aperture smaller
than the wavelength of light. Here, the lateral resolu-
tion is mainly limited by the aperture size of the light
source, if the distance between the light source and the
sample surface is much smaller than the wavelength
of light. Such a microscopy is called near-field optical
microscopy. A schematic diagram of near-field micro-
scope is illustrated in Fig. 11.25. One end of the optical
fiber is sharpened by melting or chemically etching and
used as a microprobe tip not only for the optical tips but
also for atomic-force tips. To avoid the leakage of the
light from the side of the tip end, the tip end is coated
with Al or Au. The distance of the probe tip end from
the surface of the sample is kept constant to within a few
tens of nanometers using the principle of the atomic-
force microscope (AFM). Laser light is sent through the
optical fiber and the light emitted from the ultra-small
aperture that illuminates the sample surface with a spot
size similar to the aperture size (illumination mode).
The transmitted or luminescent light from the sample is
Part C 11.2
Optical Properties 11.2 Microspectroscopy 607
collected by an objective lens and detected by a pho-
todetector such as photomultiplier. For luminescence
measurements a band-pass filter or a monochromator
is placed before the photodetector. In some case to
improve the spatial resolution the reflected or lumines-
cence light is again collected by the same probe tip
(illumination/collection mode). The lateral position of
the tip end or the sample is scanned on the X–Y plane
and the two-dimensional intensity image of the optical
response of the sample can be recorded together with
the topographical image of the sample surface. The min-
imum spatial resolution using the optical fiber tip end is
considered practically to be a few tens of nanometers.
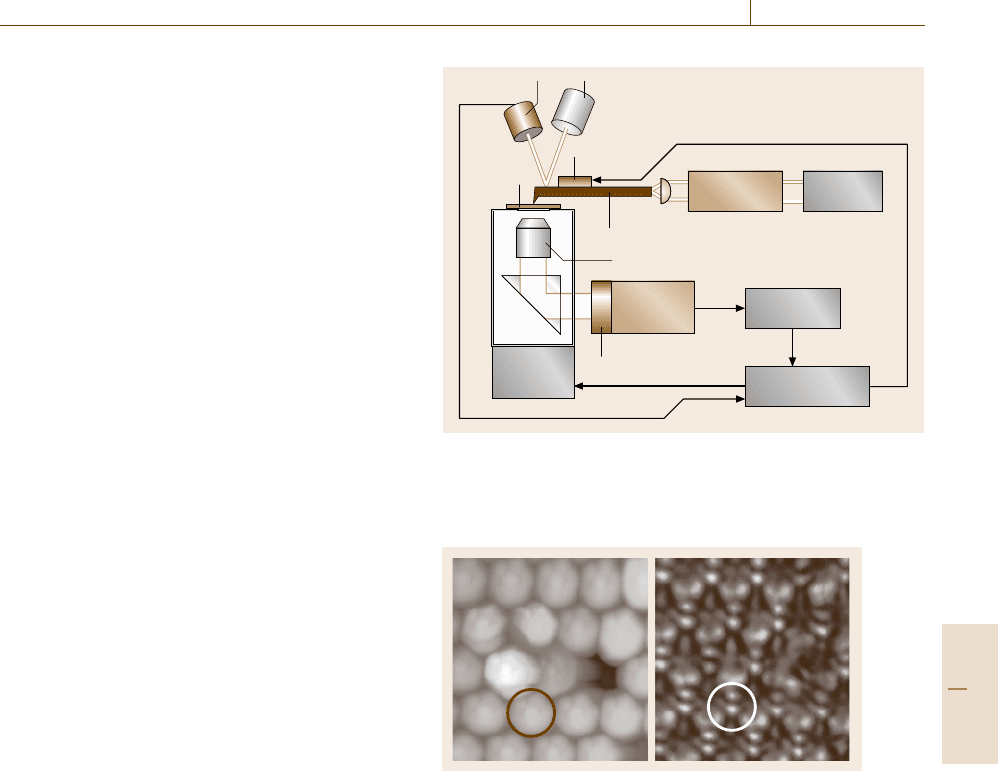
Figure 11.26 illustrates the example of images of
the double monolayer of a self-organized array of
polystyrene microparticles with a diameter of 1 μmon
a glass substrate [11.31]. Figure 11.26ashowstheAFM
image of the sample surface where the close packed
hexagonal array is observed. The near-field transmis-
sion image using light from a 514.5 nm Ar ion laser
is shown in Fig. 11.26b. Inside one microparticle indi-
cated by a white circle, one can see seven small bright
spots with a characteristic pattern. The spot size is about
150 nm, which is restricted by the aperture size. Since
the distance between these spots depends on the wave-
length of light, the pattern represents nanoscale field
distribution of a certain electromagnetic wave mode
standing inside the particle double layer.
Another example of monitoring the spatial distribu-
tion of the wave function of electronic excited states
is shown in Fig. 11.27 [11.32]. The near-field lumines-
cence images of confined excitons and biexcitons in
GaAs single quantum dots are observed using the il-
lumination/collection mode with a probe tip with an
aperture size of less than 50 nm. The size of the im-
age of the exciton is found to be larger than that of
the biexciton, reflecting the difference in effective sizes
for the translational motion of the electronically excited
quasi-particles.
11.2.3 Cathodoluminescence (SEM-CL)
Cathodoluminescence (CL) spectroscopy is one of
the techniques that can be used to obtain extremely
high spatial resolution beyond the optical diffrac-
tion limit. Cathodoluminescence refers to luminescence
from a substance excited by an electron beam, which
is usually measured by means of the system based on
a scanning electron microscope (SEM), as illustrated in
Fig. 11.28. The electron beam is emitted from an elec-
tron gun of the SEM, collected by electron lenses and
Photodiode Laser diode
Sample
Bimorph
A.O.
modulator
Ar ion
laser
Optical fiber probe
Objective N.A. = 0.4
Photo-
multiplier
Lock-in
amplifier
XYZ
scanner
Filter
AFM controller
Fig. 11.25 Schematic diagram of a scanning near-field optical mi-
croscope (SNOM) in illumination mode. Near-field light coming
out from a fiber probe illuminates a sample. Transmitted light is
collected by an objective lens and fed to a photomultiplier
a)
a) b)
Fig. 11.26a,b 4.5 μm×4.5 μm images of a double mono-
layer film of self-organized 1.0-mm polystyrene spherical
particles on a glass substrate: (a) AFM topographic image,
and (b) SNOM optical transmission image (after [11.31])
focused on a sample surface. The luminescence from
the sample is collected by an ellipsoidal mirror, passed
through an optical fiber and sent to a spectrometer
equipped with a CCD camera. Lateral resolutions less
than 10 nm are available in CL measurement, since the
de Broglie wavelength of electrons is much shorter than
light wavelengths. Moreover, energy- and wavelength-
dispersive x-ray spectroscopy can be carried out simul-
taneously due to the high energy excitation of the order
of keV. However, there are some difficulties in CL spec-
troscopy that are common to the observation of SEM
images. A tendency toward charge accumulation at the
irradiated spot requires that specimens have an elec-
Part C 11.2