Floud R., Johnson P. The Cambridge Economic History of Modern Britain, Volume 1: Industrialisation, 1700-1860
Подождите немного. Документ загружается.

The extractive industries 421
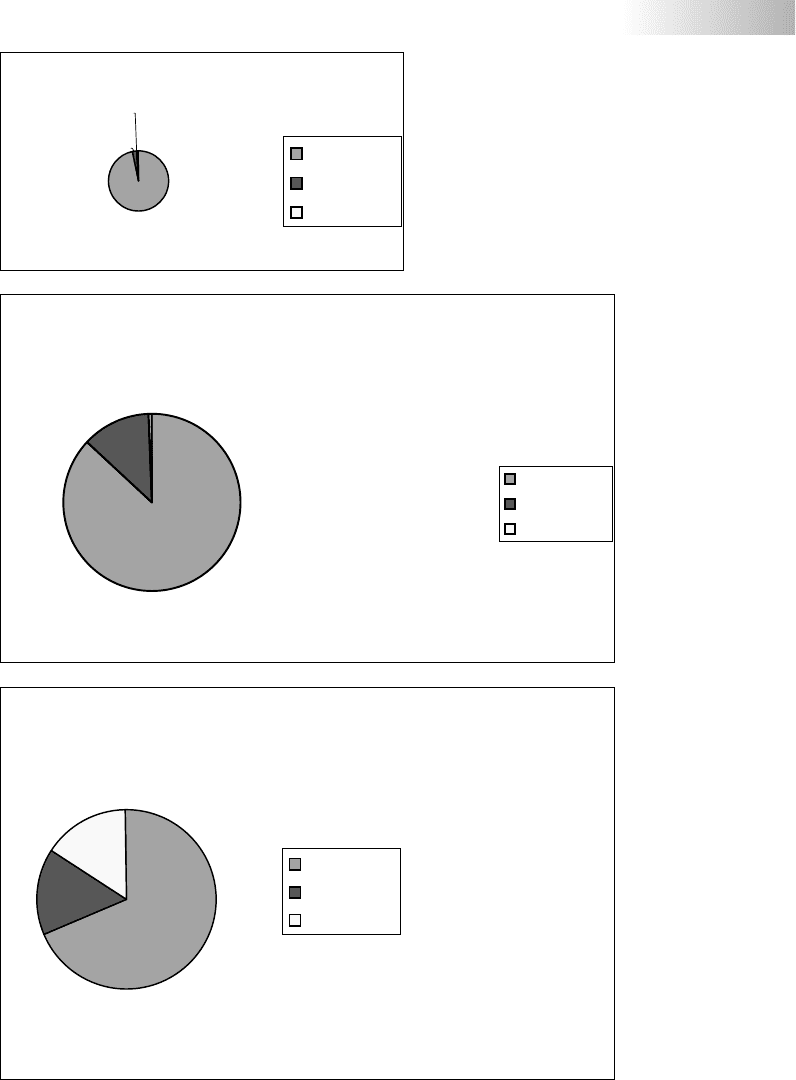
1700 million tons
3.5
0.075
0.045
coal
iron ore
non-ferrous
1857 million tons
65.4
9.4
0.355
coal
iron ore
non-ferrous
1857 million £
16.3
3.8
3.75
coal
iron ore
non-ferrous
Figure 15.1 Volume and value of mine output, 1720s and 1857
Source: Mineral Statistics 1858.
Cambridge Histories Online © Cambridge University Press, 2008

422 Roger Burt
Table 15.1 Estimated value of some construction and industrial
materials produced in England, Wales and parts of Scotland in 1858
Mineral Value £ Mineral Value £
Clay (pottery) 285,846 Fuller’s earth 13,500
Clay (brick)* 1,000,000 Sands 10,250
Building stone** 4,622,924 Raddle 10,000
Salt 750,000 Fluor spar 4,625
Coprolites 65,500 Rotten stone 750
Gypsum 17,750
Barytes 15,500 Total 6,796,645
Notes: *Clay estimated at one-third of the cost of the production of bricks and
tiles.
**Building stone includes slate and all limestone output.
Source: Mineral Statistics 1858, part II
Table 15.2 Men and women employed in coal and metal mining
in 1854
Coal Iron Copper Tin Lead
Males
England 147,070 9,414 17,234 12,879 14,499
Wales 37,314 10,278 97 None 5,982
Scotland 32,969 7,294 15 None 897
Females
All Areas 2,642 20 3,846 188 371
Total 219,995 27,006 21,192 13,037 21,749
Total number of men and women employed 302,979
Source: Mineral Statistics 1856.
smelting around 1710, and that the
domestic demand for bar iron was
still largely supplied from abroad (Hyde
1977). Domestic iron production finally
took off from the 1760s (Riden 1977), and
by the1850s the position had changed
considerably. The regular collection of
national production data from the be-
ginning of that decade provides a much
clearer picture. The domination of coal
had been extended to around 87 per cent
by volume of output, with most of the re-
mainder now being made up by iron ore.
Coal’s lead was somewhat less by value
of product, accounting for around two-
thirds of total output, while iron and
non-ferrous ores divided the other third
almost equally. These relative shares re-
flect the much higher values of metal-
lic ores, particularly those of non-ferrous
mines, which were for concentrates and
not ‘run of mine’ production, as was usu-
ally the case with coal and iron. Taking
theperiod 1700–1850 as a whole, the vol-
ume of coal output probably increased
twenty-three times and that of iron by
over 140 times, while non-ferrous ore
production expanded by only six or seven
times (see Figure 15.1).
No regular statistics of output for construction and industrial minerals
were collected before the end of the nineteenth century, but a survey of
3,000 quarries in 1858 produced some indicative figures of its size and
importance at that time (see Table 15.1). Those conducting the survey
thought that these figures considerably understated the real value of
output from this sector, however, and it might be better estimated at
being around £10 million annually. This would have been roughly equal
to one-third of that of metalliferous minerals and coal production.
By 1857 the total annual value of the output of the extractive sector,
including construction and industrial minerals, was probably around £40
million a year. This was equivalent to more than 6 per cent of GNP and
compares with 18 per cent of GNP derived from agriculture, forestry and
fishing, the other main natural resources sector. Total employment in
mining and quarrying at that time was probably well over 400,000, which
compares with roughly 1.8 million in agriculture, forestry and fishing.
There is no detailed breakdown of employment in mining and quarrying
forthat year, but the distribution in 1854 is shown in Table 15.2. It is
Cambridge Histories Online © Cambridge University Press, 2008

The extractive industries 423
notable that female employment is undoubtedly much below the levels
seen before their exclusion from underground mining in the early 1840s.
DISTINGUISHING CHARACTERISTICS
Before looking at the causes and character of the expansion of the extrac-
tive sector, there are several qualifying issues that need to be considered –
issues that set this sector clearly apart from agriculture, manufacturing
and other forms of productive activity. First, and obviously, minerals can
be mined or quarried only where they are found. Certainly the main
centres of mineral production changed over time, with exhaustion, new
discovery, and infrastructural changes that eased access problems and
reduced costs, but at any one time the industry had to make the most
of what was available, where it was available. The product of the mines
could be, and was, often transported to other more suitable sites for
reduction or manufacture, but the mines and quarries themselves were
fixed in their location. By good chance, however, these sites were not often
seriously inconvenient in Britain. In that sense it enjoyed an important
advantage over many of its future industrial rivals. Minerals were widely
dispersed across the country: the two most in need of locational partner-
ing, coal and iron, were commonly found in close proximity; most mining
districts were reasonably well served by cheap water transport facilities
(rivers and coastal shipping and later canals); and few were remote from
emergent urban manufacturing centres. Nowhere in Britain were there
important constraints imposed upon industrial expansion and economic
development by severe shortages, or excessively high prices, of mineral
raw materials.
Every aspect of the extractive process – technically, organisationally
and financially – was heavily influenced by the geological conditions un-
der which minerals were found. Coal mining, for example, was concerned
with the removal of a relatively plentiful and cheap soft material from
largely horizontally structured sedimentary rocks, frequently containing
highly explosive methane gas. It required large numbers of men with
limited skills, effectively ‘quarrying’ the coal by manually ‘picking’ from
the face, and posed an ever present danger of explosion – disastrous both
forthe consequent loss of life and the physical damage it would inflict
on the mine. The need to control ventilation in mines and to move large
quantities of material from working areas to the shaft bottom, created
opportunities for the employment underground of large numbers of un-
skilled women and children. By contrast, metal mines, particularly non-
ferrous mines, usually worked relatively small, vertical veins of valuable
ore in hard rock with little or no risk of gas explosions. They employed
comparatively small numbers of skilled men to drill, blast and follow
thelode. The work presented innumerable personal hazards, but rarely
resulted in mass disaster or serious disruption to mining operations.
Cambridge Histories Online © Cambridge University Press, 2008

424 Roger Burt
Table 15.3 Causes of death among 10,000 males over 15 years old, 1860–2
Cause of death All English occupations Cornish metal miners Durham coal miners S. Wales coal miners
Lung disease 2,866 5,596 1,958 3,037
Accident 532 782 1,312 2,158
Source: Kinnaird Commission 1864 (ii).
Ventilation problems were much less prevalent than in coal mines and
the volumes of material to be drawn to the surface were much smaller.
This minimised the need for the employment of women and children
underground and they were used instead in various unskilled and semi-
skilled surface ‘dressing’ operations, where the ore drawn from the mine
wascrushed and concentrated before being sent for smelting. For much of
theperiod, labour contracts in non-ferrous mines tied families together –
men underground and wives and children at surface – in rewarding both
thevolume and the quality of the final dressed product delivered. By
thesecond quarter of the nineteenth century, however, mechanisation
wasbreaking down that relationship and dressing activity was passing
to male labour.
The unpleasant conditions of underground labour also meant that
miners, whatever their activity, suffered particularly deleterious effects
on their health and/or encountered exceptionally high risks of injury
and fatality (Burt and Kippen 2000). In coal mining these problems came
mainly from the effects of dust, gas and explosions, while in metal min-
ing they resulted from dust, blasting accidents and falling. In both cases,
differing geological conditions were largely responsible for differences in
their incidence between area (see Table 15.3).
The incidence of these hazards generally increased over the period as
mines became deeper and underground employment became more con-
tinuous. Effective regulation of the industry was unknown before the
1840s and was then concerned mainly with removing women and chil-
dren from underground employment. Attempts to reduce accidents by
technological improvements undoubtedly had some impact – e.g. the in-
troduction of the safety fuse for blasting from the 1830s – but in other
cases may simply have served to encourage more dangerous practices.
The safety lamp, for example, introduced around 1815 to prevent gas ex-
plosions in coal mines, never proved entirely reliable, encouraged the
working of less well ventilated galleries, and resulted in more lives being
lost in the eighteen years following its introduction than in the similar
period preceding it (Pohs 1995). To compensate for these dangers, min-
ers received a wage premium compared to other comparable labouring
groups but careful measurement of the differences is hampered by the
complex systems of employment used in mines (see below, pp. 434–6).
The differing geological conditions under which minerals were found
also helped to shape the organisational structures of the industry. Coal
Cambridge Histories Online © Cambridge University Press, 2008

The extractive industries 425
seams, usually predictable and often easily worked, were frequently
exploited by their owners on their own account during the eighteenth
century, while metalliferous deposits, more difficult to prove and very
variable in their quality and ease of working, were commonly leased to
independent companies of adventurers, as owners sought to spread the
risk of their exploitation. This method of working also became common
for coal mining in the early nineteenth century as costs and essential in-
vestment increased. The high financial risks associated with non-ferrous
mining made it a pioneer of extended partnership and, later, of joint-
stock forms of organisation, while its occasional bonanzas, and more
frequent failures, made those enterprises a notoriously speculative in-
vestment on the emergent London Stock Exchange (Burt 1972).
Mining and quarrying are inevitably exhaustive activities. They require
constant new inputs of skill, capital and entrepreneurial expertise sim-
ply to sustain output but will inevitably finally encounter diminishing re-
turns and rising marginal costs. The question is not if but when that point
will be reached. Well-planned forward investment in prospecting and de-
velopment will push the event into the future, or signal its approach,
but cannot finally avoid it. The problem is compounded by the fact that
thepoint of ‘exhaustion’ is decided not by the physical removal of the
last piece of ore/coal/stone – that never happens – but by the economic
viability of the operation. It is estimated, for example, that no more than
20 per cent of the coal in situ in most British mines was worth removing
and that the remainder was left in the ground. Any sustained increase
in prices might have raised that percentage; any reduction, without a
comparable reduction in working costs, would have decreased it. Simi-
larly, any long-term increase in market prices might create opportunities
forreopening abandoned workings if marginal cost could be held con-
stant at earlier levels. Investment decisions had to be made in the context
of complex geological and market predictions that, during this period,
were particularly difficult to estimate. Geological science was still in its
infancy (Porter 1977) and the systematic geological mapping of Britain
not begun until the 1840s (Torrens 2002). The Kent coalfield was discov-
ered by broad observation of the geological structures of South Wales,
Somerset, northern France and Belgium, but the more detailed processes
of mineralisation were so little understood that industry practitioners
continued to take the view that ‘only by cutting the ground will the
ore be found’ (Hunt 1887: 189). All of these problems were further com-
pounded by considerable variations in the quality and ‘workability’ of
mineral ‘in sight’. Similarly, the productivity of capital and labour varied
widely between and within mines, even given the same quality of inputs.
At any point, in any mine, marginal workings could be identified, and
these could be taken in and out of production as price levels changed. It
wasaquestion not necessarily of opening and shutting particular mines,
but of varying production between different parts of a mine (Burt 1984).
Cambridge Histories Online © Cambridge University Press, 2008

426 Roger Burt
A combination of the last two factors makes it particularly difficult
to calculate overall levels of capital investment in mining. Purchases of
machinery and investments in buildings and surface ancillaries can be
identified as in any other branch of industry, but probably the largest
investments were in the creation of ‘underground structures’ – shafts,
adits, approach roads, etc. As extraction took place and deposits were
worked out, there was a continuing need for additional investment in de-
velopment work simply to maintain production. If that investment failed
to reveal economically viable mining opportunities it was entirely lost
and non-recoverable. Equally, working expenditures on current extraction
could reveal new deposits and facilitate future working, so effectively con-
tributing to the capital stock of the mine (Claughton 1994). Estimates of
total capital formation and capital/output ratios are thus highly specula-
tive. Schmitz reviewed these problems for the non-ferrous mining sector,
and made some tentative estimates of fixed capital formation in mines
in Devon and Cornwall between 1820 and 1860 (Schmitz 1978), but more
detailed national estimates have so far been confined only to the coal
industry. Limited source material was again a problem but Feinstein, Pol-
lard and Flinn have been able to suggest some general conclusions. Flinn’s
overall estimates of capital formation in coal mining between the mid-
eighteenth and the mid-nineteenth centuries suggest that annual totals
increased rapidly throughout the period, from around £100,000 annually
in the late 1760s to £2 million annually in the 1840s. He concluded that
themarginal productivity of that capital was improving and that in real
termsthe capital cost of mining was falling. More precise estimates were
intractable, but Flinn found broad agreement with Feinstein in accepting
a capital cost of around 4 shillings per ton of coal produced in the 1820s,
assuming a total fixed capital at that time of £6 million and an output of
approximately 30 million tons. This was slightly up on his own estimate
of a capital cost of 2 shillings 6d. a ton in the mid-eighteenth century
(Flinn 1984). Notwithstanding the large absolute investment in the coal
mines, Feinstein has concluded that gross domestic capital formation in
that industry in the eighteenth and early nineteenth centuries was small
in relative terms and never accounted for more than 1 or 2 per cent of
thenational total – a view also supported by Mitchell (1984) in his cal-
culations for the early nineteenth century (Feinstein 1978; Feinstein and
Pollard 1988).
Finally, the extractive industries established an early, and particularly
bleak, reputation for environmental pollution. Their extraction, process-
ing and consumption became, and have remained, the primary cause of
ecological damage in industrial economies everywhere. Although these
concerns have now become central to development planning in the in-
dustry, they attracted little national attention before the mid-nineteenth
century and the industry was subject to no general controls. It was not
Cambridge Histories Online © Cambridge University Press, 2008

The extractive industries 427
entirely without regulation however. From the medieval period, custom-
ary law in the mining districts had prohibited the pollution of water-
courses (Gough 1931; Beare 1994) and people adversely affected were often
able to obtain restraining injunctions and/or compensation. From the late
seventeenth century, landowners and farmers in Derbyshire successfully
prosecuted miners for ‘bellanding’ – making pasture or rivers poisonous
to animals or people by discharging contaminated water – and from the
last quarter of the eighteenth century lead smelters across the country in-
vested large sums in long flue systems to protect themselves from similar
actions resulting from the fall out of poisonous fumes (Day and Tylecote
1991;Slack 2001). ‘Copper smoke’ caused similar problems by the pre-
cipitation of copper and arsenic particles but had the added hazard of
producing a highly toxic ‘rain’ of sulphurous and sulphuric acid. This was
particularly serious in and around Swansea, where copper smelting was
concentrated. Here, however, the strategic significance of the industry for
thelocal economy, and the political strength of the smelters, defeated
legal attempts to constrain the industry, and effective regulation was de-
layed until after the mid-nineteenth century (Newell 1997; R. Rees 2000).
Similarly, the ravages of hydrochloric acid rain, resulting from the use
of salt, pyrites, coal, chalk and limestone in the manufacture of alkalis
in south-east Lancashire and Tyneside, were partly compensated by di-
rect legal action but were not subjected to general regulation until 1863
(Dingle 1982). Whatever the level of these relatively localised problems,
however, they were as nothing compared to the air pollution resulting
from the smelting of iron. In 1845, for example, just one large iron com-
pany with works in Brecon and Monmouth was consuming more than a
quarter of a million tons of coal a year in its furnaces and the steam en-
gines used to blast them. Iron and smoke were inevitably in joint supply
(Clapp 1994). The consequences of this for the urban environment – in the
form of smog and acid rain – have been much discussed but its effects
on the rural economy remain underresearched. Together with rapidly
spreading waste tips from mining, quarrying and smelting, it reduced
theproductive capacity of agriculture by thousands of acres per year, off-
setting gains made in that sector by land reclamation and improvement,
and diminishing overall levels of output and productivity.
MARKETS AND PRICES
As has been seen, the production of all minerals increased considerably
during this period. That expansion was led by a widening and deepening
of demand: widening by finding new markets for minerals already in com-
mercial production and new uses for previously discarded by-products;
and deepening by increasing the consumption of existing users. To some
Cambridge Histories Online © Cambridge University Press, 2008

428 Roger Burt
degree, the extractive industries provided their own markets by ‘feed-
ing’ on each other. More ferrous and non-ferrous ores needed more coal
to smelt and refine them; more furnaces needed more refractory bricks
and fluxes to line and operate them; more mines and miners needed
more engines and hand tools to operate them. But more important was
theexpansion of the wider manufacturing economy and its related ur-
ban and transport structures. Thus an increasing range of heat-using
technologies – for furnaces, kilns, boilers, ovens and stills – and the substi-
tution of steam technology for traditional water and muscle power, raised
thedemand for coal (Mugridge 2001). The adoption of ‘copper bottoming’
of ships in the tropical trades, to protect against worm and fouling, al-
most invented a demand for rolled copper sheet, while the development
of canning greatly increased the consumption of both iron and tin in
theproduction of tinplate (Minchinton 1957). Above all, however, the ex-
pansion and urbanisation of the population increased the demand for
stone, bricks and mortar for building, lead for roofing and piping, glass
forwindows, copper and pewter for utensils, pottery for serving and stor-
ing food (Rowe 1983). In 1836 the discovery of the method of ‘galvanising’
sheet iron with zinc created an entirely new product and demand as it
became the definitive construction material of European expansion and
empire during the later nineteenth century (Cocks and Walters 1968).
Throughout the period, the consumption of the domestic economy
wassignificantly supplemented by overseas demand. Britain had a long
history of exporting minerals in semi-manufactured form – e.g. as tin
ingots or pig lead – and many of these trades also blossomed. Exports of
nearly all minerals increased and for some, overseas markets became the
principal source of demand. The growth was seen most spectacularly for
copper. This industry had been in its infancy in Britain at the beginning
of the eighteenth century but evolved a smelting sector that became a
world technological leader by the late eighteenth century, and started
to attract complex ores for smelting from mines across the world. The
copper smelted from these imported ores was not differentiated from
that derived from domestic ores in total export figures but supported an
overall level of overseas trade which, by the mid-nineteenth century, was
considerably greater than the entire domestic output. The other main
non-ferrous metals, tin and lead, were more soundly established than
copper at the beginning of the eighteenth century and never developed
the samelarge-scale trade in processing imported ores. The absolute size
of their export markets increased over the period but they diminished
their share of total output from a massive half to three-quarters of total
production in the early eighteenth century to a still respectable third
in the mid-nineteenth century. In tonnage terms, all three metals were
dwarfed by coal exports, which grew rapidly in their share of domestic
output during the early nineteenth century and stood at over 10 per cent
of the total by the early 1860s. Iron performed somewhat like copper
Cambridge Histories Online © Cambridge University Press, 2008

The extractive industries 429
Table 15.4 Mineral exports as a percentage of domestic annual production
Exports as %
Exports (tons) Domestic production (tons) domestic Production
Copper
1700–9 Av. Minimal 0
1855–9 Av. 22,220 18,660 119
Tin
1700–9 Av. 1,100 1,410 78
1855–9 Av. 2,100 6,560 32
Lead
1700–9 Av. 11,840 25,000 (est.) 47
1855–9 Av. 20,120 67,500 30
Coal
1700–9 Av. 57,700 3,000,000 (est.) 2
1855–9 Av. 5,980,000 66,700,000 9
Iron
1715–20 Av. 2,305 23,000 (est.) 10
1855–9 Av. 350,000 3,520,000 10
Source: Mitchell and Deane 1962.
in the early eighteenth century, with low levels of output and minimal
exports. However, both grew rapidly during the remainder of the period
and by the 1850s the relative importance of foreign markets was on a par
with the coal industry (see Table 15.4).
Several industrial and construction materials – such as clays and
stone – were traded abroad in increasing quantities, and relatively ‘new’
products such as arsenic began to find major overseas markets from the
mid-nineteenth century (Burt 1988). Detailed trade statistics for these
products do not appear to have been kept.
So great was the dependence of non-ferrous metal producers on over-
seas markets that any constriction or interruption to trade could have a
profound influence on market prices. Thus war with major trading part-
ners, embargoes, variations in tariffs (some were subject to export as well
as import duties), and even prolonged periods of bad weather could cause
serious overstocking of the domestic market and cutbacks in activity (Burt
1984). This vulnerability drove the industry constantly to explore new
markets and attempt to find ways of redirecting trade throughout the
eighteenth and early nineteenth centuries. Different products looked in
different directions. Thus, in 1790, while coal, lead and to a lesser ex-
tent copper found most customers in Europe, tin looked strongly to the
Far East and Africa and almost half of all trade in iron was with the
United States and the British West Indies (see Table 15.5). It was only dur-
ing and after the Napoleonic Wars that these patterns began to change,
with a general redirection of trade away from Europe, the emergence
Cambridge Histories Online © Cambridge University Press, 2008

430 Roger Burt
Table 15.5 The geographical distribution of mineral exports,
1790 (%)
Europe Far East/Africa US/Brit. W. Indies
Copper 61 23 14
Tin 54 44 −
Lead 80 11 7
Coal 98 − 1
Wrought iron 27 18 49
Source: Schumpeter 1960.
of alternative domestic sources of sup-
ply there and increasing levels of activity
elsewhere. Thus by the 1850s over 20 per
cent of the overseas coal trade was to
Africa, the Americas, Asia and Australa-
sia (Church et al. 1986), and rapidly
growing lead exports were being driven
by new markets in Asia, the Americas
and Russia, relegating Europe to second
place.
Imports of foreign unprocessed minerals had no significant effect on
the British market for most of this period. Coal and stone were never im-
ported in any quantity and initial early eighteenth-century dependency
on copper and ‘battery’ imports dwindled to insignificant levels after the
1720s and remained there until the rapid rise of copper ore imports from
thelate 1830s. Even then, it was not until the 1860s that imported copper
began to have any serious effect on domestic market prices and the prof-
itability of the copper producers. Small quantities of metallic tin were
imported from Malaysia throughout the period but most of it was re-
exported until the early 1840s. Thereafter imports increased steadily, but
it was not until the last quarter of the nineteenth century that they also
began seriously to depress domestic ore prices and production. Similarly,
imports of lead ore and metal remained small and insignificant in terms
of the domestic market until the mid-nineteenth century, when they be-
gantomovesharply upwards. Iron was somewhat different. In the early
eighteenth century over a third of the British market may have been
supplied with foreign iron, and imports increased through to the 1760s
and remained fairly steady thereafter. However, much of this was special-
ist high-quality wrought iron and it accounted for a rapidly shrinking
share of the total market as domestic iron production and consumption
exploded into life from the mid-eighteenth century. By the end of the
Napoleonic Wars, imports of foreign iron were quantitatively insignifi-
cant, and continued only for the small-scale manufacture of very highly
specialised products.
The great expansion of markets at home and abroad, and the van-
quishing of foreign competition, was all achieved without a significant
sustained reduction in real market prices. Flinn has shown how coal
prices at the pit head increased slightly in real terms over this period
while those of most non-ferrous metals maintained a rough long-term
parity with changes in producer goods price indices. Only iron experi-
enced a significant secular decline, and that from the early nineteenth
century (see Table 15.6).
Certainly there were shorter-term fluctuations, but they appear to have
followed no particular pattern, reflecting a wide range of influences in
themarket. Surprisingly, the price movements of coal and metals in the
Cambridge Histories Online © Cambridge University Press, 2008