Gasch R., Twele J. (Eds.) Wind Power Plants: Fundamentals, Design, Construction and Operation
Подождите немного. Документ загружается.

512 15.2 Erection and operation of wind turbines
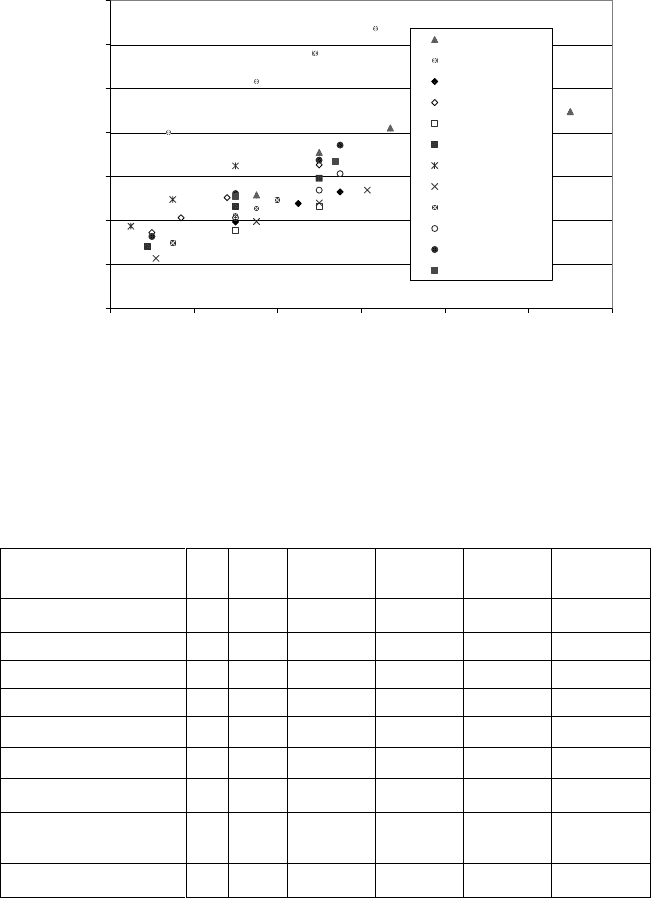
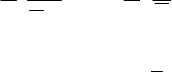
specific annual reference energy yield calculated for the reference site conditions
specified in the German Renewable Energy Sources Act. The wind turbines have
different rotor diameters; therefore the area-specific yield is given. Therefore, for
turbines belonging to the same family, e.g. REpower MM70, MM82 and MM92,
the one with the smallest rotor has the highest area-specific yield for the same hub
height (e.g. 80 m).
700
800
900
1000
1100
1200
1300
1400
50 70 90 110 130 150 170
Hub height h
hub
in m
Area-specific annual reference energy yield in
kWh/m²
FL2500, 2,5 MW
E70, 2,3 MW
V90, 2,0 MW
V80 2,0 MW
MM92, 2,0 MW
MM82, 2,0 MW
MM70, 2,0 MW
MD77, 1,5 MW
MD70, 1,5 MW
N90 2,3 MW
N80, 2,5 MW
NM92, 2,75 MW
Fig. 15-18 Area-specific annual reference energy yield of wind turbines with a rated power
between 1.5 and 2.5 MW (2006). Reference site conditions specified in the German Renewable
Energy souces Act (EEG): Annual mean wind speed of 5.5 m/s at 30 m height, Rayleigh
frequency distribution of the wind regime (k = 2) and roughness length z
0
= 0.1 m.
Table 15.7 Comparison of wind turbines of the 600 kW class [3]
WKA
Ecotecnia
44
Enercon
E-40
REpower
48/600
Vestas
V47/660
Rated power P
N
kW 640 600 600 660
Power limitation - stall pitch stall pitch
Rotor diameter D m 44.0 44.0 48.4 47.0
Hub height H m 65 65 65 65
Rotor swept area A m² 1,520.5 1,520.5 1,839.8 1,734.9
Area-specific power W/m² 420.9 394.6 326.1 380.4
Rated wind speed v
N
m/s 14.0 12.5 13.0 15.0
Design wind speed
v
opt
= v (c
P.WKA.max
) m/s 8.0 9.5 7.5 8.0
v
N
/v
opt
- 1.75 1.32 1.73 1.88
15 Planning, operation and economics of wind farm projects 513
0
100
200
300
400
500
600
700
0 2 4 6 8 101214161820
Mean wind speed v in m/s
Power P in kW
Ecotecnia
Enercon
REpower
Vestas
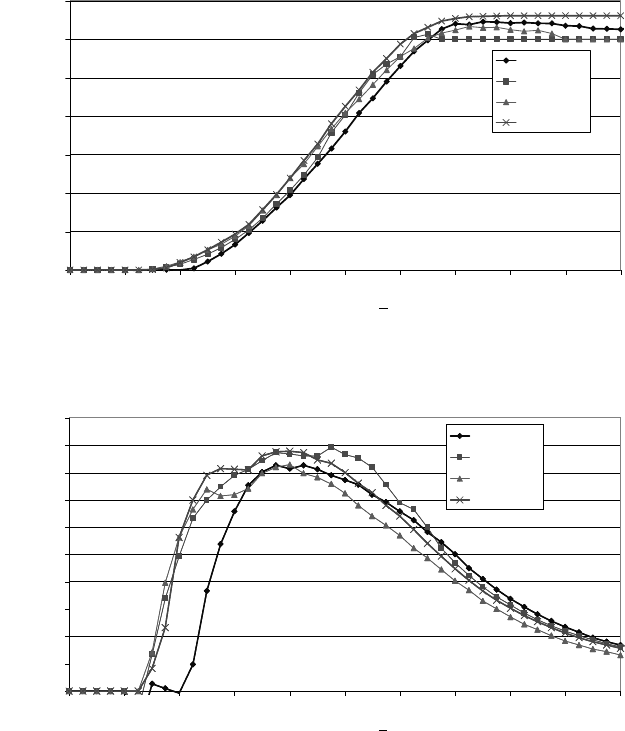
Fig. 15-19 Power curves of four wind turbines of the 600 kW class
0,00
0,05
0,10
0,15
0,20
0,25
0,30
0,35
0,40
0,45
0,50
0 2 4 6 8 101214161820
Mean wind speed v in m/s
Power coefficient c
P.WT
Ecotecnia
Enercon
REpower
Vestas
c
P.WT
.
0.50
0.45
0.40
0.35
0.30
0.25
0.20
0.15
0.10
0.05
0.00
0,00
0,05
0,10
0,15
0,20
0,25
0,30
0,35
0,40
0,45
0,50
0 2 4 6 8 101214161820
Mean wind speed v in m/s
Power coefficient c
P.WT
Ecotecnia
Enercon
REpower
Vestas
c
P.WT
.
0.50
0.45
0.40
0.35
0.30
0.25
0.20
0.15
0.10
0.05
0.00
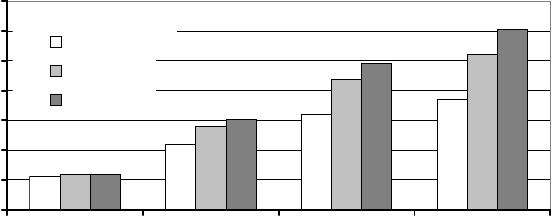
Fig. 15-20 Total power coefficient versus wind speed of four wind turbines of the 600 kW class
Moreover, the differences in the power curves of different wind turbines have a
significant effect on the annual production. This will be discussed below for four
wind turbines of the 600 kW class with the same hub height and the characteristic
data given in table 15.7 and for variation in the wind conditions. Figs. 15-19 and
15-20 show the power curves and the total power coefficient characteristics (elec-
trical power to wind power, i.e. including mechanical and electrical losses) of the
four wind turbines. The wind turbine Ecotecnia 44 is designed for sites with
stronger winds, therefore it shows the highest area-specific power of 421 W/m².
514 15.2 Erection and operation of wind turbines
With its large rotor diameter the wind turbine REpower 48/600 represents a design
for moderate wind speeds of inland sites.
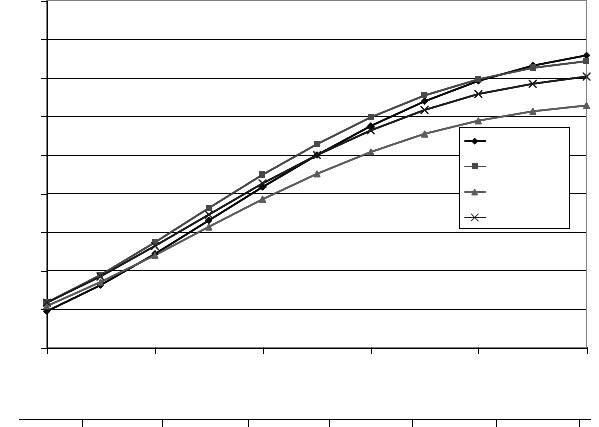
Fig. 15-21 shows the results of yield calculations of the area-specific annual
energy yield for different wind regimes having a Weibull frequency distribution.
As previously mentioned, the strong wind design of the Ecotecnia 44 (stall
concept) produces the highest area-specific energy yield at high mean wind
speeds. Its low power coefficient at low wind speeds is disadvantageous for mod-
erate wind regimes. The REpower 48/600 (stall concept as well) performs better
than the Ecotecnia 44 particularly at lower mean wind speeds. However, these ad-
vantages do not apply for sites with a relatively broad wind speed distribution
(k = 1.5, Fig. 15-22 a). The stall concept with two rotor speeds shows two local
maxima of the power coefficient, but the hysteresis in the control for switching
between the two rotor speeds is a disadvantage of this concept of control.
The Vestas V47 wind turbine is also designed for stronger winds. However, de-
spite its higher rated power and rated wind speed, the power coefficient curve lies
below that of the Ecotecnia wind turbine, which is also designed for higher wind
speeds. Therefore, the area-specific yield of the Vestas wind turbine is below that
of the Ecotecnia wind turbine for higher mean wind speeds, on the one hand. On
the other hand, the higher power coefficient of the Vestas wind turbine at wind
speeds below 10 m/s becomes advantageous for lower mean wind speeds.
0
250
500
750
1.000
1.250
1.500
1.750
2.000
2.250
3,0 4,0 5,0 6,0 7,0 8,0
Mean wind speed v in m/s (in 10 m height)
Area-specific annual yield in kWh / m² .
Ecotecnia
Enercon
REpower
Vestas
k = 2.0
_
5
6
7
8
9
10 11
Mean wind speed v in m/s in 65 m hub height (z
0
= 0.1 m)
_
3
4 5 6 7 8
0
250
500
750
1.000
1.250
1.500
1.750
2.000
2.250
3,0 4,0 5,0 6,0 7,0 8,0
Mean wind speed v in m/s (in 10 m height)
Area-specific annual yield in kWh / m² .
Ecotecnia
Enercon
REpower
Vestas
k = 2.0
_
5
6
7
8
9
10 11
Mean wind speed v in m/s in 65 m hub height (z
0
= 0.1 m)
_
3
4 5 6 7 8
0
250
500
750
1.000
1.250
1.500
1.750
2.000
2.250
3,0 4,0 5,0 6,0 7,0 8,0
Mean wind speed v in m/s (in 10 m height)
Area-specific annual yield in kWh / m² .
Ecotecnia
Enercon
REpower
Vestas
k = 2.0
0
250
500
750
1.000
1.250
1.500
1.750
2.000
2.250
3,0 4,0 5,0 6,0 7,0 8,0
Mean wind speed v in m/s (in 10 m height)
Area-specific annual yield in kWh / m² .
Ecotecnia
Enercon
REpower
Vestas
k = 2.0
_
5
6
7
8
9
10 11
5
6
7
8
9
10 11
Mean wind speed v in m/s in 65 m hub height (z
0
= 0.1 m)
_
3
4 5 6 7 8
Fig. 15-21 Area-specific annual yield versus mean wind speed in 10 m height of four different
wind turbines and shape factor k = 2.0 of the Weibull distribution
15 Planning, operation and economics of wind farm projects 515
The ENERCON E-40 with its variable-speed operation and pitch control displays
a relatively broad saddle around its maximum power coefficient. This results in an
optimum yield for mean wind speeds between 4 and 7 m/s.
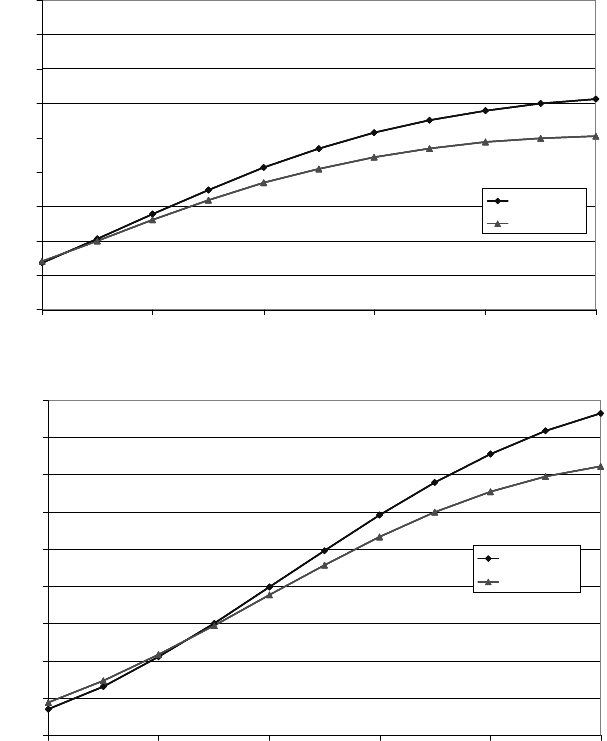
The shape factor k of the wind regime has a slight influence on the choice of
the most suitable wind turbine, shown in Fig. 15-22 using the two wind turbines
with stall control by way of example.
0
250
500
750
1.000
1.250
1.500
1.750
2.000
2.250
3,04,05,06,07,08,0
Mean wind speed v in m/s (in 10 m height)
Area-specific annual yield in kWh / m²c
Ecotecnia
REpower
_
a) k = 1.5
3
4 5 6 7 8
0
250
500
750
1.000
1.250
1.500
1.750
2.000
2.250
3,04,05,06,07,08,0
Mean wind speed v in m/s (in 10 m height)
Area-specific annual yield in kWh / m²c
Ecotecnia
REpower
_
a) k = 1.5
3
4 5 6 7 8
0
250
500
750
1.000
1.250
1.500
1.750
2.000
2.250
3,04,05,06,07,08,0
Mean wind speed v in m/s (in 10 m height)
Area-specific annual yield in kWh / m²c
Ecotecnia
REpower
_
a) k = 1.5
3
4 5 6 7 8
0
250
500
750
1.000
1.250
1.500
1.750
2.000
2.250
345678
Mean wind speed v in m/s (in 10 m height)
Area-specific annual yield in kWh / m².
Ecotecnia
REpower
b) k = 2.5
_
0
250
500
750
1.000
1.250
1.500
1.750
2.000
2.250
345678
Mean wind speed v in m/s (in 10 m height)
Area-specific annual yield in kWh / m².
Ecotecnia
REpower
b) k = 2.5
_
0
250
500
750
1.000
1.250
1.500
1.750
2.000
2.250
345678
Mean wind speed v in m/s (in 10 m height)
Area-specific annual yield in kWh / m².
Ecotecnia
REpower
b) k = 2.5
_
Fig. 15-22a, b Area-specific annual yield versus mean wind speed in 10 m height of two differ-
ent wind turbines and a shape factor k=1.5 (a) resp. 2.5 (b) of the Weibull distribution
516 15.2 Erection and operation of wind turbines
For a small shape factor (k = 1.5) the strong wind design of the Ecotecnia wind
turbine gives a higher area-specific yield, for a more even wind frequency distri-
bution (k = 2.5) the REpower wind turbine performs better for smaller mean wind
speeds.
It has to be mentioned that the above discussion makes no reference as to
which wind turbine would be the most economically efficient. This question can
only be answered by taking into account the investment costs for the wind tur-
bines. Furthermore, consideration of the area-specific yield places the wind tur-
bine with the biggest rotor in an unfavourable light, although this wind turbine
may incur lowest power generation costs per kWh and deliver highest energy
yield. The differences in the annual energy yield in kWh between the wind tur-
bines in Fig. 15-22 are relatively small, even at higher mean wind speeds.
15.2.1 General estimation of the annual energy yield of an
idealised wind turbine
The following theoretical approach may be useful to provide a first estimate of
the annual electricity production without a known measured power curve of a
wind turbine. To simplify matters, the first assumption is that the histogram of
wind conditions at the site can be described using the Rayleigh frequency distribu-
tion, cf. section 4.2.4. This suits well for the site conditions in the low lands of
Northern Germany as well as e.g. in Patagonia in Southern America. The Rayleigh
frequency distribution represents a special case of the Weibull frequency distribu-
tion for the factor k = 2.0, cf. equation (4.13) and Fig. 4-21a. The explicit formula-
tion of the Rayleigh frequency distribution is given by
¸
¸
¸
¹
·
¨
¨
¨
©
§
¸
¸
¹
·
¨
¨
©
§
2
2
4
exp
2
)(
v
v
v
v
vh
SS
. (15.4)
It only depends on the annual mean wind speed
v
, and we assume that this value
was already extrapolated to be representative of the hub height wind speed.
The wind turbine is modelled taking losses into account by a “real Betz-constant
turbine”, see small diagram sketch in Fig. 15-23. The meaning of this is as fol-
lows: the wind turbine operates between cut-in wind speed v
cut-in
= 0.25 v
R
and
rated wind speed v = v
R
always at its best efficiency,
O
opt
, due to a variable rotor
speed (cf. chapter 13). In this wind speed range, the total power coefficient of the
wind turbine is assumed to be c
P
= c
P.ges
= 0.41 to generally cover all losses due
to the rotor, gearbox, generator and converter.
15 Planning, operation and economics of wind farm projects 517
0
500
1000
1500
2000
2500
3000
3500
4000
2 3 4 5 6 7 8 9 10 11 12
Mittlere Jahresw indgeschw indigkeit v
m.a
in m/s
Flächenspezifischer Jahresertrag E
a
in kWh/m²
15
v
N
= 16 m/s
14
13
12
11
10
9
8
Annahmen: -Wind nach Rayleigh-Häufigkeitsverteilung
-WKA-Leistungsbeiwert c
p
= 0,41 = const
-Luftdichte
U
= 1,2 kg/m³
v
N
v
N
v
aus
/ v
N
=
2,0
v
ein
/ v
N
=
0,25
P
N
Area-specific annual yield in kWh / m²
Annual mean wind speed v in m/s at hub height
_
Assumptions: - Rayleigh wind frequency distribution
- WEC power coefficient c
P
= 0.41 = const
- air density
P
R
P
R
v
cut-in
/v
R
=
0.25
v
R
v
cut-out
/v
R
=
2.0
v
R
0
500
1000
1500
2000
2500
3000
3500
4000
2 3 4 5 6 7 8 9 10 11 12
Mittlere Jahresw indgeschw indigkeit v
m.a
in m/s
Flächenspezifischer Jahresertrag E
a
in kWh/m²
15
v
N
= 16 m/s
14
13
12
11
10
9
8
Annahmen: -Wind nach Rayleigh-Häufigkeitsverteilung
-WKA-Leistungsbeiwert c
p
= 0,41 = const
-Luftdichte
U
= 1,2 kg/m³
v
N
v
N
v
aus
/ v
N
=
2,0
v
ein
/ v
N
=
0,25
P
N
Area-specific annual yield in kWh / m²
Annual mean wind speed v in m/s at hub height
_
Annual mean wind speed v in m/s at hub height
_
Assumptions: - Rayleigh wind frequency distribution
- WEC power coefficient c
P
= 0.41 = const
- air density
P
R
P
R
v
cut-in
/v
R
=
0.25
v
R
v
cut-out
/v
R
=
2.0
v
R
Fig. 15-23 Area-specific annual yield versus mean wind speed at hub height
At v = v
R
there is a sharp corner in the power curve P = P(v). Between v
R
and the
cut-out wind speed v
cut-out
= 2 v
R
the wind turbine constantly operates at rated
power P
R
.
The integral of the energy yield, cf. equation (4.20), is now applied to the
period of a year T = 8,760 h
dvvPvvhTE )(),(
0
³
f
. (15.5)
Using the area of one square metre as reference area for calculating the power
gives the area-specific annual energy yield E
a
of the wind turbine shown in
Fig. 15-23 depending on its rated wind speed v
R
(turbine) and the annual mean
wind speed
v
(site). Here, it becomes apparent that reasonable designs will use a
rated wind speed of v
R
= 2
v
, i.e. twice the annual mean wind speed (in praxi: v
R
= 11...15 m/s). If the sharp corner in the power curve is moved to a higher rated
wind speed v
R
, i.e. if a bigger generator is installed, the annual energy yield is in-
creased only slightly.
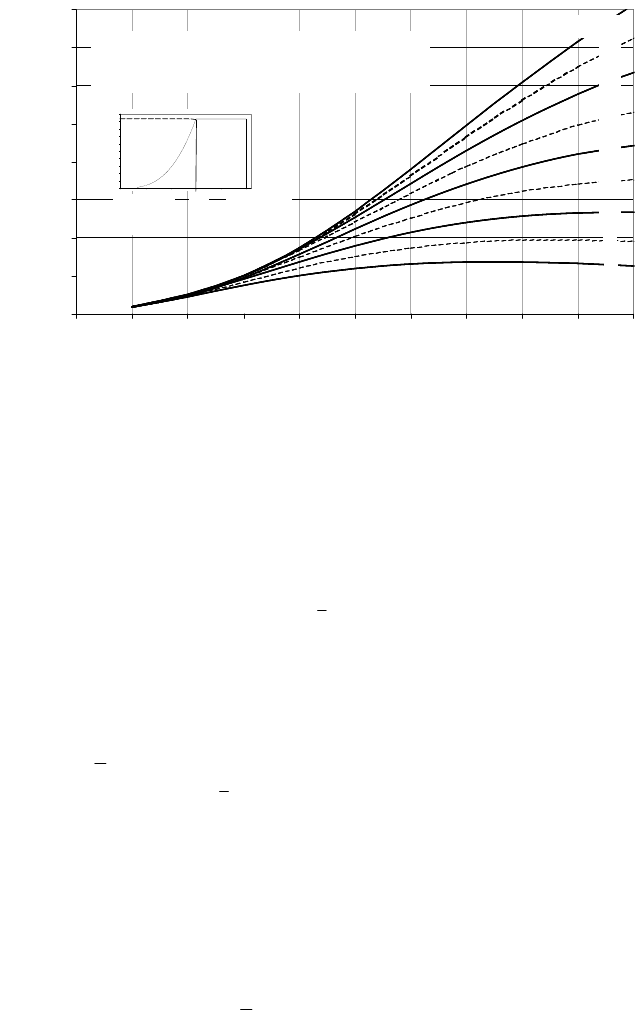
This is shown even more clearly in Fig. 15-24 where the annual energy yield -
which contains a lot of partial load hours - is converted into the full load equiva-
lence (i.e. capacity factor) which is the ratio of the annual energy yield E
a
to the
product of rated power and the time period of a year: E
a
.
v
.
R
= P
R
8,760 h. The
curves of full load equivalence versus the ratio of the rated wind speed to the
annual mean wind speed, v
R
/
v
in Fig. 15-24 reveal the following:
518 15.2 Erection and operation of wind turbines
0,0
0,1
0,2
0,3
0,4
0,5
0,6
0,7
0,8
0,9
1,0
1,0 1,2 1,4 1,6 1,8 2,0 2,2 2,4 2,6 2,8 3,0
Auf die mittlere Jahreswindgeschwindigkeit bezogene
Nennw ind
g
eschw indi
g
keit v
N
/v
ma
Vollastäquivalent E
a
/E
a.v_N
A
nnahmen: -Wind nach Rayleigh-Häufigkeitsverteilung
-WKA-Leistungsbeiwert c
p
= 0,41 = const
-Luftdichte
U
= 1,2 kg/m³ .
v
N
= 8...16 m/s
Ratio of rated wind speed to annual mean wind speed v
R
/ v
Full load equivalence E
a
/E
a.v.R
Assumptions: - Rayleigh wind frequency distribution
- WEC power coefficient c
P
= 0.41 = const
- air density
v
R
_
123
1.0
0.5
0.0
Fig. 15-24 Full load equivalence depending on the ratio of wind turbine rated wind speed to
annual mean wind speed
A relatively small generator with a rated wind speed of v
R
= 1.5
v
would show a
full load equivalence of approx. 40%, but due to the quite small rated power, its
power curve would not follow the cube power law P ~ v³ for higher wind speeds,
i.e. a significant portion of the wind power could not be harvested by this turbine.
The more common wind turbine design with a design wind speed of approx.
v
R
= 2
v
has a yield which is only slightly smaller than the potential yield since
the higher wind speeds only have a relatively low frequency. However, the full
load equivalence is reduced to approx. 20%, the generator frequently operates at
partial load.
References
[1] Cremer C., Möser M.: Technische Akustik (Technical acoustics), 5. Edition, Springer
Verlag, 2003
[2] Deutsches Windenergie-Institut (DEWI): Studie zur aktuellen Kostensituation 2002
der Windenergienutzung in Deutschland (Study on the current cost situation of wind
energy application in Germany in 2002), Wilhelmshaven 2002
[3] Bundesverband Windenergie e.V.: Windenergie 2004 und 2005, Marktübersicht (Wind
energy market surveys of the German Federal Wind Energy Association, BWE )
[4] BTM Consult: International Wind Energy Development, World Market Update, BTM,
March, 2002
[5] Firmenangaben (company information)
[6] Bundesverband WindEnergie e.V. (BWE): Mit einer grünen Geldanlage schwarze
Zahlen schreiben (How to be in the black with a green investment), Osnabrück, 2002
15 Planning, operation and economics of wind farm projects 519
[7] Hahn B., ISET: Zuverlässigkeit, Wartung und Betriebskosten von Windkraftanlagen –
Auswertungen des wissenschaftlichen Mess- und Evaluierungsprogramms (WMEP),
(Reliability, maintenance and operating costs of wind turbines – Conclusions from the
scientific measuring and evaluation programme (WMEP)), Kassel, 2003
[8] Bundesverband WindEnergie (German Federal Wind Energy Association, BWE),
www.wind-energie.de, 2004
[9] Hadel, J.: Assembly of the wind turbine Multibrid M5000, www.hadel.net, 2009
[10] Liebherr: Firmenangaben (company information), www.liebherr.com, 2005
[11] Deutsche WindGuard Dynamics GmbH: Firmenangaben, (company information),
2005
[12] Gesetz für den Vorrang Erneuerbarer Energien – EEG (German Renewable Energy
Sources Act), BGBl. No. 13, Bonn, Germany, 31
st
March 2000
[13] ISET (Institut für.solare Energieversorgungstechnik e. V.): Fortbildungsunterlagen
„Grid-connected Wind Turbines (Seminar documents), InWEnt gGmbH, 2004
[14] Germanischer Lloyd Industrial Services GmbH: Guideline for the Continued Opera-
tion of Wind Turbines), Hamburg 2009
Further literature: EWEA: Wind Energy - The Facts, Brussels, Belgium, 2004
R. Gasch and J. Twele (eds.), Wind Power Plants: Fundamentals, Design, Construction 520
and Operation, DOI 10.1007/978-3-642-22938-1_16, © Springer-Verlag Berlin Heidelberg 2012
16 Offshore wind farms
In the future, wind energy will be playing a dominant role in raising the share of
renewables in electricity generation. This will significantly reduce the emission of
carbon dioxide and the use of fossil fuels. Land use limitations in areas with high
population density are hindering the installation of new large wind farms. Off-
shore, however, there is an enormous wind resource that has the advantages of
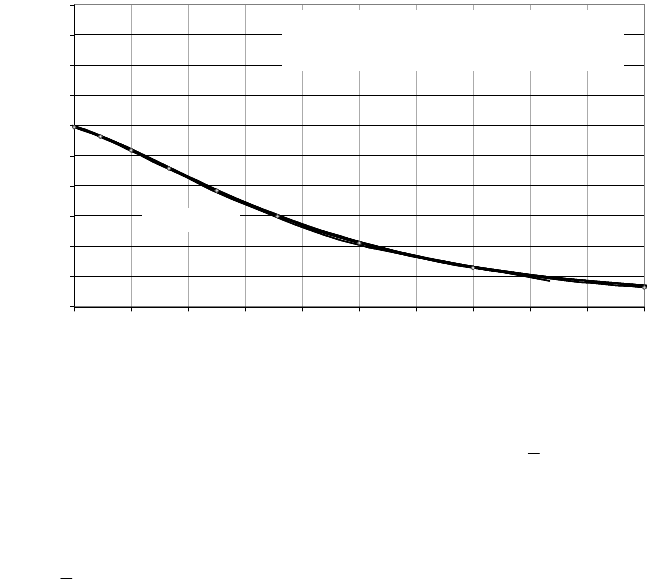
both abundant space and dense winds. In 1995, a study found that the exploitable
offshore wind resource theoretically exceeds the total consumption of electricity in
Europe (Fig. 16-1).
0
500
1000
1500
2000
2500
3000
3500
< 10 km < 20 km < 30 km < 40 km
distance from shore
annual energy [TWh]
< 10 m
< 20 m
< 30 m
water depth
Fig. 16-1 Estimated offshore wind energy potential in the EU [1] (EUROSTAT estimated the
EU 27 total electricity consumption for 2005 to be 2,756 TWh)
Though offshore projects were conceived as early as the 1970's, the first small-
scale offshore wind farms were built between 1991 and 1997 in Sweden, Denmark
and the Netherlands. Intended as demonstration projects, they were installed in
relatively sheltered waters. The year 2000 marked the start of commercial offshore
development with the erection of the first sea-based wind farms employing 1.5 to
2 MW wind turbines at water depths below 10 m. In 2002, the first large offshore
wind farm, with 160 MW capacity, was commissioned in Denmark. 631 offshore
turbines with a total capacity of 1,486 MW have been erected by the end of 2008.
This corresponds to 1.2% of the total cumulative wind power capacity in the
world. For the distant future, plans have been developed for Gigawatt-sized plants
that employ multi-megawatt machines at sites as far as 100 km from shore and in
water depths up to 30 m. The aggressive environment of the North Sea and
Atlantic will present real challenges compared to the relatively benign Baltic.
Eventually, the installed offshore capacity may amount to several times that
installed on land.
The aforementioned demonstration projects proved the technological feasibility,
but highlighted the economic challenges associated with sea-based development.
16 Offshore wind farms 521
As a rule of thumb from the offshore oil and gas industry any work on sea is five
to ten times more expensive than on land. In general, economically feasible off-
shore development depends upon viewing offshore wind farms as larger
systems that are composed of integrated sub-systems (Fig. 16-2). This chapter is
organised along similar lines and addresses the various sub-systems in order to
construct an overview of offshore wind energy development. For further reading,
refer to [2, 3, 4].
aerodynamics
wind turbine
economics
farm layout
grid connection
support
€
operation & maintenance
site
hydrodynamics
structure
Fig. 16-2 Integrated design approach considering all sub-systems and techno-economic aspects
of an offshore wind farm
16.1 Offshore environment
Various natural and man-made environmental conditions can affect an offshore
wind farm (Fig. 16-3) and these conditions create both incentives and challenges.
Offshore development is attractive because the annual average wind speed is con-
siderably higher offshore than at most onshore sites (Chapter 4) and the lower sur-
face roughness at sea causes a lower ambient turbulence. For large offshore wind
farms, however, the latter advantage might be partially offset by the wake-induced
turbulence and background turbulence of the wind farm itself. Though the favour-
able wind regime invites development, the offshore environment makes develop-
ment technically complicated. Waves, currents and sea ice (if any) generate the
most important hydrodynamic loads. The sea level varies according to tides, at-
mospheric conditions or long-term trends. Behaviour of offshore foundations is
more complex for a variety of reasons. From both a practical and a theoretical
viewpoint it is much more difficult to get reliable soil parameters for design pur-
poses. Also, waves and currents may erode soil in the vicinity of the foundation
(scour) or may destabilise the entire seabed. Finally, the high humidity and salinity
increases corrosion of machinery and structure.