Greene W.H. Econometric Analysis
Подождите немного. Документ загружается.


CHAPTER 19
✦
Limited Dependent Variables
849
THEOREM 19.4
Partial Effects in the Censored Regression Model
In the censored regression model with latent regression y
∗
= x
β +ε and observed
dependent variable, y = aify
∗
≤ a, y = bify
∗
≥ b, and y = y
∗
otherwise,
where a and b are constants, let f (ε) and F(ε) denote the density and cdf of ε.
Assume that ε is a continuous random variable with mean 0 and variance σ
2
, and
f (ε |x) = f (ε). Then
∂E [y |x]
∂x
= β × Prob[a < y
∗
< b].
Proof: By definition,
E [y |x] = a Prob[y
∗
≤ a |x] +b Prob[y
∗
≥ b |x]
+Prob[a < y
∗
< b |x]E [y
∗
|a < y
∗
< b |x].
Let α
j
= ( j − x
β)/σ, F
j
= F(α
j
), f
j
= f (α
j
), and j = a, b. Then
E [y |x] = aF
a
+ b(1 − F
b
) + (F
b
− F
a
)E [y
∗
|a < y
∗
< b, x].
Because y
∗
= x
β + σ [(y
∗
− β
x)/σ ], the conditional mean may be written
E [y
∗
|a < y
∗
< b, x] = x
β + σ E
y
∗
− x
β
σ
*
*
*
*
a − x
β
σ
<
y
∗
− x
β
σ
<
b − x
β
σ
= x
β + σ
'
α
b
α
a
(ε/σ ) f (ε/σ )
F
b
− F
a
d
ε
σ
.
Collecting terms, we have
E [y |x] = aF
a
+ b(1 − F
b
) + (F
b
− F
a
)β
x + σ
'
α
b
α
a
ε
σ
f
ε
σ
d
ε
σ
.
Now, differentiate with respect to x. The only complication is the last term, for
which the differentiation is with respect to the limits of integration. We
use Leibnitz’s theorem and use the assumption that f (ε) does not involve x.
Thus,
∂E [y |x]
∂x
=
−β
σ
af
a
−
−β
σ
bf
b
+ (F
b
− F
a
)β + (x
β)( f
b
− f
a
)
−β
σ
+σ [α
b
f
b
− α
a
f
a
]
−β
σ
.
After inserting the definitions of α
a
and α
b
, and collecting terms, we find all terms
sum to zero save for the desired result,
∂ E [y |x]
∂x
= (F
b
− F
a
)β = β ×Prob[a < y
∗
i
< b].

850
PART IV
✦
Cross Sections, Panel Data, and Microeconometrics
Note that this general result includes censoring in either or both tails of the distribu-
tion, and it does not assume that ε is normally distributed. For the standard case with
censoring at zero and normally distributed disturbances, the result specializes to
∂E [y
i
|x
i
]
∂x
i
= β
x
i
β
σ
.
Although not a formal result, this does suggest a reason why, in general, least squares
estimates of the coefficients in a tobit model usually resemble the MLEs times the
proportion of nonlimit observations in the sample.
McDonald and Moffitt (1980) suggested a useful decomposition of ∂E [y
i
|x
i
]/∂x
i
,
∂E [y
i
|x
i
]
∂x
i
= β ×
i
[1 − λ
i
(α
i
+ λ
i
)] + φ
i
(α
i
+ λ
i
)
,
where α
i
= x
i
β/σ ,
i
= (α
i
) and λ
i
= φ
i
/
i
. Taking the two parts separately, this
result decomposes the slope vector into
∂ E [y
i
|x
i
]
∂x
i
= Prob[y
i
> 0]
∂ E [y
i
|x
i
, y
i
> 0]
∂x
i
+ E [y
i
|x
i
, y
i
> 0]
∂ Prob[y
i
> 0]
∂x
i
.
Thus, a change in x
i
has two effects: It affects the conditional mean of y
∗
i
in the positive
part of the distribution, and it affects the probability that the observation will fall in
that part of the distribution.
19.3.3 ESTIMATION
The tobit model has become so routine and been incorporated in so many computer
packages that despite formidable obstacles in years past, estimation is now essentially
on the level of ordinary linear regression. The log-likelihood for the censored regression
model is
ln L =
y
i
>0
−
1
2
log(2π) + ln σ
2
+
(y
i
− x
i
β)
2
σ
2
+
y
i
=0
ln
1 −
x
i
β
σ
. (19-13)
The two parts correspond to the classical regression for the nonlimit observations and
the relevant probabilities for the limit observations, respectively. This likelihood is a
nonstandard type, because it is a mixture of discrete and continuous distributions. In
a seminal paper, Amemiya (1973) showed that despite the complications, proceeding
in the usual fashion to maximize ln L would produce an estimator with all the familiar
desirable properties attained by MLEs.
The log-likelihood function is fairly involved, but Olsen’s (1978) reparameterization
simplifies things considerably. With γ = β/σ and θ = 1/σ , the log-likelihood is
ln L =
y
i
>0
−
1
2
[ln(2π) − ln θ
2
+ (θ y
i
− x
i
γ )
2
] +
y
i
=0
ln[1 − (x
i
γ )]. (19-14)
The results in this setting are now very similar to those for the truncated regression.
The Hessian is always negative definite, so Newton’s method is simple to use and
usually converges quickly. After convergence, the original parameters can be recov-
ered using σ = 1/θ and β = γ /θ. The asymptotic covariance matrix for these esti-
mates can be obtained from that for the estimates of [γ ,θ] using the delta method:

CHAPTER 19
✦
Limited Dependent Variables
851
TABLE 19.2
Tobit Estimates of an Hours Worked Equation
White Wives Black Wives
Coefficient Slope Coefficient Slope
Least
Squares
Scaled
OLS
Constant −1803.13 −2753.87
(−8.64) (−9.68)
Small kids −1324.84 −385.89 −824.19 −376.53 −352.63 −766.56
(−19.78) (−10.14)
Education −48.08 −14.00 22.59 10.32 11.47 24.93
difference (−4.77) (1.96)
Relative wage 312.07 90.90 286.39 130.93 123.95 269.46
(5.71) (3.32)
Second marriage 175.85 51.51 25.33 11.57 13.14 28.57
(3.47) (0.41)
Mean divorce 417.39 121.58 481.02 219.75 219.22 476.57
probability (6.52) (5.28)
High divorce 670.22 195.22 578.66 264.36 244.17 530.80
probability (8.40) (5.33)
σ 1,559 618 1,511 826
Sample size 7459 2798
Proportion working 0.29 0.46
Est. Asy. Var[
ˆ
β, ˆσ ] =
ˆ
J Asy. Var[ ˆγ ,
ˆ
θ]
ˆ
J
, where
J =
∂β/∂γ
∂β/∂θ
∂σ/∂γ
∂σ/∂θ
=
(1/θ)I (−1/θ
2
)γ
0
(−1/θ
2
)
.
Researchers often compute ordinary least squares estimates despite their incon-
sistency. Almost without exception, it is found that the OLS estimates are smaller
in absolute value than the MLEs. A striking empirical regularity is that the maxi-
mum likelihood estimates can often be approximated by dividing the OLS estimates
by the proportion of nonlimit observations in the sample.
11
The effect is illustrated
in the last two columns of Table 19.2. Another strategy is to discard the limit ob-
servations, but we now see that just trades the censoring problem for the truncation
problem.
Example 19.5 Estimated Tobit Equations for Hours Worked
In their study of the number of hours worked in a survey year by a large sample of wives,
Quester and Greene (1982) were interested in whether wives whose marriages were statisti-
cally more likely to dissolve hedged against that possibility by spending, on average, more
time working. They reported the tobit estimates given in Table 19.2. The last figure in the
table implies that a very large proportion of the women reported zero hours, so least squares
regression would be inappropriate.
The figures in parentheses are the ratio of the coefficient estimate to the estimated asymp-
totic standard error. The dependent variable is hours worked in the survey year. “Small kids”
is a dummy variable indicating whether there were children in the household. The “education
difference” and “relative wage” variables compare husband and wife on these two dimen-
sions. The wage rate used for wives was predicted using a previously estimated regression
model and is thus available for all individuals, whether working or not. “Second marriage” is a
11
This concept is explored further in Greene (1980b), Goldberger (1981), and Chung and Goldberger (1984).
852
PART IV
✦
Cross Sections, Panel Data, and Microeconometrics
dummy variable. Divorce probabilities were produced by a large microsimulation model pre-
sented in another study [Orcutt, Caldwell, and Wertheimer (1976)]. The variables used here
were dummy variables indicating “mean” if the predicted probability was between 0.01 and
0.03 and “high” if it was greater than 0.03. The “slopes” are the marginal effects described
earlier.
Note the marginal effects compared with the tobit coefficients. Likewise, the estimate of
σ is quite misleading as an estimate of the standard deviation of hours worked.
The effects of the divorce probability variables were as expected and were quite large. One
of the questions raised in connection with this study was whether the divorce probabilities
could reasonably be treated as independent variables. It might be that for these individuals,
the number of hours worked was a significant determinant of the probability.
19.3.4 TWO-PART MODELS AND CORNER SOLUTIONS
The tobit model contains a restriction that might be unreasonable in an economic setting.
Consider a behavioral outcome, y = charitable donation. Two implications of the tobit
model are that
Prob(y > 0 |x) = Prob(x
β + ε>0 |x) = (x
β/σ )
and [from (19-7)]
E[y | y > 0, x] = x
β + σφ(x
β/σ )/(x
β/σ ).
Differentiating both of these, we find from (17-11) and (19-8),
∂Prob(y > 0 |x)/∂x = [φ(x
β/σ )/σ ]β = a positive multiple of β,
∂ E[y | y > 0, x]/∂x ={[1 − δ(x
β/σ )]/σ }β = a positive multiple of β.
Thus, any variable that appears in the model affects the participation probability and
the intensity equation with the same sign. In the case suggested, for example, it is
conceivable that age might affect participation and intensity in different directions.
Fin and Schmidt (1984) suggest another application, loss due to fire in buildings; older
buildings might be more likely to have fires but, because of the greater value of newer
buildings, the actual damage might be greater in newer buildings. This fact would require
the coefficient on age to have different signs in the two functions, which is impossible
in the tobit model because they are the same coefficient.
In an early study in this literature, Cragg (1971) proposed a somewhat more general
model in which the probability of a limit observation is independent of the regression
model for the nonlimit data. One can imagine, for instance, the decision of whether or
not to purchase a car as being different from the decision of how much to spend on the
car, having decided to buy one.
A more general model that accommodates these objections is as follows:
1. Participation equation
Prob[y
∗
i
> 0] = (x
i
γ ), d
i
= 1ify
∗
i
> 0,
Prob[y
∗
i
≤ 0] = 1 − (x
i
γ ), d
i
= 0ify
∗
i
≤ 0.
(19-15)
2. Intensity equation for nonlimit observations
E[y
i
|d
i
= 1] = x
i
β + σλ
i
,
CHAPTER 19
✦
Limited Dependent Variables
853
according to Theorem 19.2. This two-part model is a combination of the truncated re-
gression model of Section 19.2 and the univariate probit model of Section 17.3, which
suggests a method of analyzing it. Note that it is precisely the same approach we con-
sidered in Section 18.4.8 and Example 18.12 where we used a hurdle model to model
doctor visits. The tobit model returns if γ = β/σ . The parameters of the regression (in-
tensity) equation can be estimated independently using the truncated regression model
of Section 19.2. An application is Melenberg and van Soest (1996).
Lin and Schmidt (1984) considered testing the restriction of the tobit model. Based
only on the tobit model, they devised a Lagrange multiplier statistic that, although a
bit cumbersome algebraically, can be computed without great difficulty. If one is able
to estimate the truncated regression model, the tobit model, and the probit model
separately, then there is a simpler way to test the hypothesis. The tobit log-likelihood
is the sum of the log-likelihoods for the truncated regression and probit models. To
show this result, add and subtract
y
i
=1
ln (x
i
β) in (19-13). This produces the log-
likelihood for the truncated regression model (considered in the exercises) plus (17-20)
for the probit model. Therefore, a likelihood ratio statistic can be computed using
λ =−2[ln LT − (ln LP + ln LTR)],
where
LT = likelihood for the tobit model in (19-13), with the same coefficients
LP = likelihood for the probit model in (17-17), fit separately
LTR = likelihood for the truncated regression model, fit separately
The two-part model just considered extends the tobit model, but it stops a bit short
of the generality we might achieve. In the preceding hurdle model, we have assumed
that the same regressors appear in both equations. Although this produces a convenient
way to retreat to the tobit model as a parametric restriction, it couples the two decisions
perhaps unreasonably. In our example to follow, where we model extramarital affairs,
the decision whether or not to spend any time in an affair may well be an entirely
different decision from how much time to spend having once made that commitment.
The obvious way to proceed is to reformulate the hurdle model as
1. Participation equation
Prob[d
∗
i
> 0] = (z
i
γ ), d
i
= 1ifd
∗
i
> 0,
Prob[d
∗
i
≤ 0] = 1 −(z
i
γ ), d
i
= 0ifd
∗
i
≤ 0. (19-16)
2. Intensity equation for nonlimit observations
E[y
i
|d
i
= 1] = x
i
β + σλ
i
.
This extension, however, omits an important element; it seems unlikely that the two
decisions would be uncorrelated; that is, the implicit disturbances in the equations
should be correlated. The combination of these produces what has been labeled a type-
II tobit model. [Amemiya (1985) identified five possible permutations of the model
specification and observation mechanism. The familiar tobit model is type I; this is
type-II.] The full model is

854
PART IV
✦
Cross Sections, Panel Data, and Microeconometrics
1. Participation equation
d
∗
i
= z
i
γ + u
i
, u
i
∼ N[0, 1]
d
i
= 1ifd
∗
i
> 0, 0 otherwise.
2. Intensity equation
y
∗
i
= x
i
β + ε
i
,ε
i
∼ N[0,σ
2
].
3. Observation mechanism
(a) y
∗
i
= 0ifd
i
= 0 and y
i
= y
∗
i
if d
i
= 1.
(b) y
i
= y
∗
i
if d
i
= 1 and y
i
is unobserved if d
i
= 0.
4. Endogeneity
(u
i
,ε
i
) ∼ bivariate normal with correlation ρ.
Mechanism (a) produces Amemiya’s type II model. Amemiya blends these two in-
terpretations. In the statement of the model, he presents (a), but in the subsequent
discussion, assumes (b). The difference is substantive if x
i
is observed in case (b). Oth-
erwise, they are the same, and “y
i
= 0” is not actually meaningful. Amemiya notes,
“y
∗
i
= 0 merely signifies the event d
∗
i
≤ 0.”Ifx
i
is observed when d
i
= 0, then these ob-
servations will contribute to the likelihood for the full sample. If not, then they will not.
We will develop this idea later when we consider Heckman’s selection model [which is
case (b) without observed x
i
when d
i
= 0].
There are two estimation strategies that can be used to fit the type II model. A two-
step method can proceed as follows: The probit model for d
i
can be estimated using
maximum likelihood as shown in Section 17.3. For the second step, we make use of our
theorems on truncation (and Theorem 19.5 that will appear later) to write
E[y
i
|d
i
= 1, x
i
, z
i
] = x
i
β + E[ε
i
|d
i
= 1, x
i
, z
i
]
= x
i
β + ρσ
φ(z
i
γ )
(z
i
γ )
(19-17)
= x
i
β + ρσλ
i
.
Since we have estimated γ at step 1, we can compute
ˆ
λ
i
= φ(z
i
ˆγ )/(z
i
ˆγ ) using the
first-step estimates, and we can estimate β and θ = (ρσ ) by least squares regression of
y
i
on x
i
and
ˆ
λ
i
. It will be necessary to correct the asymptotic covariance matrix that
is computed for (
ˆ
β,
ˆ
θ). This is a template application of the Murphy and Topel (2002)
results that appear in Section 14.7. The second approach is full information maximum
likelihood, estimating all the parameters in both equations simultaneously. We will
return to the details of estimation of the type II tobit model in Section 19.5 where
we examine Heckman’s model of “sample selection” model (which is the type II tobit
model).
Many of the applications of the tobit model in the received literature are con-
structed not to accommodate censoring of the underlying data, but, rather, to model
the appearance of a large cluster of zeros. Cragg’s application is clearly related to this
phenomenon. Consider, for example, survey data on purchases of consumer durables,
firm expenditure on research and development, or consumer savings. In each case, the
CHAPTER 19
✦
Limited Dependent Variables
855
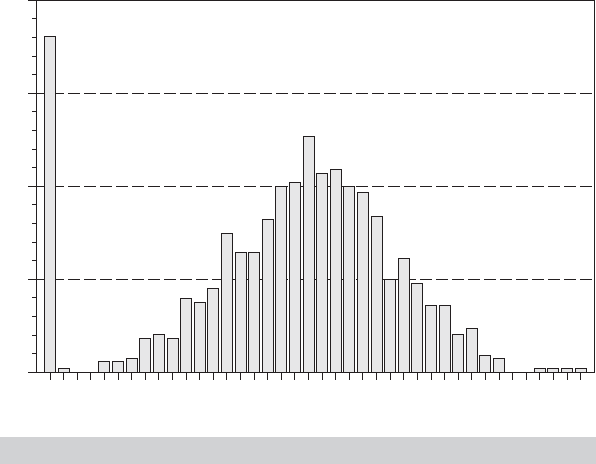
0.000 14.131 28.262 42.393
Frequency
56.524
SPENDING
70.655 84.786 98.917
FIGURE 19.5
Hypothetical Spending Data.
observed data will consist of zero or some positive amount. Arguably, there are two
decisions at work in these scenarios: First, whether to engage in the activity or not, and
second, given that the answer to the first question is yes, how intensively to engage in
it—how much to spend, for example. This is precisely the motivation behind the hurdle
model. This specification has been labeled a “corner solution model”; see Wooldridge
(2002a, pp. 518–519).
In practical terms, the difference between the hurdle model and the tobit model
should be evident in the data. Often overlooked in tobit analyses is that the model
predicts not only a cluster of zeros (or limit observations), but also a grouping of obser-
vations near zero (or the limit point). For example, the tobit model is surely misspec-
ified for the sort of (hypothetical) spending data shown in Figure 19.5 for a sample of
1,000 observations. Neglecting for the moment the earlier point about the underlying
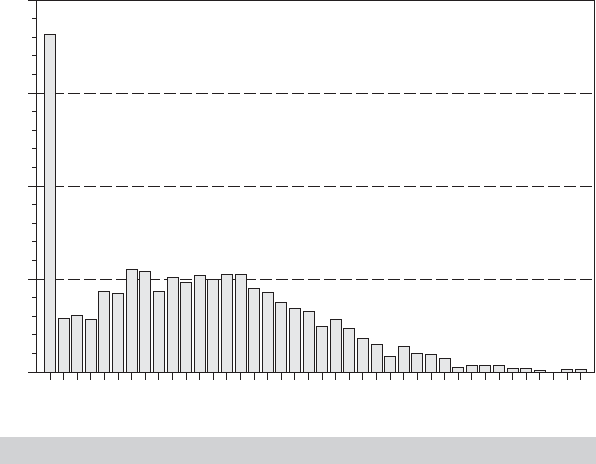
decision process, Figure 19.6 shows the characteristic appearance of a (substantively)
censored variable. The implication for the model builder is that an appropriate speci-
fication would consist of two equations, one for the “participation decision,” and one
for the distribution of the positive dependent variable. Formally, we might, continuing
the development of Cragg’s specification, model the first decision with a binary choice
(e.g., probit or logit model). The second equation is a model for y | y > 0, for which
the truncated regression model of Section 19.2.3 is a natural candidate. As we will
see, this is essentially the model behind the sample selection treatment developed in
Section 19.5.
Two practical issues frequently intervene at this point. First, one might well have
a model in mind for the intensity (regression) equation, but none for the participation
equation. This is the usual backdrop for the uses of the tobit model, which produces the
considerations in the previous section. The second issue concerns the appropriateness
856
PART IV
✦
Cross Sections, Panel Data, and Microeconometrics
0.000 9.862 19.723 29.585
Frequency
39.446
SPENDING
49.308 59.169 69.031
FIGURE 19.6
Hypothetical Censored Data.
of the truncation or censoring model to data such as those in Figure 19.6. If we consider
only the nonlimit observations in Figure 19.5, the underlying distribution does not
appear to be truncated at all. The truncated regression model in Section 19.2.3 fit to these
data will not depart significantly from ordinary least squares [because the underlying
probability in the denominator of (19-6) will equal one and the numerator will equal
zero]. But, this is not the case of a tobit model forced on these same data. Forcing
the model in (19-13) on data such as these will significantly distort the estimator—all
else equal, it will significantly attenuate the coefficients, the more so the larger is the
proportion of limit observations in the sample. Once again, this stands as a caveat for
the model builder. The tobit model is manifestly misspecified for data such as those in
Figure 19.5.
Example 19.6 Two-Part Model for Extramarital Affairs
In Example 18.9, we examined Fair’s (1977) Psychology Today survey data on extramarital
affairs. The 601 observations in the data set are mostly zero—451 of the 601. This feature
of the data motivated the author to use a tobit model to analyze these data. In our example,
we reconsidered the model, since the nonzero observations were a count, not a continuous
variable. Another data set in Fair’s study was the Redbook Magazine survey of 6,366 married
women. Once again, the outcome variable of interest was extramarital affairs. However, in
this instance, the outcome data were transformed to a measure of time spent, which, being
continuous, lends itself more naturally to the tobit model we are studying here. The variables
in the data set are as follows (excluding three unidentified and not used):
id = Identification number
C = Constant, value = 1
yrb = Constructed measure of time spent in extramarital affairs
v
1
= Rating of the marriage, coded 1 to 4
v
2
= Age, in years, aggregated
v
3
= Number of years married

CHAPTER 19
✦
Limited Dependent Variables
857
TABLE 19.3
Estimated Censored Regression Models (
t
-ratios in parentheses)
Model
Linear Truncated Hurdle Hurdle
OLS Tobit Re gression Probit Tobit
/σ Participation Intensity
Constant 3.62346 7.83653 8.89449 2.21010 1.74189 1.56419 4.84602
(13.63) (10.98) (2.90) (12.60) (17.75) (5.87)
RateMarr −0.42053 −1.53071 −0.44303 −0.42874 −0.34024 −0.42582 −0.24603
(−14.79) (−20.85) (−1.45) (−23.40) (−23.61) (−.46)
Age −0.01457 −0.10514 −0.22394 −0.03542 −0.02337 −0.01903
(−1.59) (−4.24) (−1.83) (−5.87) (−.77)
YrsMarr −0.01599 0.12829 −0.94437 0.06563 0.02852 −0.16822
(−1.62) ( 4.86) (−7.27) (10.18) (−6.52)
NumKids −0.01705 −0.02777 −0.02280 −0.00394 −0.00617 0.14024 −0.28365
(−.57) (−0.36) (−0.06) (−0.21) (11.55) (−1.49)
Religious −0.24374 −0.94350 −0.50490 −0.22281
−0.20972 −0.21466 −0.05452
(−7.83) (−11.11) (−1.29) (−10.88) (−10.64) (−0.19)
Education −0.01743 −0.08598 −0.06406 −0.02373 −0.01911 0.00338
(−1.24) (−2.28) (−0.38) (−2.60) (0.09)
Wife Occ. 0.06577 0.31284 0.00805 0.09539 0.06954 0.01505
(2.10) (3.82) (0.02) (4.75) (0.19)
Hus. Occ. 0.00405 0.01421 −0.09946 0.00659 0.00316 −0.02911
(0.19) (0.26) (−0.41) (0.49) (−0.53)
σ 2.14351 4.49887 5.46846 3.43748
ln L R
2
= 0.05479 −7,804.38 −3,463.71 −3,469.58
v
4
= Number of children, top coded at 5
v
5
= Religiosity, 1 to 4, 1 = not, 4 = very
v
6
= Education, coded 9, 12, 14, 16, 17, 20
v
7
= Wife’s Occupation—Hollingshead scale
v
8
= Husband’s occupation—Hollingshead scale
This is a cross section of 6,366 observations with 4,313 zeros and 2,053 positive values.
Table 19.3 presents estimates of various models for yrb. The leftmost column presents
the OLS estimates. The least squares estimator is inconsistent in this model. The empirical
regularity that the OLS estimator appears to be biased toward zero, the more so is the smaller
the proportion of limit observations. Here, the ratio, based on the tobit estimates in the second
column, appears to be about 4 or 5 to 1. Likewise, the OLS estimator of σ appears to be
greatly underestimated. This would be expected, as the OLS estimator is treating the limit
observations, which have no variation in the dependent variable, as if they were nonlimit
observations. The third set of results is the truncated regression estimator. In principle, the
truncated regression estimator is also consistent. However, it will be less efficient as it is
based on less information. In our example, this estimator seems to be quite erratic, again
compared to the tobit estimator. Note, for example, the coefficient on years married, which,
although it is “significant” in both cases, changes sign. The t ratio on Religiousness falls from
−11.11 to −1.29 in the truncation model. The probit estimator based on yrb > 0 appears
next. As a rough check on the corner solution aspect of our model, we would expect the
normalized tobit coefficients (β/σ ) to approximate the probit coefficients, which they appear
to. However, the likelihood ratio statistic for testing the internal consistency based on the
three estimated models is 2[7,804.38 − 3,463.71 −3,469.58] = 1,742.18 with nine degrees
of freedom. The hypothesis of parameter constancy implied by the tobit model is rejected.
The last two sets of results are for a hurdle model in which the intensity equation is fit by the
two-step method.

858
PART IV
✦
Cross Sections, Panel Data, and Microeconometrics
19.3.5 SOME ISSUES IN SPECIFICATION
Two issues that commonly arise in microeconomic data, heteroscedasticity and nonnor-
mality, have been analyzed at length in the tobit setting.
12
19.3.5.a Heteroscedasticity
Maddala and Nelson (1975), Hurd (1979), Arabmazar and Schmidt (1982a,b), and
Brown and Moffitt (1982) all have varying degrees of pessimism regarding how in-
consistent the maximum likelihood estimator will be when heteroscedasticity occurs.
Not surprisingly, the degree of censoring is the primary determinant. Unfortunately, all
the analyses have been carried out in the setting of very specific models—for example,
involving only a single dummy variable or one with groupwise heteroscedasticity—so
the primary lesson is the very general conclusion that heteroscedasticity emerges as an
obviously serious problem.
One can approach the heteroscedasticity problem directly. Petersen and Waldman
(1981) present the computations needed to estimate a tobit model with heteroscedastic-
ity of several types. Replacing σ with σ
i
in the log-likelihood function and including σ
2
i
in the summations produces the needed generality. Specification of a particular model
for σ
i
provides the empirical model for estimation.
Example 19.7 Multiplicative Heteroscedasticity in the Tobit Model
Petersen and Waldman (1981) analyzed the volume of short interest in a cross section of
common stocks. The regressors included a measure of the market component of heteroge-
neous expectations as measured by the firm’s BETA coefficient; a company-specific measure
of heterogeneous expectations, NONMARKET; the NUMBER of analysts making earnings
forecasts for the company; the number of common shares to be issued for the acquisition
of another firm, MERGER; and a dummy variable for the existence of OPTIONs. They report
the results listed in Table 19.4 for a model in which the variance is assumed to be of the form
σ
2
i
= exp( x
i
α) . The values in parentheses are the ratio of the coefficient to the estimated
asymptotic standard error.
The effect of heteroscedasticity on the estimates is extremely large. We do note, however,
a common misconception in the literature. The change in the coefficients is often misleading.
The marginal effects in the heteroscedasticity model will generally be very similar to those
computed from the model which assumes homoscedasticity. (The calculation is pursued in
the exercises.)
A test of the hypothesis that α = 0 (except for the constant term) can be based on the
likelihood ratio statistic. For these results, the statistic is −2[−547.3 −( −466.27)] = 162.06.
This statistic has a limiting chi-squared distribution with five degrees of freedom. The sample
value exceeds the critical value in the table of 11.07, so the hypothesis can be rejected.
In the preceding example, we carried out a likelihood ratio test against the hypoth-
esis of homoscedasticity. It would be desirable to be able to carry out the test without
having to estimate the unrestricted model. A Lagrange multiplier test can be used for
12
Two symposia that contain numerous results on these subjects are Blundell (1987) and Duncan (1986b).
An application that explores these two issues in detail is Melenberg and van Soest (1996). Developing speci-
fication tests for the tobit model has been a popular enterprise. A sampling of the received literature includes
Nelson (1981); Bera, Jarque, and Lee (1982); Chesher and Irish (1987); Chesher, Lancaster, and Irish (1985);
Gourieroux et al. (1984, 1987); Newey (1986); Rivers andVuong (1988); Horowitz and Neumann (1989); and
Pagan and Vella (1989). Newey (1985a,b) are useful references on the general subject of conditional moment
testing. More general treatments of specification testing are Godfrey (1988) and Ruud (1984).