Gupta D. (Ed.). Diffusion Processes in Advanced Technological Materials
Подождите немного. Документ загружается.


coefficient where neutral species are involved. However, if electric fields
are involved and charge buildup can occur, this factor may play a signifi-
cant role in determining the diffusion coefficient. However, as described
above, the solid solubility will determine the amount of material that can
be dissolved or rejected by the film (or the substrate), the compound for-
mation, if any, and the segregation at the film-substrate interface and at
the grain boundaries of the polycrystalline films.
[29]
Segregation at the Grain Boundaries and Interfaces
When a solute is added to a polycrystalline solid, the concentration of
the solute in the grain (or the bulk of the crystal) is controlled by the solid
solubility (that is, the solubility maximum) at the given temperature.
However, the concentration maximum of the solute in the grain boundaries
depends on several factors.
[23, 30]
We define an enrichment factor E
gb
as:
E
gb
C
C
g
b
b
.
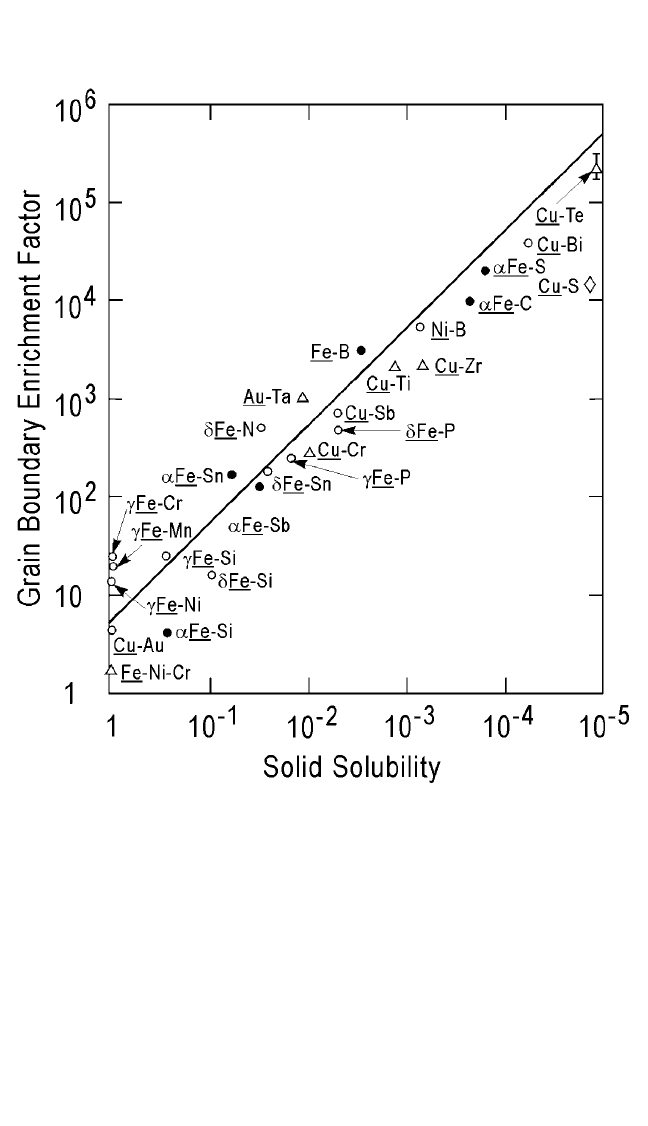
Several investigators
[31–33]
have concluded that the lower the atomic solid
solubility is in the grains (or bulk), the larger E
gb
is. Figure 5.2 shows the
classical plot of the measured E
gb
as a function of the atomic solubility.
[31]
Lower bulk solubility leads to a higher rejection (of solute) into the grain
boundaries. Note that at such high concentrations of impurities (in grain
boundaries), a thin layer (or small volume) of a new phase may form
in the grain boundary. Impurities of one type can also control the concen-
tration of some other undesirable impurities. An example of this is the
addition of Al to steels. Although Al primarily controls the oxygen in solu-
tion in liquid steel, it also controls grain size and shape through the for-
mation of aluminum nitride particles that retard the motion of selected
grain boundaries.
[32]
Similarly, small amounts of Cu added to Al are known
to segregate in the grain boundaries and form q phase-particles, thus
enhancing the electromigration lifetime of such interconnects. The con-
clusion is that the impurity with the lowest atomic solid solubilities should
be used if we want to “stuff” grain boundaries.
[2]
Experience, described in
the preceding examples, has shown that grain boundary stuffing leads to
considerably reduced diffusion and metallurgical interactions, which are
predominantly controlled by grain boundary diffusion, especially at low
temperatures.
[33]
A theoretical framework exists to rationalize the observations and to
characterize broadly the behavior observed. Examine the problem as
Solute concentration in the grain boundaries
Solute concentration in grains
252 DIFFUSION PROCESSES IN ADVANCED TECHNOLOGICAL MATERIALS
Ch_05.qxd 11/29/04 6:19 PM Page 252
DIFFUSION BARRIERS IN SEMICONDUCTOR DEVICES, MURARKA 253
composed of two, two-phase systems: the thin-film/boundary system and
the APDB/boundary system. Segregation of the impurity to the boundary
region is driven by the free energy of segregation that has been derived by
McLean.
[34]
Consider a lattice made up of N undistorted surface sites with
P solute (impurity) atoms distributed on them. Also consider n distorted
surface sites with p solute atoms distributed among them. If the energy of
the solute on the lattice is E, and the energy of the solute on the surface is e,
Figure 5.2 Correlation of grain boundary enrichment (ratio of concentration of the
grain boundary to the grain) factor with the atomic solid solubility.
Note: From E. D. Hondros, J. Phys. 36: coll. C-117 (1975); M. P. Seah and E. D. Hondros, Proc. R.
Soc. London, A335:191 (1973); and D. Gupta, Metall. Trans., 8A:1431 (1977)]
Ch_05.qxd 11/29/04 6:19 PM Page 253

then the free energy of the system is:
G pe PE kt [ln(n!)N! ln(n p)!p!(N P)!P!]. (13)
The minimum in G can be derived by differentiation with respect to p.
This results in the equation:
P(n p) [P(N P) exp[(E e)kt], (14)
or the more familiar:
X
b
(1 X
b
) [X
c
(1 X
c
)] exp(∆Ekt), (15)
where X
b
is the adsorption level as a mole fraction of a monolayer, X
c
is
the solute mole fraction, and ∆E is the heat of adsorption of the segregant
at the boundary.
The extent of segregation at the interface boundary is thus determined
by ∆E and by the concentration of the solute (impurity) in the solvent. For
an ideal situation, for example, epitaxially grown silicon on silicon, ∆E
will be near zero and no segregation will occur at the interface. However,
dislocations have been found experimentally at this interface, resulting
from lattice parameter differences between the deposited layers and the
substrate arising from differences in impurity concentrations. In such a
case, ∆E is a positive quantity and will lead to some impurity segregation
even at the epitaxial interface.
The problem of a boundary separating two different materials presents
significant difficulties in modeling segregation behavior. One approach is
to treat each material separately with a common boundary. The thin film
has a segregation coefficient Θ
TF
that is defined:
Θ
TF
X
b
X
TF
, (16)
where X
TF
is the fraction of impurity dissolved in the thin film. Similarly,
a segregation coefficient for the given underlying (or overlying) film,
such as an APDB film, can be defined:
Θ
ulf
X
b
X
ulf
, (17)
where X
ulf
is the fraction of impurity in the given underlying film.
Therefore, the amount of impurity in the boundary between the thin film
and the underlying film can be viewed as the competition between the two
segregation coefficients. At equilibrium, the impurity concentration in the
boundary reflects the equilibration of the impurity levels in the two films
254 DIFFUSION PROCESSES IN ADVANCED TECHNOLOGICAL MATERIALS
Ch_05.qxd 11/29/04 6:19 PM Page 254

DIFFUSION BARRIERS IN SEMICONDUCTOR DEVICES, MURARKA 255
in contact. In such a case, a segregation coefficient can be defined as a
ratio of the two interfacial segregation coefficients:
K
seg
Θ
TF
Θ
ulf
X
ulf
X
TF
, (18)
where K
seg
, usually known as the segregation coefficient between the two
thin-film materials, is truly a lattice segregation coefficient, in contrast to
the interfacial segregation coefficients Θ
ulf
and Θ
TF
.
The segregation coefficient will thus control the equilibrium concen-
tration across the phase boundary. Precipitation of a new phase at the
phase boundary will, however, change the segregation behavior drasti-
cally. In thin films, the grain boundaries will contribute very significantly,
and possibly erratically, to the segregation phenomenon and thus to
desired APDB behavior.
Information on the solid solubilities can be obtained from the binary
phase diagrams. In cases where such information is not available, we can
make estimates based on a similar binary system or by using Hume-
Rothery rules.
[35]
One of these rules states that the extent of primary solid
solution is limited whenever the differences in the atomic radii of the sol-
vent and solute atoms exceed 15%. The larger the electronegativity dif-
ference is, the more stable the solid solution is. The crystalline structure
of the solids also influences the solubility limits. Experience has shown
that materials with similar crystal structures have extended mutual solid
solubility. These observations and rules on solid solubility apply to crys-
talline materials, where the lattice solubility greatly exceeds the contribu-
tion of defects, phase boundaries, or surfaces to the solute behavior. In
thin films, where grain boundaries and dislocations are abundant, the seg-
regation of impurities to these sites will, in general, control the total
amount of solute dissolved in such films. For example, large amounts of
arsenic and phosphorus could be present in the grain boundary regions of
polysilicon without affecting the electrical resistivity. Upon annealing at
high temperatures, larger amounts of dopant can dissolve into the silicon
grains, leading to a lower resistivity in subsequently quenched samples.
On slow cooling, the excess dopant is rejected to grain boundaries, leav-
ing behind a higher resistivity material.
[36]
Thus, the grain structure of the
films and the cooling rate will strongly affect the amount of solute
retained in the lattice and will thus determine the segregation and redis-
tribution behavior.
As far as thin-film reactions leading to compound formation are con-
cerned, the thermodynamic considerations correctly predict the outcome
of reactions. If the reaction leads to a decrease of total free energy, then
under suitable kinetic conditions, a reaction will proceed. On the other
hand, if the reaction does not lead to a lowering of free energy, it may not
Ch_05.qxd 11/29/04 6:19 PM Page 255

occur. Thus, by use of the free energy of formation data from thermody-
namics data in handbooks, we can safely predict the possibility of a reac-
tion occurring. In the absence of the free-energy data, we can use the heats
of formation to obtain a similar answer.
When a reaction between two metals occurs, the outcome generally is
a solid solution or one or more intermetallic compounds. Established
binary phase diagrams show the existence of such intermetallics. Even
with this knowledge, a realistic modeling of the interfacial reactions and
compound formation (and their impact on the properties) is very difficult
and complicated. An interfacial reaction can usually be treated as a binary
diffusion couple. For components of such a couple that exhibit a series of
equilibrium intermetallic phases across the alloy system, the prediction of
equilibrium thermodynamics is that the resultant diffusion zone will
include a series of bands with sharp boundaries, each band corresponding
to one of the intermetallics.
[37]
The width of a given band will depend on
a variety of competitive factors, such as the solubility range across the
phase and component diffusion coefficients within the band in relation to
those in adjacent phases. In this way, the chemical potential of each com-
ponent, the gradient of which is the fundamental driving force for diffusion,
will be continuous across the entire diffusion zone. Thus, at the interface
separating any pair of bands, say g and e, the chemical potentials are equal
for each component; that is, the phases at the interface may be in quasi-
equilibrium. However, the advanced state of reaction is, at best, only a ref-
erence point in relation to the initial reaction conditions.
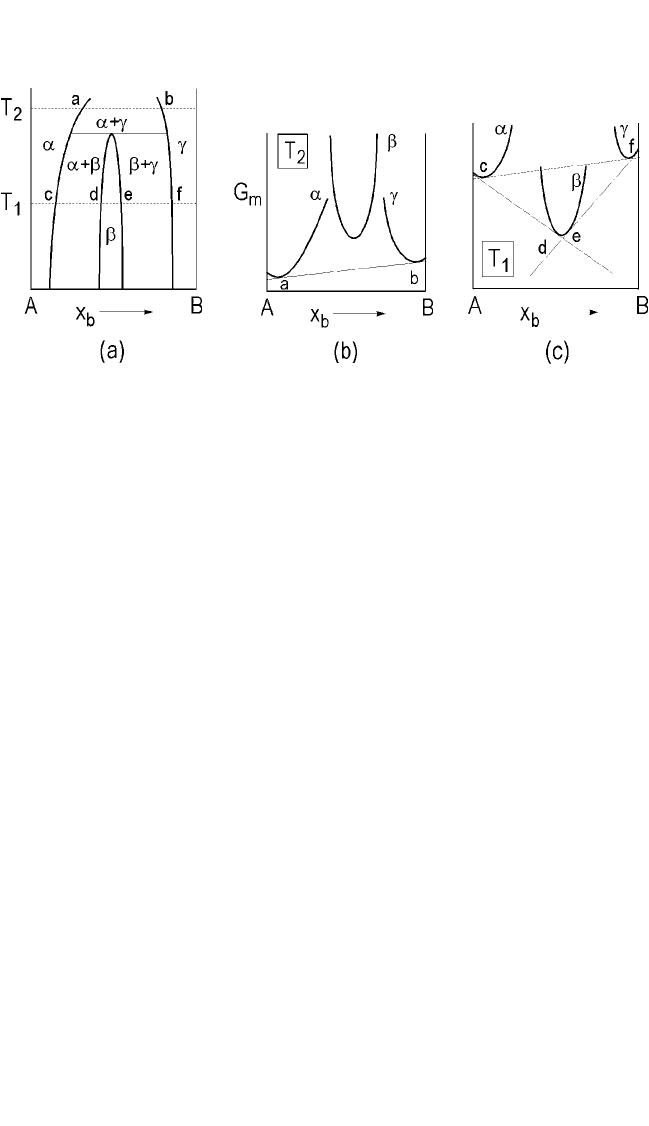
Figure 5.3(a) presents a portion of a binary equilibrium phase diagram
at constant pressure for a system A, B that forms a single intermetallic b.
The solid solubility limits for the thermal solid solutions a and g at tem-
perature T
1
are c and f, respectively. The intermetallic phase b exhibits a
range of solubility, d-e. The corresponding Gibbs free-energy-composition
diagram for this temperature is shown in Fig. 5.3(b) and (c), where the
common tangent construction, equivalent to the chemical potential equal-
ities of defining equilibrium, is included as solid straight lines. Note that
c, d, a, and f are points of tangency, with the metastable equilibrium a g
indicated by the dashed common tangent. For this system, the reaction
a g → b is a peritectoid reaction. Qualitatively, however, Fig. 5.3 would
be unchanged if the intermetallic b were congruently or peritectically
melting, rather than associated with a peritectoid reaction as shown.
In any event, this situation results from deposition of component B
(for example, copper) onto substrate A, at low enough temperature to pre-
vent any reaction during deposition. When a reaction does occur, limited
interdiffusion that creates terminal solutions very near the interface pre-
cedes the formation of any phase or phases. In such systems, a state of
metastable equilibrium involving a g tends to be established first, a
256 DIFFUSION PROCESSES IN ADVANCED TECHNOLOGICAL MATERIALS
Ch_05.qxd 11/29/04 6:19 PM Page 256
DIFFUSION BARRIERS IN SEMICONDUCTOR DEVICES, MURARKA 257
process that may be intercepted by nucleation of the intermetallic. This is
in contrast to the situation at the temperature T
2
(Fig. 5.3), which repre-
sents the stable state. With the formation of an intermetallic, as in the typ-
ical peritectoid case, the reacting components are physically separated as
the product phase forms. When the interface is covered with a new phase,
the thickening growth reaction requires diffusion through the intermetal-
lic layer, which may still be controlled by mass transport kinetics or by
interface reaction kinetics.
[37]
The actual situation, however, is usually quite different from such a
classical model. Realistic modeling of interfacial reactions and compound
formation require an analysis of experimental results obtained under
different conditions and for different combinations of layered diffusion
systems. Note that generally, not all the intermetallics reported in a phase
diagram are formed in thin-film couples. For example, in one of the com-
plex binary systems of Pt and Al, in thin-film reaction couples annealed in
the temperature range 200 to 500°C, only 6 of 12 possible phases were
detected.
[38]
In a relatively simple system of Ti reacting with silicon, only
three of the possible five phases have been reported.
[39]
On the other hand,
for the simple system of the thin-film couple of Mg and Cu, both reported
intermetallics have been detected.
[40]
Several factors determine the
absence of certain phases in thin-film couples: limited range of thickness,
atomic diffusivities in various phases, concentration gradients, tempera-
ture, free energies, impurities, nucleation and growth, and the amount of
material available during the interaction. The available amount of the
reacting material, measured by its thickness in films, also determines the
Figure 5.3. (a) Binary system A-B with one intermetallic; (b) and (c) molar free-
energy composition diagrams at T
2
and T
1
, respectively. Stable equilibrium is
shown by solid tangent and metastable equilibria by dashed lines.
Note: From C. W. Allen and A. G. Sargent, Mat. Res. Soc., 54:97 (1986).
Ch_05.qxd 11/29/04 6:20 PM Page 257

extent of intermetallic compound formed in the final product. Goselle and
Tu
[41]
have examined this aspect of the reaction between thin films, con-
sidering some of the factors mentioned here. The absence of the phases in
thin-film interaction products is explained on the basis of nucleation and
growth probabilities and diffusion across very thin phases that may not be
detected by the analytical techniques.
It is pointed out that the above-mentioned principles and discussions
also apply to ternary, quaternary, and other systems. However the phe-
nomena become very complicated, and reaction products difficult to predict.
Only experimental results, obtained under a defined set of conditions, pro-
vide an immediate answer.
Free Energy and Heat of Formation
Thermodynamic considerations predict the stability of a system under
given conditions. We are concerned about the adhesion of the APDB film
with the films it is separating under the conditions of forming such struc-
tures and in actual use. Afilm is said to adhere well to the substrate if all
film-substrate interfaces are not physically affected during the fabrication
or service, even when exposed to a reasonably high level of stress. Thus
to promote adhesion, we must ensure (1) excellent physical and chemical
bonding, preferably the latter, since it is energetically more favorable,
across the substrate-metal film interface, and (2) low levels of stress in the
film arising from the device/circuit fabrication processes. Reasonable
assumptions have led to the conclusion that for good adhesion, chemical
interactions leading to the interatomic bonding at the desired interface are
essential Such interactions must, however, be self-limiting so that only a
very thin layer (preferably a monolayer or two) of the interfacial reaction
product results. In addition, stresses must be kept below a level of
∼0.5 Gpa (5 10
9
dyn/cm
2
).
[42]
To ensure adhesion, we must also ensure
the absence of easy deformation/fracture modes, reactive environments
that produce stress, and long-term degradation modes.
For example, Al adheres well to oxides, nitrides, carbides, silicides, and
Si. On the other hand, copper does not bond well with the surfaces of the
same materials. The difference is reflected in the energies of formation of the
metal oxide, nitride, carbide, and silicide, or in the metal-nonmetal diatomic
bond strengths. It is thus apparent that the deposition of Cu directly on SiO
2
or on a typical polymer interlayer dielectric will not provide the needed adhe-
sion at the interface. Note, however, that the energies of formation of the Cu
fluoride and sulphate are high and are comparable to those of silicon com-
pounds, but are not as high as those of Al compounds. We can then postulate
that if the ILD surface is terminated in a (F) and/or (SO
4
) species, Cu may
258 DIFFUSION PROCESSES IN ADVANCED TECHNOLOGICAL MATERIALS
Ch_05.qxd 11/29/04 6:20 PM Page 258

DIFFUSION BARRIERS IN SEMICONDUCTOR DEVICES, MURARKA 259
form bonds with such species and thus form an interfacial layer to provide
the necessary adhesion between the ILD and Cu. Thicker interfacial layers of
these types should, however, be avoided to eliminate the tendency of crys-
tallization of these compounds at the interface.
Temperature
Temperature is perhaps the most important parameter in determining
the need and usefulness of the APDB between two films it is separating.
Our goal is to process sets of films under optimized process conditions,
then to use the product under so-called operating conditions. We can
either choose the process and use a temperature/time combination to suit
the given APDB, or select the APDB to survive the given process and tem-
perature/time combination. Classically, a 450°C, 30- to 60-minute annealing
in hydrogen-containing ambients has been used for Al metallization
schemes. Presently, Cu has replaced A, and new low-dielectric-constant
ILDs are being developed to replace SiO
2
. These changes are leading to
post-metal anneals as low as 300°C. In multilevel metallization schemes,
such anneals are repeated every time a new layer of metal interconnects is
created. Thus, the first APDB layer at the contact level may experience
several of these anneals plus those (around 300 to 450°C for about
30 minutes) used during packaging of these chips. It is safe to say that
concerns related to the stability of the APDB and metal layers at the
process temperatures are becoming fewer.
The temperature rise during the device or circuit in use is increasing
with the continued miniaturization of the devices and circuits. However,
the operating device/circuit temperature is still expected to be lower than
the process temperature. Now we are concerned with the combined effect
of applied field and temperature on the stability of the APDB used.
Because lower temperatures will reduce the impact of increasing electric
fields, an efficient way to dissipate heat away from the active circuits is
becoming a major challenge.
Electric Field
The final applicability of the APDB films will be determined by the
stability of the electrical properties of the devices/circuits in which such
films are used. In most cases, the metallurgical stability, first determined
by the experiments that perform diffusion analyses and identify phase
changes, is found to determine the effectiveness of the APDB. These obser-
vations, however, do not guarantee the electrical stability when the films
Ch_05.qxd 11/29/04 6:20 PM Page 259

are subjected to high electric fields and current densities. It is thus neces-
sary to determine the two stabilities independently, especially now when
new materials such as Cu and low-k ILD are being introduced and film
thickness, particularly that of the APDB, is being reduced.
When using the APDB films on semiconductors, such as during the
formation of contacts, the electrical stability of a p-n junction and/or the
Schottky-type contacts is examined as a function of the annealing tem-
perature, time, and ambient. Changes from the idealized (or control) current-
voltage (I-V) behavior are noted and analyzed to determine the stability
and reliability under the actual fabrication and use conditions.
When the APDB layers are formed between the dielectric (ILD) and
the interconnections (Cu or Al), their electrical stability has to be fully
determined. This is done by examining their capacitance-voltage (C-V),
current-voltage (I-V), capacitance-time (C-t), and current-time (I-t) char-
acteristics. Furthermore, triangular voltage sweep characteristics, charge
and voltage-to-breakdown, in-plane and out-of-plane k, and dielectric-
loss measurements of a metal-insulator semiconductor and/or a metal-
insulator-metal capacitor need to be measured. Bias-temperature stressing
(BTS) during C-V and I-V measurements determines the electrical stabil-
ity under simulated use conditions. Exposure to invading environments
(high humidity and temperature) during such tests challenges the reliabil-
ity. The I-V measurements illustrate the dielectric strength, charge trap-
ping, and conduction mechanisms. Any metallic penetration, in general,
will change these characteristics and thus determine the usefulness of the
APDB used.
5.4 Diffusion Barrier Materials
Many investigations of diffusion barrier materials have been carried
out over the past four decades. This section reviews materials used as the
APDBs between silicon or silicide and Al, and between SiO
2
and Cu.
5.4.1 Metal Nitrides, Carbides, and Borides as
APDB Used with Al
Table 5.1 summarizes the reported effectiveness of various refractory
metal nitrides, carbides, and borides as APDB materials between Si or
silicide and Al. All the refractory materials have very high melting points
and are effective barriers up to at least 500°C. They all qualify, therefore,
for silicon integrated circuit applications in the thicknesses used in these
qualifying experiments (in the range of approximately 40 to 200 nm).
260 DIFFUSION PROCESSES IN ADVANCED TECHNOLOGICAL MATERIALS
Ch_05.qxd 11/29/04 6:20 PM Page 260

DIFFUSION BARRIERS IN SEMICONDUCTOR DEVICES, MURARKA 261
Besides high melting point, what makes these nitrides, carbides, and
borides so effective as an APDB? These films are generally deposited by
reactive sputtering at or near room temperature and thus have a very small
grain size and a high density of fast diffusion paths. Deposited films are,
in general, in a state of compressive stress, possibly as a result of a small
excess of nitrogen, carbon, boron, and/or oxygen. This excess of nitrogen,
Table 5.1. High-Melting Diffusion Barriers Between a Substrate and Al
Metallization: Nitrides, Carbides, and Borides
Barrier Temperature
*
Intermetallics
Material Substrate (°C) Detected References
TiN Si 550 a
TiSi
2
550 a, b, c
PtSi 600 AlN, Al
3
Ti d, e, f
CoSi
2
550 d
NiSi 500 g
ZrN Si 550 Al
4
Zr
3
Si
5
h
HfN Si 500 i
TaN NiSi 600 AlN, Al
3
Ta e
Ta N Pd Si 550 j
CoSi
2
550 j
TiC Si 500 k
PtSi 600 Al
4
C
3
, Al
3
Ti f
TiSi
2
500 k, l
CoSi
2
500 Co
2
Al
9
l
ZrB Si 600 m
*
Temperature at which the reaction is first observed.
a. C. Y. Ting, J. Vac. Sci. Technol., 21:14 (1982)
b. N. Cheung, H. Von Seefeld, and M.-A. Nicolet, Proc. Symp. on Thin Film Interfaces and
Interactions (J. E. E. Baglin and J. M. Poate, eds.), Electrochem Soc., Princeton, NJ (1980),
p. 323
c. C.-Y. Ting and M. Wittmer, Thin Solid Films, 96:327 (1982)
d. R. J. Schutz, Thin Solid Films, 104:89 (1983)
e. M. Wittmer, Appl. Phys. Lett., 37:540 (1980)
f. M. Wittmer, J. Appl. Phys., 53:1007 (1982)
g. M. Finetti, I. Suni, and M.-A. Nicolet, J. Electron. Mater., 13:327 (1984)
h. L. Krusin-Elbaum, M. Wittmer, C.-Y. Ting, and J. J. Cuomo, Thin Solid Films, 104:81 (1983)
i. I. Suni, M. Maenpaa, and M.-A. Nicolet, J. Electrochem. Soc., 130:1215 (1983)
j. M. A. Farooq, S. P. Murarka, C. C. Chang, and F. A. Baiocchi, J. Appl. Phys., 65:3017 (1989)
k. M. Eizenberg, S. P. Murarka, and P. A. Heimann, J. Appl. Phys., 54:3195 (1983)
l. A. Applebaum and S. P. Murarka, J. Vac. Sci. Technol., A4:637 (1986)
m. J. R. Shappiro, J. J. Finnegan, and R. A. Lux, J. Vac. Sci. Technol., B4:1409 (1986)
Ch_05.qxd 11/29/04 6:20 PM Page 261