Hatano Y., Katsumura Y., Mozumder A. (Eds.) Charged Particle and Photon Interactions with Matter - Recent Advances, Applications, and Interfaces
Подождите немного. Документ загружается.

400 Charged Particle and Photon Interactions with Matter
Turner, J. E., Magee, J. L., Hamm, R. N., Chatterjee, A., Wright, H. A., and Ritchie, R. H. 1981. Early events in
irradiated water. In Seventh Symposium on Microdosimetry, Oxford, U.K., September 8–12, 1980, J. Booz,
H. G. Ebert, and H. D. Hartel (eds.), pp. 507–520. London, U.K.: Harwood Academic.
Turner, J. E., Magee, J. L., Wright, H. A., Chatterjee, A., Hamm, R. N., and Ritchie, R. H. 1983. Physical and
chemical
development of electron tracks in liquid water. Radiat. Res. 96: 437–449.
Turner,
J. E., Hamm, R. N., Wright, H. A., Ritchie, R. H., Magee, J. L., Chatterjee, A., and Bolch, W. E. 1988.
Studies to link the basic radiation physics and chemistry of liquid water. Radiat. Phys. Chem. 32: 503–510.
Uehara, S. and Nikjoo, H. 2006. Monte Carlo simulation of water radiolysis for low-energy charged particles.
J. Radiat. Res.
47: 69–81.
Usher,
F. L. 1911. Die chemische Einzelwirkung und die chemische Gesamtwirkung der α- und der β-Strahlen.
Jahrb. Radioakt. Elektron.
8: 323–334.
von
Sonntag, C. 2006. Free-Radical-Induced DNA Damage and Its Repair. Berlin, Germany: Springer-Verlag.
Ward, J. F. 1994. The complexity of DNA damage: Relevance to biological consequences. Int. J. Radiat. Biol.
66:
427–432.
Wasselin-Trupin,
V., Baldacchino, G., Bouffard, S., Balanzat, E., Gardès-Albert, M., Abedinzadeh, Z., Jore, D.,
Deycard, S., and Hickel, B. 2000. A new method for the measurement of low concentrations of
OH/O
2
−
radical species in water by high-LET pulse radiolysis. A time-resolved chemiluminescence study.
J. Phys. Chem. A
104: 8709–8714.
Wasselin-Trupin,
V., Baldacchino, G., Bouffard, S., and Hickel, B. 2002. Hydrogen peroxide yields in water
radiolysis
by high-energy ion beams at constant LET. Radiat. Phys. Chem. 65: 53–61.
Watt,
D. E. 1996. Quantities for Dosimetry of Ionizing Radiations in Liquid Water. London, U.K.: Taylor &
Francis.
Werner, U., Beckord, K., Becker, J., Folkerts, H. O., and Lutz, H. O. 1995a. Ion-impact-induced fragmentation
of
water molecules. Nucl. Instrum. Methods Phys. Res. B 98: 385–388.
Werner,
U., Beckord, K., Becker, J., and Lutz, H. O. 1995b. 3D imaging of the collision-induced Coulomb
fragmentation
of water molecules. Phys. Rev. Lett. 74: 1962–1965.
Wilson,
C. D., Dukes, C. A., and Baragiola, R. A. 2001. Search for the plasmon in condensed water. Phys. Rev.
B
63: 121101.
Yamashita,
S., Katsumura,Y., Lin, M., Muroya,Y., Maeyama, T., and Murakami, T. 2008. Water radiolysis with
heavy ions of energies up to 28 GeV – 2: Extension of primary yield measurements to very high LET
values.
Radiat. Phys. Chem. 77: 1224–1229.
Zimbrick,
J. D. 2002. Radiation chemistry and the Radiation Research Society: A history from the beginning.
Radiat. Res.
158: 127–140.
Zirkle,
R. E., Marchbank, D. F., and Kuck, K. D. 1952. Exponential and sigmoid survival curves resulting from
alpha
and X irradiation of aspergillus spores. J. Cellular Comp. Physiol. 39 (Suppl. 1): 75–85.

401
15
Radiation Chemistry of High
Temperature
and Supercritical
Water
and Alcohols
Mingzhang Lin
Japan Atomic Energy Agency
Tokai,
Japan
Yosuke Katsumura
The University of Tokyo
Tokyo,
Japan
and
Japan
Atomic Energy Agency
Tokai, Japan
Contents
15.1 Introduction ..........................................................................................................................402
15.2 Initial
Processes of Water Radiolysis ...................................................................................404
15.3
Experimental
Methods .........................................................................................................404
15.4
Optical
Absorption Spectral Properties of Free Radicals in High Temperature
andSupercritical
Water and Alcohols..................................................................................405
15.4.1
Solvated Electrons ....................................................................................................406
15.4.1.1 In
Pure Water.............................................................................................406
15.4.1.2
Density
Effects on the Absorption Spectra of e
aq
−
.....................................407
15.4.1.3 In
Concentrated Aqueous Inert Salts.........................................................408
15.4.1.4
In
Simple Alcohols.....................................................................................408
15.4.1.5
In
Polyalcohols...........................................................................................409
15.4.2
•
OH Radical .............................................................................................................. 410
15.4.3 Other
Transient Species............................................................................................ 410
15.5
Radiolytic
Yields of Water Decomposition Products ........................................................... 411
15.5.1
G(e
aq
−
) ....................................................................................................................... 411
15.5.2 {G(e
aq
−
) + G(OH) + G(H)}........................................................................................ 413
15.5.3 G(OH) ....................................................................................................................... 414
15.5.4 G(H).......................................................................................................................... 415
15.6 Rate
Constants...................................................................................................................... 415
15.6.1
Reactions
with e
aq
−
.................................................................................................... 416
15.6.1.1 Ionic
Reactants........................................................................................... 416
15.6.1.2
Hydrophobic
or Neutral Species................................................................ 417
15.6.2
Reactions
with
•
OH Radical ..................................................................................... 418
15.7 Monte
Carlo and Molecular Dynamics Simulations ............................................................ 419
15.7.1
Solvation
Dynamics of e
aq
−
in SCW ......................................................................... 419

402 Charged Particle and Photon Interactions with Matter
15.1 introduCtion
A supercritical uid is a highly compressed material that combines the properties of gases and
liquids in an intriguing manner, at a temperature and pressure above its critical point. Additionally,
close to the critical point, small changes in pressure or temperature result in large changes in den-
sity, allowing many properties to be “tuned.” Due to their peculiar solvent properties, supercritical
uids offer a range of unusual chemical possibilities including environmentally benign separations
and destruction of hazardous waste, as well as for new materials synthesis (Jessop et al., 1994; Savage
et al., 1995; Eckert et al., 1996; Darr and Poliakoff, 1999; Akiya and Savage, 2002). Figure 15.1
shows the schematic representation of phase diagrams for water and carbon dioxide. The thermo-
physical properties of water and of many other uid systems have been formulated and/or compiled
by the National Institute of Standards and Technology (NIST) and the International Association
for the Properties of Water and Steam (IAPWS). In Table 15.1, the critical properties are shown for
some
components that are commonly used as supercritical uids.
Studies
of the radiolysis of supercritical water (t
c
= 374°C, P
c
= 22.1MPa) were motivated by the
development of one of the next-generation (GenIV) nuclear reactors—the supercritical water-cooled
reactor (SCWR) (Oka and Kataoka, 1992; Squarer et al., 2003). This new-concept reactor has the
advantages of higher thermal conversion efciency, simplicity in structure, safety, etc. In these reac-
tors, as in boiling water (BWR) and pressurized water reactors (PWR), light water or heavy water is
used as both a coolant and a moderator. The water is exposed to a strong radiation eld (>10kGy/s)
composed of γ-rays and 2MeV fast neutrons, etc. As is well known in the BWR and PWR, two
radiolysis products of water, O
2
and H
2
O
2
, strongly affect the corrosion of structural materials in the
reactors. Proper water chemistry control, in particular the injection of H
2
into the coolant to convert
O
2
and H
2
O
2
into H
2
O by radiolytic processes, effectively reduces the electrochemical corrosion
15.7.2 Spectral
Shift of Solvated Electron .......................................................................... 419
15.7.3
Temporal
Behaviors of the Hydrated Electron ......................................................... 419
15.8
Concluding Remarks ............................................................................................................420
Acknowledgments..........................................................................................................................420
References...................................................................................................................................... 420
7.38 22.1
0.0006
H
2
O
CO
2
0 374
31.1
Temperature (°C)
Liquid
Solid
Gas
Subcritical
Triple point
Critical point
Supercritical
Pressure (MPa)
Figure 15.1 Schematic phase diagrams of carbon dioxide and water (H
2
O).

Radiation Chemistry of High Temperature and Supercritical Water and Alcohols 403
potential (ECP), and represents the key to maintaining the integrity of the reactors. Computer
simulations are usually required to help predict the concentrations of water decomposition prod-
ucts. These simulations require a knowledge of the temperature-dependent G-values (denoting the
experimentally measured radiolytic yields, with units of molecules/100eV in this context) and rate
constants for about 50 reactions. The rate constants and G-values of the radiolysis of light and
heavy water over the range 0°C–300°C have been compiled by Elliot (1994) (Elliot et al., 1996)
and reviewed by Buxton (2001), although most reactions were investigated only up to 200°C. It is
assumed that a similar simulation of water radiolysis in the SCWR will be required. As is known,
BWRs or PWRs are operated at constant temperature (280°C–325°C) and pressure (15–20MPa).
However, according to the current conceptual design of SCWR, the inlet temperature is 280°C and
the outlet temperature is >500°C with a xed pressure of 25MPa (Oka and Kataoka, 1992; Squarer
et al., 2003). Thus, it is necessary to accumulate the basic data on water radiolysis above 325°C,
especially
for supercritical water that possesses many unusual properties.
In
supercritical water, the dielectric constant dramatically decreases from 78 at room temperature
to 2.6 at 400°C/25MPa, which is similar to that of benzene or toluene. Thus many organic compounds
can be easily dissolved in SCW although these compounds have rather low solubility at room tem-
perature. Contrarily, inorganic salts are difcult to dissolve in SCW due to their extremely small ion
products. It has been reported that the water structure exhibits a remarkable change in SCW (Tucker
and Maddox, 1998). For liquid water, structural studies by both neutron and x-ray scattering indicate
that when water is placed under pressure, the number of hydrogen bonds per water molecule does not
change by any appreciable amount relative to the ambient state; however, they are now bent out of
their ideal orientation and are correspondingly weaker energetically. Liquid structure at high pressure
is nearly independent of temperature variation. But for supercritical water, investigation extends over
isochores between 0.05 and 1g/mL and isotherms between 473 and 1273K. As water is heated into
subcritical and supercritical regimes, the number of hydrogen bonds per water molecule has been
shown to decrease (Hoffmann and Conradi, 1997). The temperature at which the total breakdown of
hydrogen bonding could be observed has been debated for many years, with most recent experimental
studies, including neutron scattering (Soper et al., 1997), Raman spectroscopy (Ikushima et al., 1998),
solution x-ray scattering (Ohtaki et al., 1997), NMR (Hoffmann and Conradi, 1997; Matubayasi et al.,
1997), and microwave spectroscopy (Okada et al., 1997), suggesting that tetrahedral bonding persists
to at least 650K and possibly up to 770K at 100MPa. The normally compact tetrahedral-like water
structure is decomposed and long-distance water–water interactions increase. Thus, supercritical
water consists of small clusters, and much smaller aggregates such as oligomers, and even monomeric
table 15.1
Critical
p
roperties
of v
arious
s
olvents
solvent
molecular
weight
g/mol
Critical
temperature (t
c
)
k
Critical
pressure (P
c
)
mpa
Critical
density (ρ
c
)
g/cm
3
Carbon dioxide (CO
2
) 44.01 304.1 7.38 0.469
Water
(H
2
O) 18.015 647.096 22.064 0.322
Methanol
(CH
3
OH) 32.04 512.6 8.09 0.272
Ethanol
(C
2
H
5
OH) 46.07 513.9 6.14 0.276
1-Propanol
(C
3
H
7
OH) 60.10 263.6 5.175 0.274
2-Propanol
(C
3
H
7
OH) 60.10 235.2 4.762 0.273
1-Butanol
(C
4
H
9
OH) 74.12 289.9 4.423 0.270
Methane
(CH
4
) 16.04 190.4 4.60 0.162
Ethane
(C
2
H
6
) 30.07 305.3 4.87 0.203
Propane
(C
3
H
8
) 44.09 369.8 4.25 0.217
Ethylene
(C
2
H
4
) 28.05 282.4 5.04 0.215

404 Charged Particle and Photon Interactions with Matter
gas-like water molecules (Ohtaki et al., 1997). It is expected that the changes of these properties would
change G-values, rate constants, and the spectral properties of the transient species of water radiolysis.
In this chapter, we summarize the most recent results obtained in studies of the radiation chem-
istry of SCW, especially the estimation of G-values, the reaction rate constants, and the absorption
spectral properties of some transient species. For comparison or better understanding of SCW, some
results concerning the radiolysis of alcohols are also presented.
15.2 initial proCesses oF water radiolysis
Irradiation with electron beam, γ-rays, or high-energy charged particles leads to the decomposition
of water molecules through excitation and ionization, and the initial processes of water radiolysis
can
be summarized as (Swiatla-Wojcik and Buxton, 1995)
H O H O e H O
e
2 se 2 vib2
γ,
*
−
→ + →
+ −
OH + H
2H + O(
3
P)
H
2
O
*
vib
H
2
+ O(
1
D) H
2
+ H
2
O
2
(or 2OH)
H O H OH
2 aq
+ +
→ +
e H O OH H OH H OH
se 2 2
− − −
+ → + → + +
e H O e
se 2 aq
− −
+ →
OH + H
2H + O(
3
P)
H
2
O
*
elec
H
2
+ O(
1
D)
H
2
+ H
2
O
2
(or 2OH)
Electrons are stabilized by the surrounding water molecules to form hydrated electrons in less than
1ps. The yields at this stage are dened as initial yields. The resulting transient species such as
e
aq
−
,
•
H, and
•
OH are distributed locally along the track where the energy deposits, called a spur.
These products then diffuse randomly and either react together or escape into the bulk solution.
After the completion of spur processes, which take place within 10
−7
–10
−6
s, the products homoge-
neously distribute in the solution, and the yields at this time are known as primary yields. Since the
increase of temperature and changes in water properties and structure strongly affect the spur reac-
tions, some interesting changes in the radiolytic yields under supercritical conditions are expected.
15.3 experimental methods
Currently, most transient species kinetic studies are carried out using nanosecond pulse radiolysis
techniques associated with spectroscopic detection methods. Only a few reports are of muonium
reactions (Percival et al., 1999, 2000; Ghandi and Percival, 2003), steady state radiolysis (Miyazaki
Radiation Chemistry of High Temperature and Supercritical Water and Alcohols 405
et al., 2006a,b; Janik et al., 2007a), laser photolysis (Lin et al., 2006a; Han et al., 2008), and pico-
second pulse radiolysis (Baldacchino et al. 2006). Since conventional pulse radiolysis techniques
are well known, we just briey introduce here the high-temperature high pressure (HTHP) system
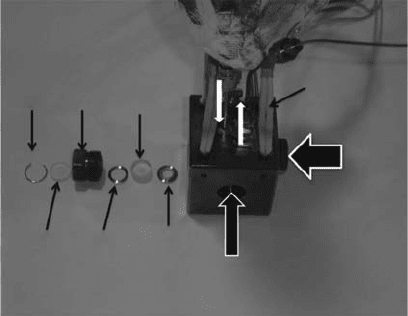
for pulse radiolysis (Ferry and Fox, 1998; Takahashi et al., 2000; Wu et al., 2000). The structure of the
HTHP
optical cell is shown in Figure 15.2.
The
size, structure, and sealing mechanism of the optical windows of the cell may vary, but the
HTHP system usually consists of a preheater and an optical cell made of high-strength and corro-
sion-resistant alloys such as Hastelloy or SUS316 with sapphire windows. At least one thermocouple
should be put into the sample solution inside the cell to monitor the temperature. Some special
consideration and sometimes compromise are necessary for obtaining a system with good signal-to-
noise (S/N) ratio, less dead volume, quick temperature equilibration, faster ushing of the cell, etc.
The
main difculties for the pulse radiolysis experiments of SCW are listed below:
•
Corrosion and damage of the sapphire windows: The sapphire window is easily corroded
in SCW, especially under acidic or alkaline conditions, or in the presence of some addi-
tives, such as O
2
.
•
Thermal stability of chemical reagents: Most organic compounds are thermally unstable
at
elevated temperatures.
•
Solubility of inorganic compounds: The dissociation constant is rather small for salts under
supercritical conditions.
• Limitation of detection techniques: Dramatically decreasing signal intensity for low-density
SCW; many reactions become much faster than at room temperature, requiring a higher-time-
resolution pulse radiolysis system.
15.4 optiCal absorption speCtral properties oF Free radiCals
in
h
igh
t
emperature
and s
uperCritiCal
w
ater
and a
lCohols
A pulse radiolysis system combined with a time-resolved optical absorption measurement allows
us to study radiation chemical processes such as the radiolytic yields of transient species and reac-
tion rate constants. The absorption spectrum that is useful for the identication of the intermediate
radical is usually investigated as a rst step. In cases of supercritical water and alcohols, studies
on spectral properties are particularly important because the solvent properties may change with
temperature and pressure. In turn, the identication of spectral changes might be helpful for a better
understanding
of solvent properties and solvent molecular structure at elevated temperatures.
Stop
ring
Metal
fittings
Sapphire
window
Preheater
Heater
160 W×4
Analyzing
light
e
–
beam
Washer and
TTS seal
WasherQuartz
window
Figure 15.2 Picture of the HTHP cell used at the University of Tokyo and the sealing mechanism of the
optical
windows.

406 Charged Particle and Photon Interactions with Matter
15.4.1 Solvated electronS
The solvated electron is an ubiquitous species in radiation chemistry, resulting from secondary
electrons generated in polar solvents by ionizing radiations such as fast electrons and
60
Co γ-rays
(Hart and Anbar, 1970; Bernas et al., 1996). In fact, secondary (or “dry”) electrons slow down to
subexcitation energies, and following thermalization become localized and eventually solvated. In
liquid water at 25°C, spectroscopic studies have revealed that electron “localization” and “hydra-
tion” occur on timescales of ∼110–300 and ∼240–620fs, respectively (Bernas et al., 1996; Jay-Gerin,
1997; Muroya et al., 2002; Wang and Lu, 2007). The optical absorption of e
aq
−
is characterized by a
broad, intense, and featureless spectrum that covers most of the visible, tails into the near-infrared,
and exhibits a maximum at λ
max
= 718nm (or E
max
= 1.73eV) in H
2
O and λ
max
= 699 nm (or E
max
=
1.77eV) in D
2
O at 25°C (Bartels et al., 2005). The hydrated electron was discovered by transient
absorption measurements in the pulse radiolysis of water about 50 years ago (Hart and Boag, 1962;
Boag and Hart, 1963; Keene, 1963). Then, it was soon detected in various solvents through its
intense optical absorption band in the visible or near-infrared spectral domain (Jou and Freeman,
1979a,b). The properties of the solvated electron depend on several factors such as the solvent, the
temperature, or the pressure. Much attention has been paid to the temperature effects on the absorp-
tion spectra of the solvated electron since the discovery of the hydrated electron. However, there was
no
systematic study of the solvated electron in supercritical water and alcohols until 10 years ago.
15.4.1.1
in
p
ure
w
ater
Temperature effects on e
aq
−
have been extensively studied using the pulse radiolysis technique and
the absorption maximum of e
aq
−
spectrum is found to shift to longer wavelengths with increasing
temperature. Typical temperature-dependent absorption spectra of e
aq
−
in D
2
O at 25MPa from room
temperature to 390°C is given in Figure 15.3. The absorbance largely decreases with temperature
because the water density decreases and the decay of e
aq
−
is accelerated with increasing tempera-
ture, as shown in the inset. In the 1970s and 1980s, the investigated temperatures were usually
0.8
0.6
0.6
0.4
0.4
0.2
0.2
0.0
0.0
1.0
0 0.4 0.8
T (μs)
1.2 1.6
1.5 2.0
390°C
380°C
25°C
25°C
Energy (eV)
Absorbance
Absorbance
2.5 3.0 3.5 4.0
Figure 15.3 Absorption spectra of hydrated electron in D
2
O under a pressure of 25 MPa at temperatures:
25°C, 50°C, 100°C, 150°C, 200°C, 250°C, 300°C, and 390°C. Inset: time proles at different temperatures of
hydrated
electron at λ
max
of each temperature.
Radiation Chemistry of High Temperature and Supercritical Water and Alcohols 407
within 100°C–300°C, not exceeding the critical temperature of water (Gottschall and Hart, 1967;
Dixon and Lopata, 1978; Jou and Freeman, 1979b; Christensen and Sehested, 1986; Shiraishi et al.,
1994). There was one report on the e
aq
−
spectrum at temperatures up to 390°C below the critical
pressure, but the information provided was very limited (Michael et al., 1971). In 2000, Wu et al.
reported temperature dependences of the e
aq
−
spectrum and Gε
max
by the pulse radiolysis method
over a temperature range of 25°C–400°C including the supercritical condition (Wu et al., 2000).
With increasing temperature, the absorption peak λ
max
of e
aq
−
shifts signicantly to longer wave-
lengths. The value of Gε
max
in supercritical water is considerably smaller than in liquid water at
room temperature. A later study reported by Bartels et al. showed that the e
aq
−
spectrum at super-
critical temperatures shifts slightly to the red as density decreases (Bartels et al., 2005). With the
application of spectral moment theory, Bartels et al. estimated the average size of the electron wave
function and of its kinetic energy. It appears that for water densities below about 0.6g/cm
3
, and
down to below 0.1g/cm
3
, the average radius of gyration for the electron remains constant at around
3.4Å, and its absorption maximum is near 0.9eV. For higher densities, the electron is squeezed into
a
smaller cavity and the spectrum is shifted to the blue.
The
fact that e
aq
−
does exist in SCW and even persists at densities as low as ∼8 × 10
−3
g/cm
3
(limit
of the study) (Jortner and Gaathon, 1977) indicates that the electron experiences a strong interac-
tion with the neighboring water molecules, implying a dominant role of the short-range molecular
structure
in the microscopic description of the electron localization and hydration mechanisms.
15.4.1.2
density
e
ffects
on the a
bsorption
s
pectra
of e
aq
−
From a microscopic perspective, many of the unique features of SCW are due, in large part, to the
changes that take place in the intermolecular structure and hydrogen bonding of water at elevated
temperatures. In fact, a wide variety of experimental investigations as well as molecular-based
computer simulations in the last decade have shown that, at supercritical conditions, the innite
H-bond network of the molecules present in ambient water crosses a percolation transition, that is,
breaks down to form small clusters of bonded water molecules in various tetrahedral congurations
surrounded by nonbonded gas-phase-like molecules (Ohtaki et al., 1997; Tucker and Maddox, 1998;
Partay and Jedlovszky, 2005; Wernet et al., 2005). As a result, the instantaneous picture of SCW
can be viewed as that of an inhomogeneous medium with coexisting high- and low-density regions.
The absorption spectra of the hydrated electron have been measured by the electron pulse radi-
olysis techniques in supercritical water (D
2
O) at different temperatures and densities (or pressures)
(Jay-Gerin et al., 2008). Over the density range studied (∼0.2–0.65g/cm
3
), the e
aq
−
absorption maxi-
mum is found to shift only slightly to the red with decreasing density, in agreement with previous
work. Assembling the present data together with those already reported in the literature in sub-
critical and supercritical water shows that
E
A
max
varies linearly (in a double logarithmic plot) with
density for the various temperatures investigated (namely, 350°C, 375°C, 380°C, 390°C, and 400°C)
and that the resulting lines are all parallel (within the experimental uncertainties). The temperature
dependence of
E
A
max
in subcritical and supercritical D
2
O further reveals that, at a xed pressure
(25MPa),
E
A
max
decreases monotonically with increasing temperature in passing through the liquid-
SCW phase transition at t
c
, but exhibits a minimum at a xed density (0.2 and 0.65g/cm
3
) as the
water passes above t
c
into SCW, as shown in Figure 15.4. These behaviors can be understood by
means of simple microscopic arguments based on the changes that occur in the water properties and
water structure in the subcritical and supercritical water regimes. Most importantly, the role of local
density and molecular congurational uctuations (associated with criticality) in providing preex-
isting polymeric clusters that act as trapping sites for the excess electron is a pivotal point in the
interpretation of the data. By comparison with the (H
2
O)
n
−
cluster data of Ayotte and Johnson (1997)
and Coe (2001), in SCW at 400°C, the average cluster size is estimated to be ∼32 water molecules
for ρ = 0.65g/cm
3
and ∼26 for ρ = 0.2g/cm
3
, respectively. These cluster size values are consistent
with reported experimental clustering data on (H
2
O)
n
−
ions, indicating that interior-bound excess
electron states are energetically favored in these subcritical and supercritical regions. Electrons

408 Charged Particle and Photon Interactions with Matter
residing in such clusters can, alternatively, be viewed as microscopic probes of the local structure
of their host environment, and as such, electron solvation experiments present a powerful tool for
future studies of the localization of excess electrons in subcritical and supercritical water where the
dominant
role of short-range electron–water interactions is clearly afrmed.
15.4.1.3
in
Concentrated a
queous
i
nert
s
alts
The absorption spectra of the hydrated electron in deuterated water solutions containing different con-
centrations of LiCl, LiClO
4
, MgCl
2
, or Mg(ClO
4
)
2
were measured by pulse radiolysis techniques from
room temperature to 300°C at a pressure of 25MPa (Lin et al., 2007a; Kumagai et al., 2008). The
results show that when the temperature is increased and the density is decreased, the absorption spec-
trum of the electron in the presence of a metallic cation is shifted to lower energies. Quantum classical
molecular dynamics (QCMD) simulations (Nicolas et al., 2003) of an excess electron in bulk water and
in the presence of a lithium cation have been performed to compare with the experimental results. The
excess electron was treated only quantum mechanically, using the Born–Oppenheimer approximation.
The other interactions were described by various empirical models. According to the simulations, the
change in the shape of the spectrum is due to one of the three p-like excited states of e
aq
−
destabilized
by core repulsion. The study of s → p transition energies for the three p excited states reveals that for
temperatures higher than room temperature, there is a broadening of each individual s → p absorption
band due to a less structured water solvation shell. The increase in the temperature and the increase in
the concentration of the nonreactive metal cation have opposite effects. With increase in temperature,
the absorption spectra of the solvated electron shifts to the red whereas in the presence of a salt it shifts
to the blue. When both effects are present, the shift intensity and the shape of the absorption spectra are
modied. However, the effect of the temperature on the absorption spectrum of the solvated electron is
stronger than that of the presence of nonreactive metal cation even up to 4M Li
+
ion.
15.4.1.4 in
s
imple
a
lcohols
Although the absorption spectra of the solvated electron in simple alcohols were extensively studied
in the 1970s, especially by the group of G.R. Freeman, no attention was paid to their behaviors
under supercritical conditions. Recently, the absorption spectra in methanol, ethanol, 1-propanol,
2-propanol, and 1-butanol were measured from room temperature to supercritical conditions by Han
et al. (Han, 2005; Han et al., 2005, 2008) by using both electron beam pulse radiolysis and laser ash
1.10
1.05
1.00
0.95
0.90
0.85
340 360 380
Temperature (°C)
ρ=0.2 g/cm
3
E
A
max
(eV)
ρ=0.65 g/cm
3
370.7°C
t
c
400
Figure 15.4 Energy of maximum absorption (
E
A
max
) for e
aq
−
in subcritical and supercritical water (D
2
O)
as a function of temperature at two different water densities: 0.2 and 0.65 g/cm
3
. (⚫) Jay-Gerin et al. (2008),
(◾)Bartels
et al. (2005), and (
▲) Jortner and coworkers (Gaathon et al., 1973; Jortner and Gaathon, 1977).
Radiation Chemistry of High Temperature and Supercritical Water and Alcohols 409
photolysis techniques. In laser photolysis, the solvated electron is produced by photodetachment of
electrons from the I
−
anion dissolved in the alcohols. Because of a redshift of the charge-transfer-
to-solvent absorption band of the I
−
anion, the absorbance of the solvated electron increases with
temperature. This is a great advantage for the studies of the spectral shift of the solvated electron
in alcohols because its yield and absorption coefcient are much lower than that of the hydrated
electron and the decay is much more accelerated due to reactions with the solvent molecules.
Nevertheless, the two approaches give the same results, on both the spectral shape and absorption
maximum position (EA
max
). The EA
max
of the solvated electron in these alcohols decreases linearly
with increasing temperature up to supercritical conditions. The temperature coefcients, that is,
dEA
max
/dT, of primary alcohols are higher than that of secondary alcohols.
15.4.1.5 in
p
olyalcohols
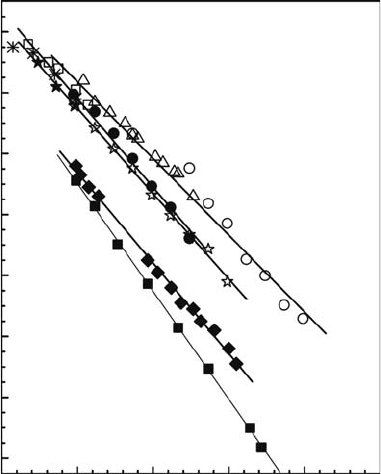
The temperature-dependent absorption spectra of the solvated electron in ethane-1,2-diol (12ED),
propane-1,2-diol (12PD), and propane-1,3-diol (13PD) have been investigated up to 300°C (Mostafavi
et al., 2004; Lampre et al. 2005; Lin et al., 2006b, 2007a,b). At a given temperature, the shape of
the spectrum in a given solvent is independent of time. The absorption band maximum at room
temperature is around 570, 565, and 575 nm, for 12ED, 12PD, and 13PD, respectively. These values
are in agreement with previously reported ones. By increasing the temperature, the decays become
faster and most of the solvated electrons disappear within the electron pulse due to geminate recom-
bination, resulting in a drop in the measured absorbance. However, it can be clearly observed that
the maximum of the solvated electron absorption band shifts to the longer wavelength with the tem-
perature rise. The transition energy at the absorption maximum plotted as a function of temperature
is correctly tted by a straight line for each solvent (Figure 15.5). From the slope of the curves,
the temperature coefficients (dE
max
/dT) of −2.5 × 10
−3
eV/K in 12ED, −3.1 × 10
−3
eV/K in
2.4
2.2
2.0
1.8
1.6
1.4
1.2
1.0
200 300 400 500
Temperature (K)
1-Propanol
CD
3
OD
12ED
13PD
12PD
E
max
(eV)
600 700
Figure 15.5 Energy of the maximum of the solvated electron absorption band (E
max
) as a function of
temperature in different solvents: 12PD (⚫, Lampre et al., 2005), (
m
, Okazaki et al., 1984); 13PD (☆, Lampre
etal., 2005), (★, Okazaki et al., 1984); 12ED (◽, Okazaki et al., 1984), (▵, Chandrasekhar and Krebs, 2000),
(⚪,
Lampre et al., 2005); CD
3
OD (⬥, Herrmann and Krebs, 1995); 1-propanol (◾, Han et al., 2008).