Heidersbach R. Metallurgy and Corrosion Control in Oil and Gas Production
Подождите немного. Документ загружается.

INSPECTION, MONITORING, AND TESTING 189
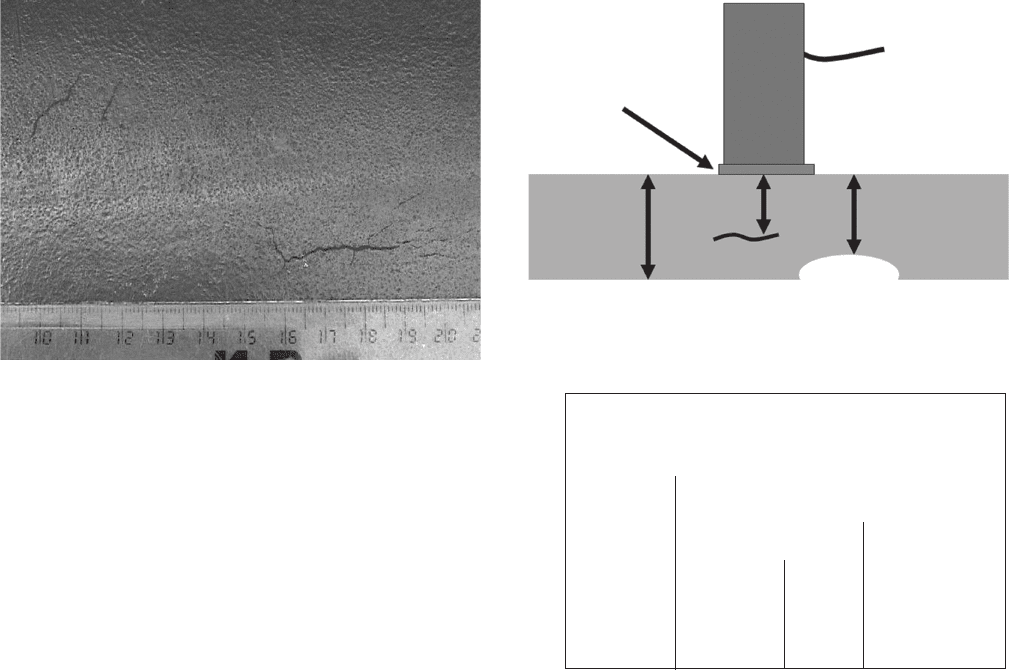
Figure 7.5 Ultrasonic pulse - echo transducer with sample.
4
Contact
Ultrasonic
Transducer
Couplant
ABC
Crack
Pit
Figure 7.6 Pulse - echo display of the sample shown in
Figure 7.5 .
4
Distance →
Back
surface
echo
Crack
echo
Pit
echo
ABC
Amplitude →
Figure 7.4 Magnetic particle crack indications on the exter-
ior of a petroleum pipeline.
Benefi ts of MT :
4
•
Relatively simple and rapid method of inspection
•
May detect fi ne cracks missed by eye and dye
penetrant
Limitations of MT :
4,14,15
•
Extensive training necessary
•
Only ferromagnetic materials inspected
•
Requires smooth, clean surface
•
Paint or coatings may reduce sensitivity
•
May need to demagnetize surface after inspection
Ultrasonic Inspection ( UT )
UT uses high - frequency sound waves to measure the
distance from a source transducer to a refl ection source
such as a defect or metal surface, for example, the oppo-
site side of the metal being inspected. Any change in
density of the material through which the sound wave
is traveling will produce an echo which can be detected
by ultrasonic detectors. This technique is usually used
as a portable technique where the transducer (Figure
7.5 ) is placed on the metal surface to be inspected. The
pulse (sending sound waves) - echo (receiving sound
waves) technique is the most common UT technique.
4
High - frequency sound waves are introduced into a
material (pulse), and refl ected sound (echo) measure-
ments indicate the distance from the material surface
that the refl ections (echoes) are coming from. Figures
7.5 and 7.6 show a typical setup where a transducer
(sound source and receiver) is placed on the surface,
and echoes from defects within the material and from
the far side of the material produce three different
return signals — the original pulse at the surface A, an
echo from beyond the center of the sample B, and an
echo from the far surface. The pulse - echo technique is
used for determining remaining wall thicknesses due to
corrosion and for weld fl aw detection during construc-
tion and repairs.
It is common to monitor corrosion by inspecting in
the same location at locations marked on the outside of
pressure vessels and topside piping. Ultrasonics are also
used for one - time inspections, as shown in Figure 7.7 .
One limitation of conventional pulse - echo UTs is
that they only indicate the condition of the structure at
locations near the ultrasonic transducer. Other UT
techniques have been developed to measure larger
areas, although they are less commonly used.
7
Benefi ts of UT :
4
•
Only requires direct access to one side of the test
piece
c07.indd 189c07.indd 189 10/29/2010 10:36:03 AM10/29/2010 10:36:03 AM
190 METALLURGY AND CORROSION CONTROL IN OIL AND GAS PRODUCTION
Oilfi eld radiography uses X - ray generators, which
require high - voltage electricity, or radioisotopic gamma
rays. Isotopic radiation sources are limited in the radia-
tion fl ux they can produce, and they often require longer
exposure times than X - rays. A number of radioactive
isotopes are available, but Iridium 192 is the most com-
monly used gamma source for oilfi eld use.
20
At one time, image capturing was with fi lm, but
recent advances in electronic radiation detection are
capturing much of the market. These electronic methods
use similar equipment, for example, image plates,
but they can be processed much quicker, present no
chemical disposal problems, and are more amenable to
automated image transfer and analysis. These advances
have led to signifi cant cost and time reductions.
20
Radiography detects differences in mass between the
source and the imaging device. Heavier or thicker mate-
rials require longer exposure times, and lighter materi-
als may not be detected. This can be an advantage, as
radiography of coated pipelines does not require coating
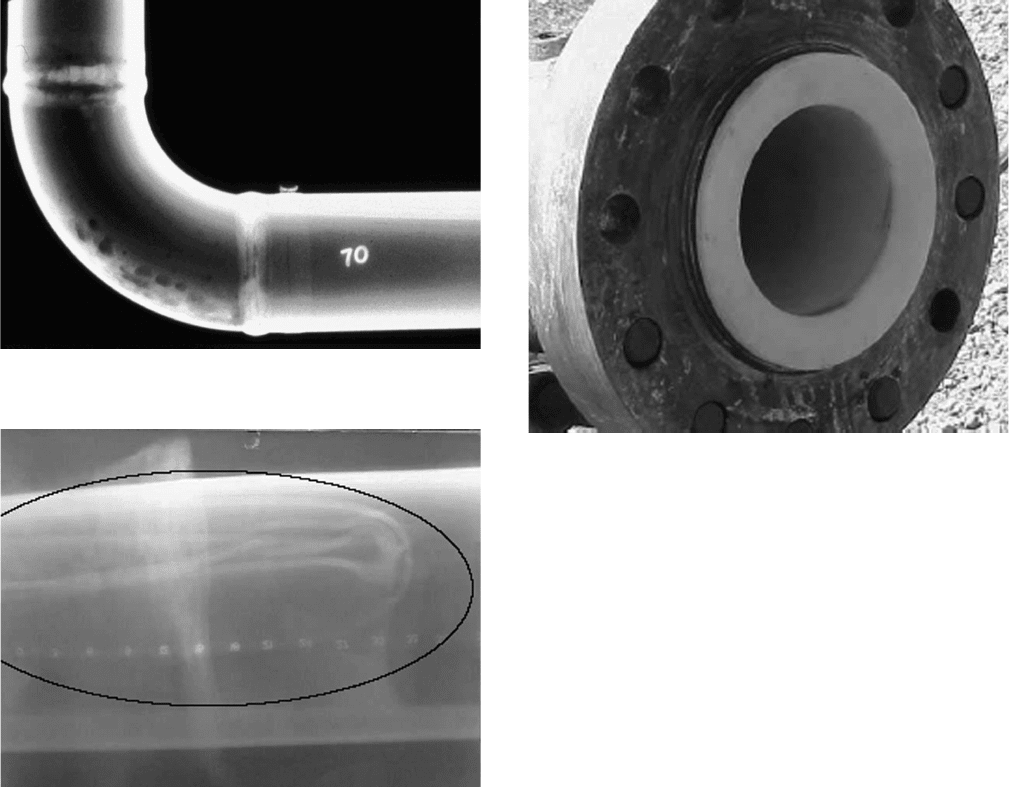
removal before examination. This is shown in Figure
7.9 , which shows the effects of erosion corrosion on the
inside of a coated pipe.
Radiography allows inspection and imaging of mate-
rials lighter than metals. This is shown in Figure 7.10 ,
where a region of debonding has been located in a
nonmetallic liner using radiography. A nearby fl ange
showing the lining is shown in Figure 7.11 . Despite this
capability, the great majority of oilfi eld uses for radiog-
raphy remain in weld quality and metal loss imaging.
Radiation safety is a major concern when using
radiography, and dosage monitoring of all nearby
personnel, exclusion of non - necessary personnel from
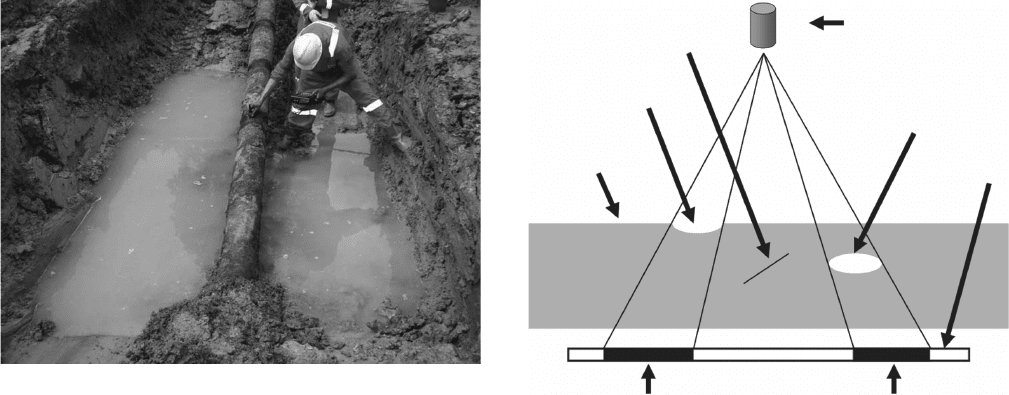
Figure 7.7 Ultrasonic inspection every meter at the 12 o ’ clock
position on an exposed pipeline. Note the dark areas on the
pipeline where dirt and debris have been removed so that good
sensor contact can be maintained with the pipeline surface.
•
Accurate thickness and fl aw depth measurement
•
Can penetrate thick materials
•
Analytic techniques, based on ANSI/ASME B31G,
API 653, API 510 and 510 and similar codes, can
be used for determining maximum allowable oper-
ating pressures and estimated remaining service
life.
4,7,13,16 – 19
Limitations of UT :
4
•
Training is relatively extensive and may require
several years of experience to produce skilled
inspectors
•
Limited use on very thin material
Radiography ( RT )
The use of X - rays and gamma rays has been applied to
industrial inspection for many years. The techniques are
very similar to those used for medical radiography, and
many advances in medical radiography have been
adopted for industrial applications.
4
Common oilfi eld uses for radiography include weld
quality inspection, weight loss corrosion inspections,
and the measurement of the extent of scale, hydrate,
and paraffi n buildup inside pipelines. A typical radio-
graphic exposure using fi lm as a radiation detector is
shown in Figure 7.8 . The radiation is absorbed by any
material between the source and the detector. Figure
7.8 shows that thin cracks are normally missed by radi-
ography, but volume defects, for example, pitting cor-
rosion and internal porosity, are readily detected.
Figure 7.8 Schematic of fi lm radiography of a metal with a
corrosion pit, an internal crack, and internal porosity defects.
Thin crack
Radiation source
Porosity
Darkened area (when developed)
Film
Surface pitting
Metal plate
c07.indd 190c07.indd 190 10/29/2010 10:36:03 AM10/29/2010 10:36:03 AM
INSPECTION, MONITORING, AND TESTING 191
•
Access to both sides of the structure is necessary
•
Radiation safety precautions necessary
•
Free access necessary for radiation source
•
Orientation of crack - like defects means they may
be missed
•
Expensive
Because radiography cannot determine the depth of
internal defects and will miss tight cracks like those
shown in Figure 7.8 , it is common to combine radiogra-
phy with UT. The two techniques are considered com-
plementary in locating and identifying internal defects.
Eddy Current
Eddy current inspection can be used on any electrically
conductive material. Alternating electromagnetic fi elds
induce circulating eddy currents (electron fl ow) in the
material being inspected. Defects, for example, cracks,
bulges, corrosion pits, alter the fl ow of these currents
and reduce the secondary magnetic fi eld of the part
under inspection. Changes in conductivity and magnetic
permeability are analyzed and correlated with fl aws.
The basic equipment consists of an alternating elec-
trical current source, a connected coil (probe) that can
be passed near the part being inspected, and a voltmeter
to measure the voltage change across the coil. The
examination process involves moving the probe across
the part being inspected and noting where the current
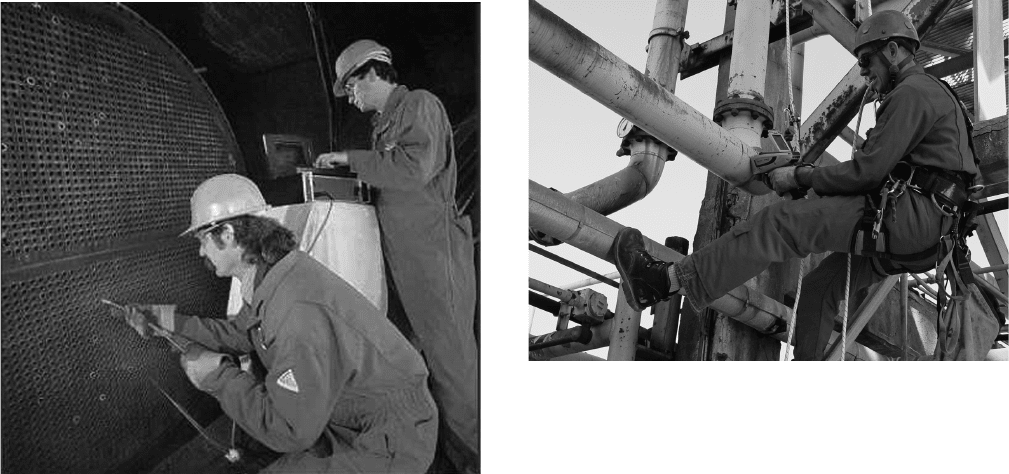
changes. Figure 7.12 shows inspection of heat exchanger
tubing. In this type of inspection it is common to draw
the probe through the tubing and note locations where
the exposure area, and appropriate radiation shielding
are all necessary.
Benefi ts of Radiographic Inspection:
1,4,7,20
•
Rapid using electronic cameras instead of fi lm
•
Image as permanent record
•
Coatings and thin surface deposits are transparent
which allows minimal surface preparation
•
Can be used on most materials
•
Shows fabrication errors (e.g., misalignments),
weld defects, and weight loss corrosion
Limitations of Radiographic Inspection:
1,4,7,20
•
Only local areas can be inspected
•
Only 2D image — no information on depth of defect
Figure 7.10 Radiograph showing damage to nonmetallic
pipe liner.
Figure 7.11 Flange near damage shown in Figure 7.10 .
Figure 7.9 Radiograph showing erosion corrosion at piping
bend. Photo courtesy of NACE Basic Course.
c07.indd 191c07.indd 191 10/29/2010 10:36:03 AM10/29/2010 10:36:03 AM
192 METALLURGY AND CORROSION CONTROL IN OIL AND GAS PRODUCTION
Figure 7.13 shows one of these XRF analyzers in
operation. All the operator needs to do is clean the
surface so that the bare metal is exposed and turn on the
detector. The machine will analyze the sample in a matter
of seconds and compare it with a series of preloaded
alloy possibilities before providing the nearest match.
Hand - held PMI detectors have become the industry
standard for PMI of corrosion - resistant alloys (CRAs).
21
The portable X - ray spectrometers used for this purpose
cannot detect carbon and other light elements, and
hardness testing is the traditional way of sorting carbon
steel samples.
Benefi t of PMI :
21
Fast and accurate alloy
identifi cation
Limitations of PMI :
21
•
Radioactive, requires secure storage and dosage
monitoring
•
Cannot analyze carbon steels and other light
elements
•
Requires direct access to cleaned surface for
analysis
•
Initial equipment cost is relatively high compared
to some other techniques
Thermography
Thermography uses infrared cameras to detect temper-
ature differences in equipment. It is often used as a
remote inspection technique to determine fl uid levels in
storage tanks, fl uid leaks on insulated piping, losses in
wall thickness due to erosion corrosion, and a variety of
indications appear. Further inspection, for example,
with ultrasonics, can identify the extent of the irregular-
ity detected by eddy current. Heat changer inspections
can analyze many tubes very quickly. It is common to
block off any tubes with eddy current irregularities until
the total number of blocked tubes affects equipment
performance.
Benefi ts of Eddy Current Inspection:
4
•
Detects both surface and slight subsurface defects
•
Probes do not have to contact the part
•
Works through paint and some coatings
Limitations of Eddy Current Inspection:
4
•
Relatively extensive training is required
•
Limited to conductive materials
•
Limited depth of penetration
Positive Material Identifi cation ( PMI )
This term is applied to identifi cation and confi rmation
of alloy materials using hand - portable X - ray fl uores-
cence (XRF) spectrometers.
21
A radiation probe, usually
using a radioactive isotope, is placed on the sample in
question and X - rays from the sample being tested are
analyzed using equipment - mounted software. Most of
these instruments can be programmed for dozens of
alloys and the typical readout tells the operator the
alloy with the closest match to the detected X - rays.
Figure 7.12 Eddy current inspection of heat exchanger
tubes.
3
Figure 7.13 Hand - held Thermo Scientifi c Niton X - ray fl uo-
rescent spectrometer being used for positive materials identi-
fi cation. Photo courtesy of Thermo Fisher Scientifi c.
c07.indd 192c07.indd 192 10/29/2010 10:36:04 AM10/29/2010 10:36:04 AM
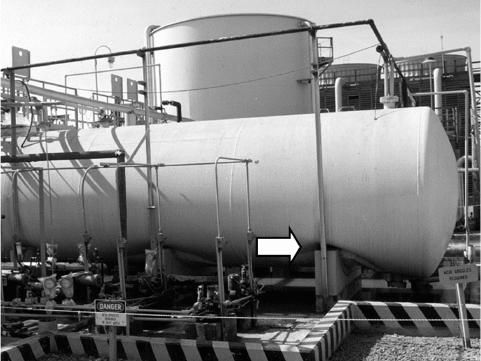
INSPECTION, MONITORING, AND TESTING 193
replaced at the appropriate time and a subsequent
fi lling of the tank produced the slumping shown in this
picture.
Upstream oil and gas operations have many routine
inspections, but in far too many cases, the inspection
process becomes routine, and organizations do not
realize the implications of reports available somewhere
in their organization. Preventable leaks and damaged
equipment are sometimes the unfortunate results.
Many organizations would benefi t from recognizing
the Pareto principle that most problems are associated
with a small fraction of their equipment.
2,3
Risk - based
inspection procedures are attempts to apply this think-
ing.
5
Having more inspections is often counterproduc-
tive. Conducting the right inspections, in the most
important high - risk locations, is preferable to having so
many inspections that the organization spends too much
time conducting inspections and too little time thinking
about what these inspections mean in terms of safety
and reliability.
Many organizations have maintenance and inspec-
tion budgets related to production volumes. As pro-
duction fi elds age and production volumes decrease,
equipment ages, and many production fl uids become
more corrosive. The need for increased inspection and
maintenance suffers from decreasing budgets at times
of increasing needs for inspection and maintenance.
MONITORING
Inspection is used to determine the condition of equip-
ment at the time of inspection while monitoring allows
operators to determine if conditions and corrosion rates
are changing. The two techniques are complementary,
and both are necessary.
Corrosion monitoring is used to determine changes
in the corrosivity of environments and to determine the
effectiveness of corrosion control techniques such as
chemical inhibitor injection.
24
Most oil fi elds become
more corrosive as fi elds age, production rates decrease,
and water cuts increase. Souring of formations, often
caused by inadequate injection water treatment, can
also cause increased corrosivity. In low - temperature,
low - pressure situations where corrosion inhibitors are
used to minimize and control corrosion rates of carbon
steel, the proper application of corrosion monitoring
becomes the principal means of determining and main-
taining corrosion control.
Monitoring Probes
Most monitoring techniques require the insertion of
metal samples of some type into corrosive production
other purposes.
7
The technique cannot identify the
reason for the detected temperature differences. It is
used as a quick means of determining locations where
closer inspection using other means are appropriate.
Benefi t of Thermography:
7
Identifi cation of hot spots,
for example, due to scale buildup in furnaces or leaks
in thermal insulation
Limitation of Thermography:
7
Cannot determine cor-
rosion or wall thinning
Additional Remarks about Inspection
There are a number of other inspection techniques used
in oilfi eld applications, including magnetic fl ux leakage
(MFL) for internal inspection of pipelines and alternat-
ing current fi eld measurement (ACFM) for external
crack detection.
Inspectors need guidance on how to collect and
analyze, or protect for shipment for laboratory analysis,
biological samples, and surface deposits.
One of the biggest problems with inspection is that
it can become routine, and organizations may not pay
attention to the results of inspection. This is shown in
Figure 7.14 , which shows an acid storage tank built from
carbon steel that experienced gradual wall thinning due
to corrosion. The use of carbon steel for the storage of
concentrated sulfuric acid is an accepted industry prac-
tice.
7,22,23
This tank was inspected on a regular basis to
determine the extent of the expected gradual wall thin-
ning, and the original design called for replacement
once the thinning reached a certain prescribed extent.
Unfortunately, the inspection reports, which proved to
be accurate, were fi led and not brought to the attention
of the appropriate decision makers. The tank was not
Figure 7.14 Slumping storage tank due to wall thinning.
c07.indd 193c07.indd 193 10/29/2010 10:36:04 AM10/29/2010 10:36:04 AM
194 METALLURGY AND CORROSION CONTROL IN OIL AND GAS PRODUCTION
ment (Figure 7.16 ). For these reasons, most probes will
have slightly higher corrosion susceptibilities than the
actual structures in which they are placed. This pro-
duces slightly increased corrosion rates, which are con-
servative and are to be desired. The statistical nature of
pitting and other forms of localized corrosion also mean
that monitoring with small corrosion probes cannot rep-
licate the corrosion rates of larger metallic structures. It
is also diffi cult, and often impossible, to place probes in
the most corrosion - susceptible locations in a compli-
cated piping system.
While the true corrosion rates of large - scale equip-
ment cannot be determined from small corrosion probes,
“ awareness of changes in the corrosion rate is often the
major requirement of monitoring with the absolute
value of the corrosion rate being less important. ”
4
Mass - Loss Coupons and Probes
The most common equipment used for corrosion moni-
toring is the insertion of mass - loss coupons into the
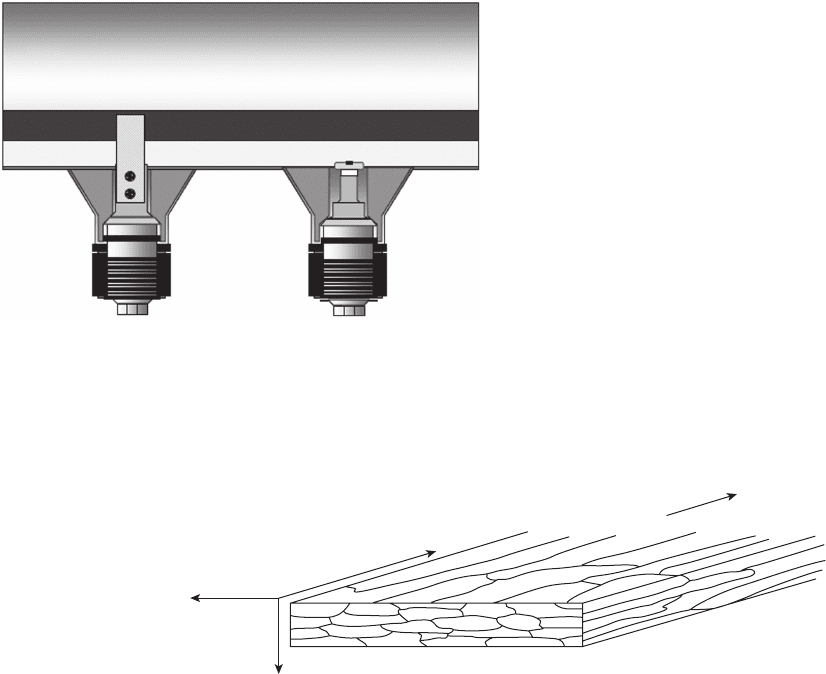
environment of interest. Fittings such as those shown in
Figure 7.16 are often used for this purpose. It is impor-
tant that the coupons be inserted in the appropriate
location, usually top or bottom depending on whether
gas - phase or water - phase corrosion is being monitored.
Unfortunately, it is all too common for the fi ttings and
probes to be placed in the most convenient access loca-
tion, and this means that many coupons are not exposed
to the corrosive conditions they are intended to monitor.
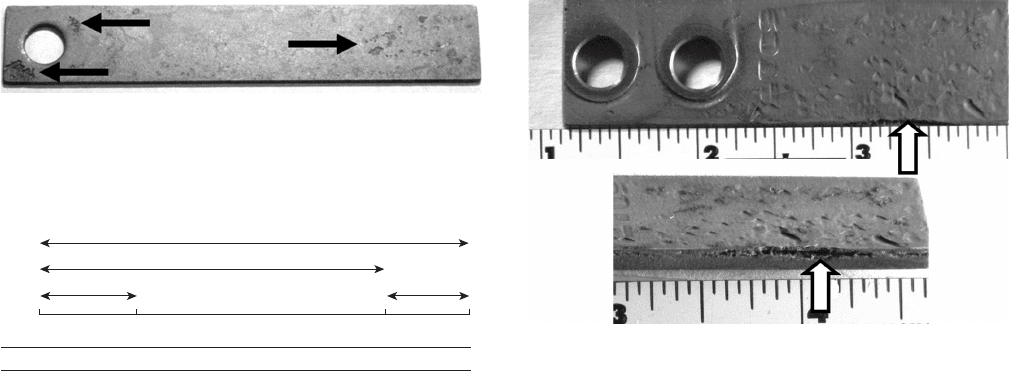
Figure 7.17 shows a typical weight loss coupon after
exposure in an oilfi eld environment for 3 months. The
arrows indicate locations of pitting.
NACE and other standards prescribe methods of
analyzing coupons to determine the average (weight
loss) corrosion rate and the pitting rate, based on the
depth of the deepest pit on the coupon.
6
It should be
noted that these methods calculate corrosion rates aver-
aged over the exposure times and do not take into
account the possibilities that the observed corrosion
fl uids. Two typical arrangements are shown in Figure
7.15 . The corrosion coupon shown on the left is exposed
to produced water at the bottom of the pipe and to
oil which is fl owing above the denser water. The
fl ush - mounted probe on the right is only exposed to
the produced water on the bottom of the pipe. It is
obvious that the two different probes will be exposed
to different corrosion environments and return differ-
ent information.
It is important to monitor corrosion in the appropri-
ate location. Common locations for internal corrosion
are near the bottom or the top, depending on whether
corrosion is expected from the water or the gas phase.
Oil is generally noncorrosive.
A major limitation of monitoring systems is the
limited size and shape of the probes used to monitor
corrosion. Probes are manufactured from wire, sheet,
or plate having chemistries close to, if not the same as,
plate and tubular products used in oilfi eld applications.
The crystal orientation and relative grain boundary
areas of the exposed probe samples are different than
the fl at, as - rolled or as - drawn surfaces of most equip-
Figure 7.15 Intrusive and fl ush - mounted corrosion probes
inserted into a three - phase production system.
4
Gas
Produced water
In normal 3-phase flow the gas, oil and water are not fully
separated as depicted.
Oil
Figure 7.16 Rolling direction and resulting grain structures.
24
Rolling
Direction
Longitudinal
Long Transverse
Short Transverse
c07.indd 194c07.indd 194 10/29/2010 10:36:05 AM10/29/2010 10:36:05 AM
INSPECTION, MONITORING, AND TESTING 195
try, thermal and mechanical processing history, nature
of inclusions and other imperfections, and so on, are
likely in these coupons. These differences seldom affect
the results of weight loss and pitting determinations, but
they can produce unintended results in some environ-
ments. Figure 7.19 shows a typical carbon steel coupon
purchased from a major coupon supplier and exposed
in an H
2
S - containing environment. The arrows show
locations of hydrogen - induced cracking. The carbon
steel in this coupon was harder (HRC27) than the
OCTGs used in the equipment where the coupon was
exposed. While the coupon had cracking, none is likely
to occur on the piping system being monitored.
Coupon exposure time must be considered. Short -
term exposures (15 – 45 days) are likely to indicate higher
corrosion rates than longer - term exposures. It takes
time for biofi lms, scale deposits, and pitting to develop.
Longer exposures (60 – 90 days) are sometimes neces-
sary to detect and defi ne pitting attack.
25
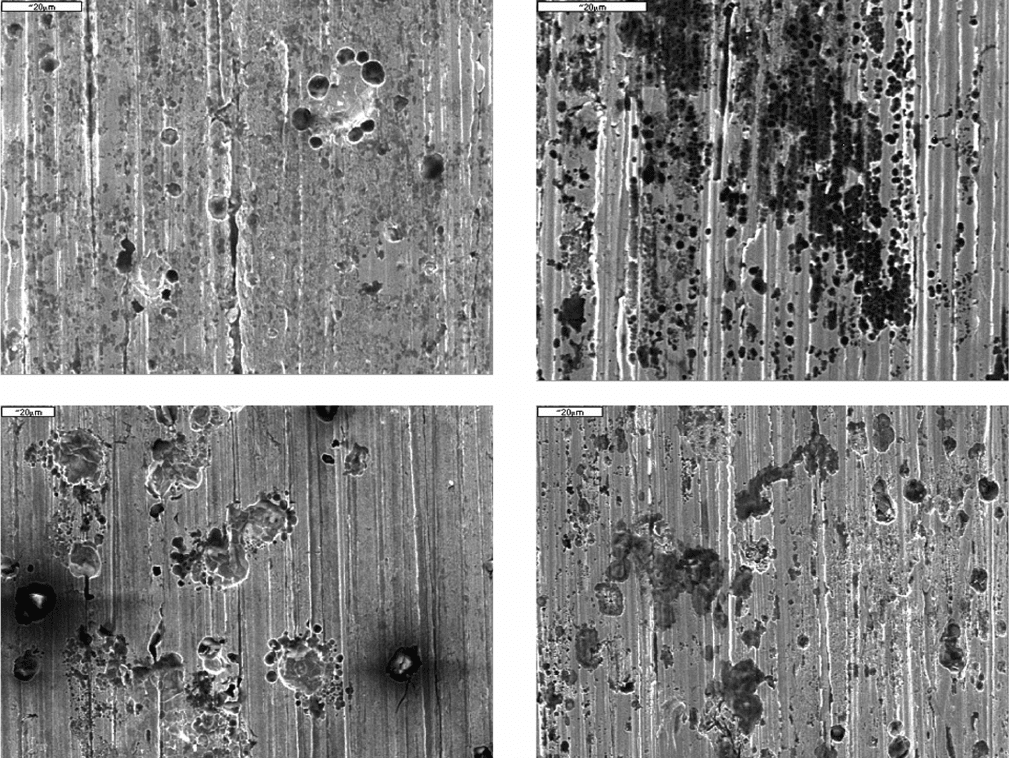
Pitting is nor-
mally analyzed using optical microscopes at relatively
low magnifi cations. Figure 7.20 shows corrosion coupons
from an offshore gas fi eld analyzed using a scanning
electron microscope. These instruments are able to
observe surfaces at much higher magnifi cations and
detect pitting that would be missed at lower magnifi ca-
tions.
27
This allows for faster corrections to corrosion
inhibitor treatments. Many oilfi eld service companies
have access to these microscopes, but the use of scan-
ning electron microscopes for coupon analysis remains
unusual.
Benefi ts of Mass - Loss Coupons:
4,7
•
Can be used in any corrosive environment
•
Relatively simple procedure, easily understood,
and widely accepted
may have occurred due to process upsets over a short
interval of time during the exposure. This is a major
limitation of the way most coupon exposure testing is
conducted. Pitting initiation takes time, and there is no
way of determining from mass - loss exposure coupons
when, during the exposure interval, pitting, or any other
form of corrosion, has occurred. The mass - loss corro-
sion rate also assumes that corrosion is general corro-
sion, which is seldom true for oilfi eld environments.
One means of determining if corrosivity has changed
during the exposure interval is to use planned interval
corrosion testing, a procedure that has been available
since the 1940s. The principles of this method are shown
in Figure 7.18 . The method requires exposing numerous
samples for different periods of time and comparing the
corrosion rates for the various exposures.
This method, which has been available since the
1940s,
26
has been generally supplanted by online electri-
cal corrosion monitoring techniques that can determine
changes in corrosion rates in much shorter times. These
techniques are discussed later in this chapter in the sec-
tions on monitoring and testing.
Corrosion coupons are normally supplied by compa-
nies that specialize in the preparation of these samples
from standard alloys in accordance with Universal
Numbering System (UNS) and similar alloy chemical -
content standards. These alloys are similar to API - grade
oil country tubular good (OCTG) alloys, but they are
not the same. Differences in minor constituent chemis-
Figure 7.18 Planned interval testing.
25
Test Specimens
0 1 Time
Occurences During Corrosion Testing
Liquid Corrosiveness
Metal Corrodibility
Unchanged
Decreased
Increased
A
1
= B
B < A
1
A
1
< B
A
2
= B
A
2
< B
B < A
2
Unchanged
Decreased
Increased
Criteria
t t + 1
B
A
1
A
1
A
2
A
t+1
Figure 7.19 Hydrogen - induced cracking on a carbon steel
mass - loss coupon.
Figure 7.17 A typical weight loss coupon after exposure to
an oilfi eld environment for 3 months. Arrows indicate the
three areas with pitting.
c07.indd 195c07.indd 195 10/29/2010 10:36:05 AM10/29/2010 10:36:05 AM
196 METALLURGY AND CORROSION CONTROL IN OIL AND GAS PRODUCTION
results of microbial or other fi lms that produce
underdeposit corrosion
•
Labor - intensive technique
Mass - loss coupons are the most common means of mon-
itoring the effectiveness of corrosion inhibitors for cor-
rosion control. Unfortunately, many operators have the
same contractor responsible for inhibitor application
and for monitoring the effectiveness of the inhibitors.
This confl ict of interest can lead to problems. Another
problem with mass - loss coupons is that it is often impos-
sible to place them in the most corrosive locations.
Organizations that rely on this data, instead of on
inspections of the equipment involved, can experience
unanticipated equipment failures. Coupons, like all
•
Works for general attack and localized corrosion
mechanisms
•
Mass - loss coupons are relatively inexpensive
Limitations of Mass - Loss Coupons:
4,7
•
Coupons must be inserted into the fl uid, exposing
personnel to potential hazards
•
Practical limitations usually mean that data is only
available 1 – 6 times per year
•
Cannot be automated
•
Only determines average corrosion rate, cannot
determine effects of upsets or unusual occurrences
•
Short exposure times overestimate general corro-
sion rates and may miss the onset of pitting or the
Figure 7.20 Scanning electron micrographs showing early indications of pitting on corrosion
coupons from an offshore gas fi eld.
c07.indd 196c07.indd 196 10/29/2010 10:36:05 AM10/29/2010 10:36:05 AM
INSPECTION, MONITORING, AND TESTING 197
niques. Depending on the corrosivity of the environ-
ment and the probe design, it is possible to note changes
in corrosion rates.
The resistivity of metals changes with temperature.
Modern ER probe systems have temperature com-
pensation built into the probes, so this is no longer
a problem. Electrical probes can be shorted by
sulfi de deposits, and this is a major limitation to ER
probe use.
4
Response times for ER probes depend on the cor-
rosivity of the environment and the metal cross section
of the probes. While thinner probes could be manufac-
tured, their service life would be too short, making them
impractical. At present, response times range from 0.5
to 1 day at very corrosive environments to 5 to 10 days
at the lower end of typical corrosion rates.
28
Benefi ts of ER Probes:
4,7,28
•
Continuous online monitoring possible
•
Can be used in almost any environment
•
Useful in monitoring inhibitor persistence
•
Sensitive to both corrosion and erosion
Limitations of ER Probes:
4,7
•
Results are indicative of general corrosion or
erosion, technique does not measure localized cor-
rosion. Specialized probes can be designed to sense
crevice corrosion.
•
Probes require insertion into the corrosive fl uid.
•
Response time is slower (hours to days) than for
other electrochemical monitoring techniques.
•
Iron sulfi de deposits can produce misleading
results.
•
Temperature compensation techniques are not
sensitive to rapid temperature changes.
Electrochemical Corrosion Rate
Monitoring Techniques
Electrochemical corrosion monitoring techniques
include:
4,7,24
other monitoring techniques, can only indicate whether
the corrosion rates are changing. They cannot identify
what the corrosion rates are on the most corroded
equipment in a system, often in deadlegs, the bottom of
upward inclines like shown in Figure 7.1 , or other inac-
cessible locations.
Electrical Resistance ( ER ) Probes
ER probes allow continuous online monitoring of cor-
rosion and are the second most common monitoring
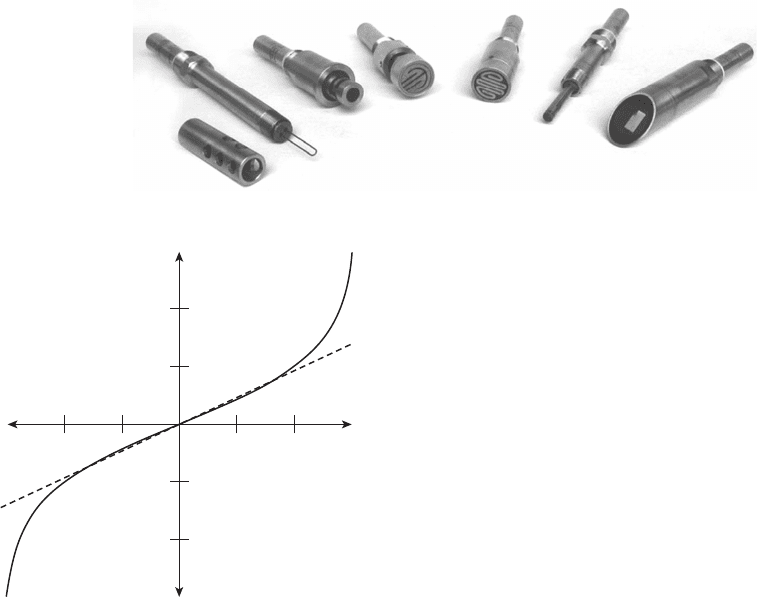
technique for oilfi eld corrosion. Figure 7.21 shows
typical commercially available ER probes. The probes
are based on the principle that as corrosion or erosion
of the probe occurs, the reduced metal has increased
resistance to electrical current. Monitoring the changes
in resistance provides an indication of the corrosion
inside process equipment. Figure 7.22 shows a number
of different geometries, including several fl ush - mounted
probes that do not extend into the fl uid and measure
corrosion at the vessel wall level.
The output from ER probes can be transmitted to
any desired location.
These probes will work in any environment, and that
is a major advantage over other online monitoring tech-
Figure 7.21 Typical ER probes.
4
Figure 7.22 Voltage versus potential plot at potentials near
the equilibrium (corrosion) potential.
Current (mA)
E (mV)
10 20–20 –10
c07.indd 197c07.indd 197 10/29/2010 10:36:06 AM10/29/2010 10:36:06 AM

198 METALLURGY AND CORROSION CONTROL IN OIL AND GAS PRODUCTION
where:
R
p
= polarization resistance, Ω (ohms)
I
corr
= corrosion current, amps
β = the Stern – Geary constant
The Stern – Geary constant can be calculated from theo-
retical considerations or directly measured in separate
experiments.
4,29 – 33
As a practical matter, most instru-
ment suppliers sell their instruments calibrated based
on the “ average ” Stern – Geary constant for iron and
carbon steel and on the assumption that corrosion of
iron produces Fe
+ 2
ions (instead of Fe
+ 3
ions). These
assumptions are justifi ed for monitoring purposes,
because the purpose of electrochemical monitoring is to
determine if the corrosion rate is changing or is remain-
ing steady. The absolute corrosion rate is not deter-
mined, but that is not the purpose of monitoring.
LPR instruments can determine changes in corrosion
rates within minutes, sometimes even seconds. This
real - time indication that corrosion rates are changing is
the main advantage of this technique over the simpler
and more widely used ER technique, which may take
hours or days to respond to changes in corrosion
conditions.
Like all electrochemical monitoring techniques, the
electrodes must be kept free of fouling from oily depos-
its. This is a major limitation and is the reason why this
technique is not more widely used in production moni-
toring before separation processes remove hydrocar-
bons from water.
Tafel Extrapolation This technique uses the same
instrumentation as used in LPR monitoring, and most
instruments are sold with the option of operating in
either the LPR or the Tafel extrapolation mode. At
potentials greater than a few millivolts from the equi-
librium (corrosion) potential, potential - current plots
frequently become linear on a log - linear plot when the
potential is plotted on a linear basis and the current on
a logarithmic scale. This is shown in Figure 7.23 .
Prior to the application of applied current the volt-
meter reads the corrosion potential relative to a refer-
ence electrode. As applied current is increased, the
applied current versus potential curve shows no change
in potential when most of the reduction current on the
working electrode is due to the corrosion reaction.
Eventually, the effects of the applied cathodic current
become apparent and the curve slopes downward. Once
most of the current is due to the applied current, the
slope becomes linear and the original current becomes
neglible. The log - linear portion of a polarization curve
is called the “ Tafel region, ” in recognition of the
•
Linear polarization resistance (LPR)
•
Tafel extrapolation
•
Galvanic monitoring
•
Electrochemical noise
•
AC impedance spectroscopy
The fi rst three techniques are appropriate for use in
oilfi eld monitoring applications. The latter two, while
they have many laboratory and research - oriented advo-
cates, cannot at the present time produce better results
than LPR and Tafel extrapolation. They also require
much more expensive, and delicate, instrumentation,
and will not be discussed, even though they do appear
in the corrosion literature and standards.
Most of these techniques are based on Faraday ’ s law,
which shows a direct relationship between electric
current and the mass of metal lost or deposited in an
electrochemical cell. The determination of corrosion
rates also depends on knowledge of the valency (oxida-
tion state) of the corrosion reactions.
7
Most instruments
are factory calibrated based on the assumption that the
corroding metal is iron or carbon steel and corrosion
produces Fe
+ 2
(instead of Fe
+ 3
) ions. This is a conserva-
tive approach and is appropriate for corrosion monitor-
ing, where changes in corrosion rates are more important
than the determination of the true corrosion rates.
LPR Linear polarization probes are sold with elec-
trodes made from the material being monitored; in most
cases this is carbon steel. The probes are small and can
be inserted into the fl uids of interest in the same manner
as ER probes. The technique is based on the observa-
tion that at potentials very near ( ± 20 mV) the corrosion
potential, the voltage versus current plot is frequently
linear. This is shown in Figure 7.22 .
The polarization resistance, R
p
, is the slope of the
voltage versus current line near the corrosion
potential.
4
R
E
I
p
=
Δ
Δ
(Eq. 7.1)
where:
R
p
= the polarization resistance, Ω (ohms)
Δ E = the change in potential
Δ I = the change in current
The polarization resistance is then converted to a
corrosion current using the Stern – Geary equation,
Equation 7.2 :
4
I
R
corr
p
=
β
(Eq. 7.2)
c07.indd 198c07.indd 198 10/29/2010 10:36:06 AM10/29/2010 10:36:06 AM