Higgins M.D. Quantitative textural measurement in igneous and metamorphic petrology
Подождите немного. Документ загружается.


7.2.3 Bubbles in magmas
7.2.3.1 Nucleation and growth of bubbles
Bubblesnucleateinasimilarwaytocrystals(Figures7.2a,7.2b).Nucleation
occurs when the gas becomes supersaturated in the magma. Classical nuclea-
tion theory (e.g. Gardner & Denis, 2004) predicts that the activation energy,
DF, for formation of a bubble nucleus in a homogeneous fluid is
DF ¼
16ps
3
3DP
2
where s is the surface tension of the bubble, and DP is the supersaturation
pressure.
This equation must be modified for heterogeneous nucleation (on a crystal
surface): s becomes the balance of surface tensions for crystal, melt and bubble
and the activation energy is modified by a factor f which is related to the
wetting angle (solid–liquid dihedral angle; see Section 4.2.3) of the bubble on
the surface (; Figure 7.3): f ¼ 1 for completely wetted surfaces (identical to
homogeneous nucleation) and f ¼ 0 for a wetting angle of 180
8
(Gardner &
Denis, 2004). Application of this simple theory predicts that homogeneous
nucleation requires a high degree of supersaturation and hence may be rare.
However, heterogeneous nucleation requires a much lower degree of super-
saturation, and hence will dominate if crystals are present. For example, iron
oxide crystals appear to be better nucleation sites as bubbles do not wet the
surface, whereas plagioclase is wetted by bubbles and hence requires a very
high supersaturation pressure (Figure 7.3; Hurwitz & Navon, 1994, Gardner &
Denis, 2004).
After nucleation bubbles grow by diffusion of vapour through the liquid
(Figure7.2c).Thespeedofthisprocesswilldependontheviscosityofthe
liquid and the molecular weight of the vapour: diffusion is fastest for light
molecules in a low-viscosity fluid. There is a feedback between bubble growth
and nucleation of new bubbles. Growth of bubbles by diffusion reduces the
vapour content of the melt, which will in turn affect the surface tension. A
lower water content in the melt will require a higher supersaturation pressure;
hence nucleation of new bubbles will be more difficult. The overall result of
this feedback is that nucleation may be instantaneous, rather than continuous.
Once bubbles have formed they will increase in size when the magma moves
toalowerpressureregion(Figure7.2d).Expansionwillbesloweddownby
viscous effects and relatively large changes in depth are probably needed to
make significant changes in bubble size.
7.2 Brief review of theory 219
The kinetically controlled processes of bubble nucleation and growth can
continue as long as there is sufficient supersaturation. As the driving force for
these processes diminishes, bubbles will try to approach equilibrium by size
adjustments. Bubble coalescence occurs when two bubbles touch and become
one:ithasnoparallelincrystalgrowth(Figure7.2e).Ratesofcoalescence
depend on the timescale of bubble approach, film thinning, rupture and
(a) Homogeneous
nucleation
(c) Growth by
diffusion
(e) Coalesence
(b) Heterogeneous
nucleation
(d) Expansion owing to
pressure changes
(f) Coarsening
(Ostwald ripening)
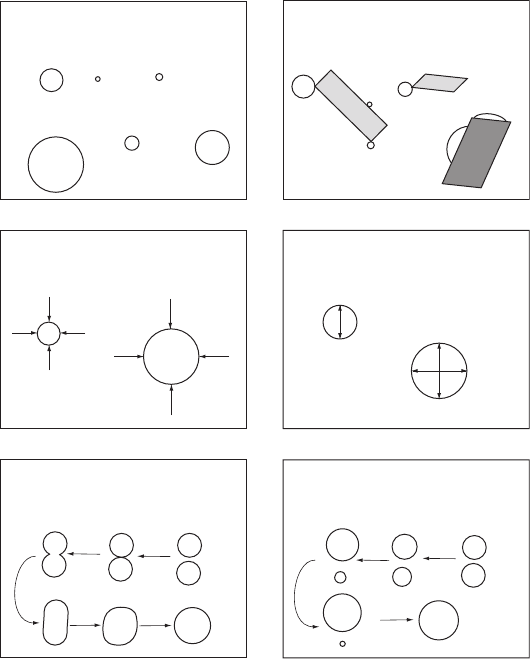
Figure 7.2 Bubble formation, growth and shrinking. (a) Homogeneous
nucleation occurs within a fluid. (b) Heterogeneous nucleation occurs on a
surface. If the angle between the bubble and the surface is small the surface is
said to be wetted and nucleation requir es a higher degree of supersaturation.
(c) Growth of pores can occur by diffusion of fluid into the pore. (d) If the
overall pressure is reduced bubbles will expand provided the matrix has a low
enough viscosity. (e) Bubbles may also grow by coalescence. (f) Small bubbles
have a higher internal pressure than larger bubbles. As the material
approaches eq uilibrium vapour will be transferred via the matrix, leading to
a coarsening of the bubbles.
220 Textures of fluid-filled pores
relaxation. Experimental results suggest that coalescence is most important
when the bubbles are expanding in response to a reduction in the confining
pressure(Figure7.2d;Larsenetal.,2004).Gaonac’hetal.(1996a)havepro-
posed that cascading bubble coalescence dominates other equilibrium processes.
During the final stages of development cascading bubble coalescence can lead to
catastrophic fragmentation of the magma (Gaonac’h et al., 2003).
Coarsening (Ostwald ripening) of bubbles resembles the same process in
crystals(Figure7.2f;seeSection3.2.4).Alargerbubblehasalowerinternal
pressure than a smaller bubble. Hence, gas will move from the smaller bubble
to the larger by diffusion through the silicate liquid. Clearly, the importance of
this process depends on the rate of diffusion of gas through the silicate liquid,
which in turn is controlled by the distance, temperature, liquid viscosity and
gas composition. However, unlike coalescence, it will occur even if the bubbles
do not intersect (Larsen & Gardner, 2000).
7.2.3.2 Bubble size distributions and shapes
Bubble size distributions (BSDs) can follow many different models, such as
unimodal, polymodal, exponential and power law (Blower et al., 2002,
Gaonac’h et al., 2003). Unimodal BSDs are produced by instantaneous bubble
nucleation, most likely following a heterogeneous model (Blower et al., 2002).
Polymodal BSDs probably form by several instantaneous nucleation events.
Both exponential and power law BSDs are commonly observed. The simi-
larity of exponential BSDs to some CSDs (Marsh, 1988b) has suggested to
some authors that they can form in the same way, by continuous nucleation
and growth under steady-state conditions (e.g. Mangan & Cashman, 1996).
Power law BSDs may form by cascading coalescence of bubbles (Gaonac’h
et al., 2003). However, other models are possible: Blower et al.(2002) have
proposed a model of non-equilibrium continuous nucleation and growth of
bubbles that evolves from a unimodal distribution via an exponential model to
a power law distribution.
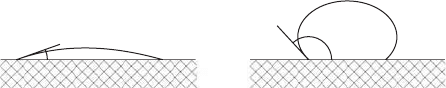
(a) Surface wetted – high ΔP
(e.g. plagioclase)
(b) Surface not wetted – low ΔP
(e.g. magnetite)
θ = 30° θ = 120°
Figure 7.3 Nucleation bubbles on surfaces. (a) Wetted surfaces have low
dihedral angles ( ¼ 308) and require large supersaturation for nucleation.
(b) Unwetted surfaces ( ¼ 1208) require lower degrees of supersaturation.
7.2 Brief review of theory 221
The shape of bubbles in magma can be changed by deformation (Rust et al.,
2003). These shapes will be preserved if the relaxation times of the magma are
long, as is the case for a viscous magma such as rhyolite. However, non-
spherical bubbles are not usually preserved in mafic magmas, except near the
chilled surface. The shape of bubbles has been used to quantify the type of
shear, simple or pure, and the shear rate (Rust et al., 2003).
7.3 Methodology
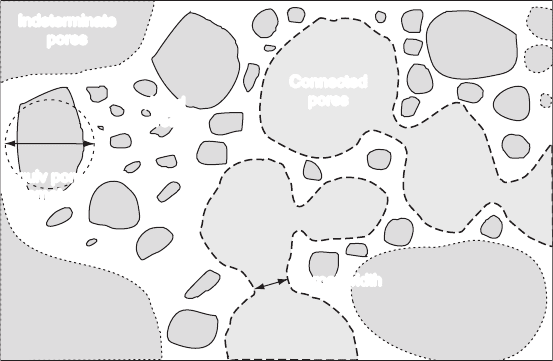
The overall porosity and pore size distribution of a material can be measured
using 3-D and 2-D methods, to be discussed below. Pores are commonly
assumed to approximate to spheres, hence their size is considered to be the
diameter of a sphere of equivalent volume (Figure 7.4). If the pores are
connected then the size of the pore is calculated assuming that the pore is
closed at the pore throat. For some strongly anisotropic materials pores may
depart from such a model and then size definitions similar to those used for
grains may be used (see Section 3.2.1.1). For some applications the actual
volume of the pore is used instead of the diameter.
The permeability of a material depends on the connections between the
pores (Figure 7.4). Connections may be increased by fracturing of the material
Throat width
Connected
pores
Isolated
pores
Indeterminate
pores
Equiv pore
diameter
Figure 7.4 Schematic 2-D section of a porous material. Pores were or are
filled with fluids, such as oil, gas, water or silicate melts. Pores may be divided
into those that are isolated (solid edges) and those connected by throats
(dashed edges). This is a section so isolated pores may be connected in three
dimensions outside the plane of the section. It is not possible to classify pores
that intersect the edge of the sample (dotted edges).
222 Textures of fluid-filled pores
during preparation. If the sample is small then permeability may be dominated
by edge effects: all pores that intersect the surface of the sample are connected
to it. However, their connections in the original rock are unknown. Hence, a
researcher should be aware of connections between the size of the sample and
the resolution of the method.
7.3.1 Pore surface area measurements
7.3.1.1 Analytical methods
Nitrogen adsorption is a physical method for measuring the total surface area
of a material permeable to gas (Gregg & Sing, 1982, Whitham & Sparks, 1986).
It cannot measure the area of isolated pores. The sample is first dried in a
vacuum. Then a stream of nitrogen is passed over the sample and allowed to
come to equilibrium. The nitrogen is adsorbed as a single layer of molecules on
the surfaces. Pure helium is then passed over the sample and the nitrogen
releases from the surface. The amount of nitrogen in the helium is measured.
The experiment is repeated for different partial pressures of nitrogen. From
these data the surface area per unit volume can be determined. If a shape for
the pores is assumed, such as a cylinder, then the mean pore diameter can be
calculated.
Mercury intrusion porosimetry involves the adsorption of mercury by a
permeable rock under increasing pressure (Whitham & Sparks, 1986). The
adsorption is opposed by the surface tension of the mercury. This in turn
depends on the wetting angle and the diameter of the pores. The geometry of
the pores must be assumed – a cylinder is the most common shape used. The
measurements are done in two apparatuses: the sample is first put in a vacuum
and mercury adsorbed, typically at a pressure of 0.078 bar, which corresponds
to a pore diameter of 235 mm. The pressure is increased to atmospheric,
equivalent to a diameter of 15 mm. Finally the sample is transferred to a
pressure vessel where the pressure is gradually increased: a pressure of
4280 bar corresponds to a pore diameter of 0.0032 mm. This method is useful
for the smaller pores, but again only counts pores connected to the outside of
the sample. However, it can be expected that thin pore walls will fracture under
these high pressures. Total porosity can also be determined in a similar way by
adsorption of water under pressure (Whitham & Sparks, 1986).
7.3.1.2 Image analysis method
The surface area per unit volume is one parameter that can be determined
exactly from intersection data (see Section 2.7.2). Although this method is
7.3 Methodology 223
independent of pore shape, connectedness or orientation, it is best to use a
number of orthogonal sections for markedly anisotropic materials. The sections
are imaged using optical or electronic methods (see Section 2.2). Test lines are
drawn on the images and the number of intersections of the line and the pores
counted. The surface area per unit volume is equal to twice the number of
intersections divided by the length of the test line. This method counts all
pores, including the isolated pores missed by the nitrogen adsorption method.
7.3.2 Three-dimensional analytical methods
7.3.2.1 Total porosity
Total porosity can be calculated easily from the density of the rock, that of the
void-free rock and the void-filling material. The density of the rock is most
easily determined by cutting an orthogonal block and measuring and weighing
it. Archimedes’ principle can also be used provided that the measuring fluid,
usually water, does not get into the pores (Houghton & Wilson, 1989). If the
pores are less than 1 mm then the block can be sprayed with waterproofing
aerosol as used on camping gear. For larger pores the block can be wrapped in
wax sheet, whose mass must be considered. Rocks which are less dense than
water can be ballasted with a known weight. For rocks with a known mineral-
ogical composition the void-free density can be calculated by summing the
proportion of the minerals weighted for their density. For igneous rocks the
density can be estimated from the chemical composition (Ghiorso & Sack,
1995). This parameter is calculated by a number of geochemical programs (see
Appendix).
The true rock density can also be measured by helium pycnometry: the
volume of helium displaced by the sample increases the pressure in a chamber
and the density can be calculated using the ideal gas law (Klug & Cashman,
1994). Helium will only enter into all pores connected to the surface hence the
total porosity may be less than the density method described above. The
measurements are done in a dedicated instrument.
7.3.2.2 Three-dimensional imaging techniques
The distribution of pores can be determined by serial sectioning (see
Section 2.2.1). In transparent materials, such as volcanic glasses, the size of
bubbles can be measured directly with a regular or confocal microscope (see
Section 2.2.2).
X-ray tomography methods similar to those used for measuring the distri-
bution of crystals can be used for pores also (see Section 2.2.3). Synchrotron
224 Textures of fluid-filled pores
X-ray microtomography is very similar, but uses a more intense source with a
finer resolution (Song et al., 2001, Shin et al., 2005). Finally, magnetic reso-
nance imaging has been used to visualise the texture of carbonate sediments
(Gingras et al., 2002). This method is particularly sensitive to water distribu-
tion. However, the resolution of the method is poor and there are few advan-
tages over other methods.
7.3.3 Two-dimensional analytical methods
7.3.3.1 Measurement of pore outlines
The most popular method for determining porosity and pore size distributions
is image analysis of sections or surfaces. The open spaces in rocks may be made
more visible in thin section if the rock is first impregnated under vacuum with
coloured epoxy resin. This process clarifies the distinction between isotropic
materials like volcanic glass and the open pores. In slabs it is better to use a
fluorescent dye. With this method pores down to 1 mm can be imaged. Some
workers have used low-melting-point metals for impregnation, such as Woods
metal. Unfortunately this alloy is rich in cadmium and hence toxic.
Sections can be imaged in transmitted or reflected light (see Section 2.5).
They can also be examined using a scanning electron microscope. Images can
be processed and segmented using the same methods as for minerals (see
Section 2.3).
7.3.3.2 Conversion of two-dimensional data to 3-D pore parameters
Sectional data must be converted to 3-D data using stereologically correct
methods, such as those developed for grain and crystal intersections (see
Section 3.3.3). The spherical or sub-spherical shape of many pores, especially
in volcanic rocks, makes correction for the cut-section effect less significant
than for more complex shapes. However, the intersection-probability effect
remains just as strong.
Small pores (<30 mm) may be seen in projection when examined in thin
section. In this case the equations for conversion of data are different from
those used for intersection (see Section 3.3.4). For spherical pores the data do
not need any correction at all. Gardner et al.(1999) used a variant of the
projection method: they counted the number and size of bubbles within a small
volume and then used the total bubble volume to scale the measured bubble
size distribution to the values for unit volume.
Thick sections with smaller pores viewed in projection and larger pores
viewed in intersection are difficult to treat. Ideally the two populations must
7.3 Methodology 225
be separated, calculated separately using the appropriate methods and then
recombined.
Blower et al.(2002) have proposed a parametric model for conversion of
sectional data. They note that if the pores are spherical and their sizes follow a
power law distribution, then the distribution of sectional diameters will also
have a power law distribution. Hence, the parameters of the 3-D power law can
be determined from the 2-D power law. Parametric solutions are always
dangerous to use as pore and grain sizes rarely conform to predetermined
distribution laws. In fact, we are generally searching for the distribution and
hence it is unwise to assume it beforehand (see Section 3.3.4).
Some early studies used the ‘Wager’ equation to convert intersection size
data to pore size distributions (e.g. Mangan et al., 1993). As was discussed in
Section 3.3.4.6 this equation is not appropriate, and does not give correct
results, but published results can commonly be recalculated using more accu-
rate methods (Higgins, 2000).
Toramaru (1990) proposed the use of the ‘Spektor’ method for determining
the pore size distribution. This method gives correct results, but necessitates
measurement of a very large number of pores to give precise results. It is
usually better to measure pore intersection size directly and make stereological
corrections.
Pore shapes and orientations can be determined using the same methods as
for solid grains (see Sections 4.2 and 5.2).
7.3.4 Measurement of permeability
Permeability is generally measured in a dedicated instrument. For example, for
a volcanic rock the sample is a cylinder of rock, typically 25 mm in diameter
and 23 mm long (Rust & Cashman, 2004). The edge of the core is sealed with a
rubber sleeve, leaving the circular ends open. Gas is forced through the sample.
The pressure difference between the two ends is increased in many small steps
from zero to 1.4 bar and the gas flow rate measured. From this the perme-
ability parameters for the viscous and inertial components of the permeability
can be determined.
7.4 Parameter values and display
7.4.1 Display of pore size distributions
Pore size distributions (PSD) can be expressed and displayed in a number
of ways. Some of these are similar to those used for grain size distributions
226 Textures of fluid-filled pores
(see Section 3.3.7). As for grain size distribution, it is always important to
recognise the resolution limits of any analytical method. These will clearly
affect the interpretation of the pore size distribution and the values of para-
meters that describe the pores.
A diagram similar to that used for crystal size distributions can be used (see
Section 3.3.7.2; Marsh, 1988b). In this graph the natural logarithm of the
population density is plotted against size, generally expressed as the equivalent
radius or diameter. As before population density must be distinguished clearly
from volume number density (see Section 3.3.7.2). This diagram is useful if the
pore population is generated by nucleation and growth in a similar way to
crystals. However, in many situations nucleation is instantaneous and hence
the Marsh model is not applicable.
Many authors have used simple frequency histograms to display pore size
distributions. The horizontal axis is either size as equivalent radius or volume
expressed linearly or in log 2 units (Toramaru, 1990). However, as was men-
tioned in Section 3.3.7, this is not a very good diagram if the data are sparse, as
they tend to be for the larger size classes. In this situation many classes will only
contain one or two pores or may be empty (e.g. Larsen et al., 2004). The eye
tends to glide over the empty classes, creating the impression that the number
of larger pores is greater than it is. This problem cannot be resolved by
increasing the width of classes as then the height of the histogram bar will
change. A better, and equally simple, diagram uses frequency density. The
frequency in each size class is divided by the width of the class. Larger classes
can then be wider, eliminating empty or sparse size classes that are just
artefacts of measurement.
Other distribution models can be verified by suitable diagrams in the same
way as for crystal size distributions (see Section 3.3.7). For example, Klug et al.
(2002) used a cumulative frequency diagram to verify if BSDs were lognormal
and a log–log diagram to determine if a power law (fractal) distribution was a
better approximation.
The connectedness of pores can also be quantified. It can be expressed in
terms of the number density (number per unit volume) of interconnected pores
against pore volume (Song et al., 2001). Pores are connected by pore throats
and the dimensions of such throats can also be expressed by a mean value and
size distribution.
7.4.2 Overall pore size parameters
The moments of the pore size distribution, M
0
, M
1
etc. can be calculated easily
and are simply related to the overall properties of the pores. These equations
7.4 Parameter values and display 227
are slightly different from those in Section 3.3.4 as the pores are assumed to be
spheres and the size variable is the radius of the pores.
M
0
= total number of pores per unit volume, N
V
.
M
1
= total radius of pores ¼ N
V
the mean radius of the pores, R
m
.
M
2
= total projected area of pores ¼ 1/4p surface area per unit volume, S
V
.
However, S
V
can be obtained precisely by other methods that do not need to
assume a pore shape (see Section 2.7.2).
M
3
= total volume of pores ¼ 3/4p porosity. Again, the total porosity can be
obtained precisely by other methods that do not need to assume pore shape
(see Section 2.7.2).
7.4.3 Pore shapes
The shape of pores can be quantified in the same way as for crystals and grains
(see Section 4.3.3). However, simple aspect ratio parameters are used most
commonly. Small vesicles commonly have the form of an ellipsoid and hence
their shape can be specified by their aspect ratio (e.g. Rust et al., 2003). Pore
orientationcanagainbequantifiedinthe same way as for grains (see Section 5.5).
A commonly used measure is the orientation of the long axis of the pore with
respect to a structurally important direction, such as flow for lavas. The overall
texture of pores can also be described in terms of fractals (Meng, 1996).
7.5 Typical applications
Pore size distributions (PSDs) have been measured in a wide variety of rocks.
Some of the early studies that determined PSDs from measurements made on
sections used incorrect conversion methods; hence the data must be recon-
verted before it can be compared with measurements made in three dimensions
or using more accurate stereological techniques. The equivalent problem for
crystals is discussed in Section 3.3.4.6.
Partially molten rock contains silicate-liquid-filled pores and can be studied
in the same way as other porous materials. In some cases the liquid is preserved
as a glass, but in many plutonic rocks its presence must be inferred from the
textures of minerals considered to pseudomorph the original melt-filled pores.
So far pore structure has been explored by measurement of dihedral angles of
solid–solid–liquid intersections and these results are discussed in Chapter 5.
7.5.1 Volcanic rocks
Quantitative study of vesicles is a very active research field of volcanology
because nucleation and growth of bubbles can trigger and drive volcanic
228 Textures of fluid-filled pores