Hill A.V. The Encyclopedia of Operations Management: A Field Manual and Glossary of Operations Management Terms and Concepts
Подождите немного. Документ загружается.

ptg6843605
lean thinking
–
lean thinking
The Encyclopedia of Operations Management Page 196
Many lean consultants teach that lean is about simplifying processes, but then over-complicate lean by using
too many Japanese words and focusing more on lean tools than on lean philosophy. After 25 years of study, this
author believes that lean thinking can be summarized in just five words as shown in the simple diagram below.
Lean is about making processes simple and visual. Once processes are simple and visual, it becomes easier
for people in the “gemba” to make them error-proof and to eliminate waste. Once processes are simple, visual,
error-proof, and wasteless, it is important to make them standard so that the benefits are sustainable. Lastly,
respect for people before, during, and after the process improvement activity is critical to success.
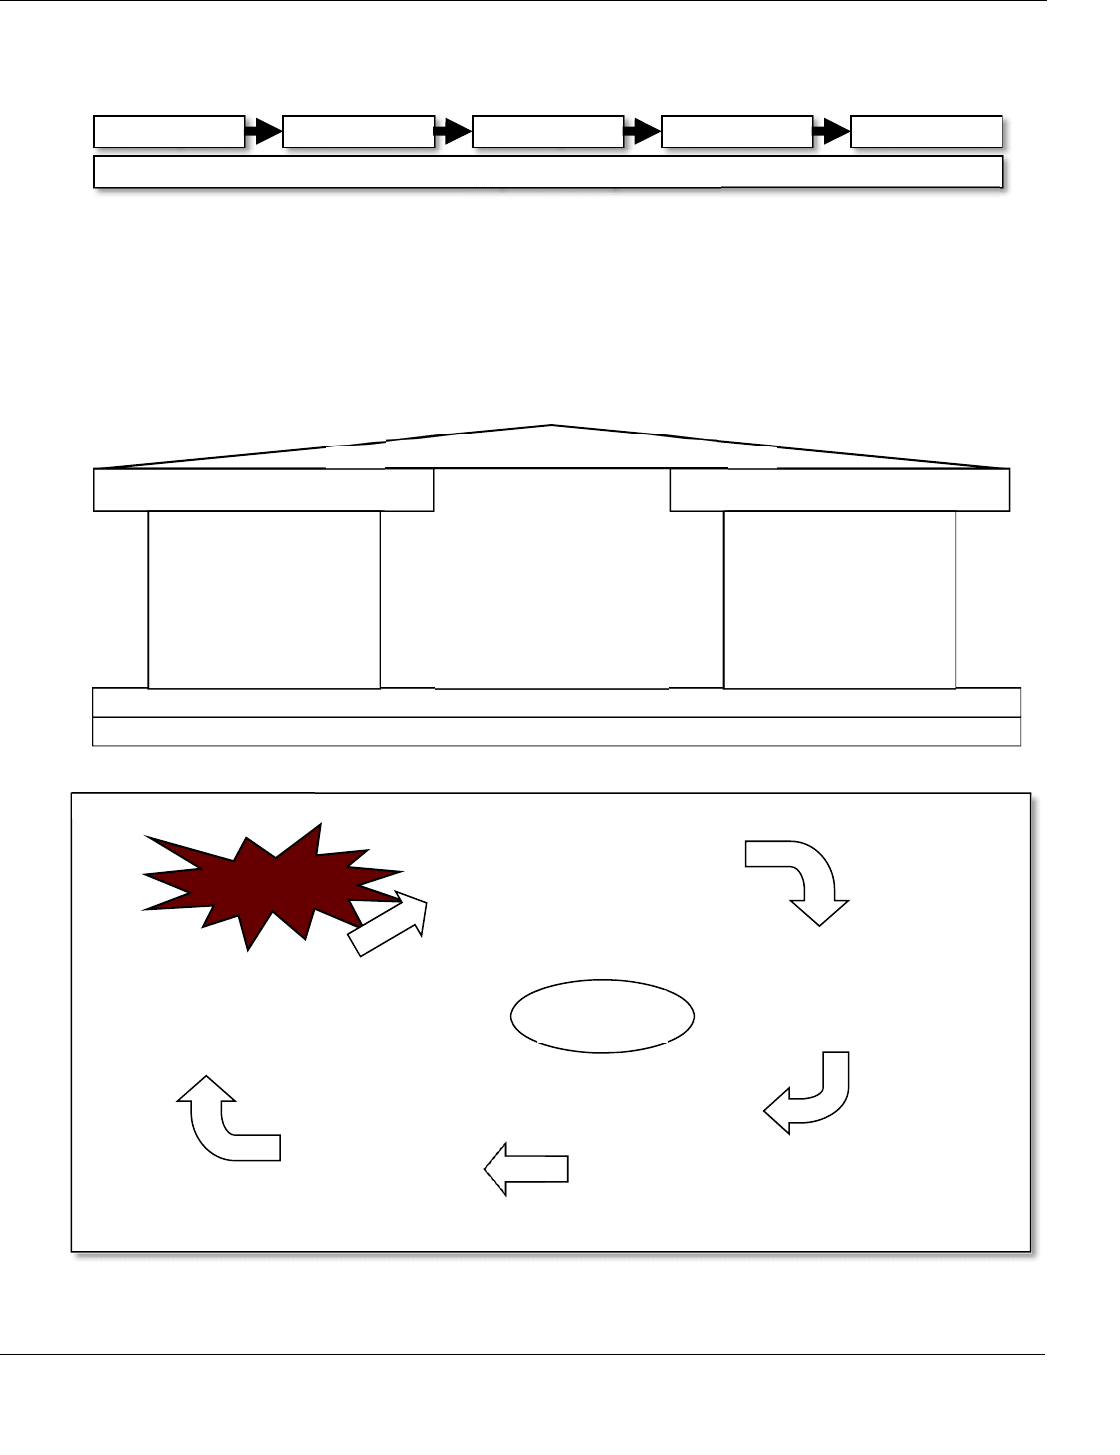
The house of lean
– The popular
house of lean
figure shown below is often used to teach the fundamentals
of lean thinking. A similar figure appears in the Ohno (1978) book. This figure is adapted from Pascal (2002).
The left side focuses on managing materials, the right side focuses on managing the manufacturing process, and
the bottom focus on the fundamentals. Definitions for the terms in this figure can be found in this encyclopedia.
Lean for process improvement
– The “virtuous cycle of lean” is shown in the figure below.
The cycle begins by identifying waste using the 8 wastes framework, value stream mapping, causal maps (or
Ishikawa Diagrams), and Pareto Analysis. Once waste has been identified, it is eliminated (or at least reduced)
Simple Visual Error-proof Wasteless Standard
Respect for People
Source: Professor Arthur V. Hill
Stability: Standardized work, 5S, jidoka, TPM, heijunka, kanban
Standardization: Standardized work, kanban, A3 thinking, visual order (5S), hoshin planning
Flow
Heijunka
Takt time
Pull system
Visual order (5S)
Robust process
Just-in-Time
Error proofing
Zone control
Visual order (5S)
Problem solving
Abnormality control
Separate human and
machine work
Jidoka
Standardized work
5S
TPM
Suggestions
Safety activities
Hoshin planning
Involvement
The house of lean
Customer Foc
us
1. Identify waste
1. Understand the 8 wastes.
2. Use process analysis tools (VSM,
Causal Maps, and Pareto Analysis).
2. Simplify
3. Reduce complexity.
4. Use visual controls.
5. Implement 5S.
6. Convert to cells.
5. Implement
7. Implement with respect for people.
8. Measure lean metrics.
9. Manage projects/kaizen events well.
10. Create standardized work.
11. Guide with a program management
office
Visibility
3. Error proof
12. Error proof products & processes.
13. Apply Failure Mode and Effects
Analysis (FMEA).
14. Practice Total Productive
Maintenance
(
TPM
)
.
Source: Professor
Arthur V. Hill
Eliminate
waste
The virtuous cycle of lean
4. Flow
15. Level the schedule.
16. Focus on time.
17. Pull rather than push.
18. Reduce setup costs and
lotsizes.

ptg6843605
learning curve − learning curve
Page 197 The Encyclopedia of Operations Management
by making the process simpler, more visible, and more error-proof. Flow is then achieved by leveling the
schedule, reducing cycle time, using a pull system, and reducing setup costs, setup times, and lotsizes (one-piece
flow is the ideal). Finally, implement changes with respect for people (the gemba), focusing on lean metrics,
such as the value added ratio, using well-executed kaizen events, and creating standardized work, all guided by a
strong program management office. The virtuous cycle is self-reinforcing because the new improvement process
will be even more visible, which makes it easier to see and eliminate waste. This figure was developed by this
author and has been validated from first-hand experience with many factory and hospital lean implementations.
Spear and Bowen’s five rules – Spear and Bowen (1999) defined five rules that capture much of the lean
philosophy at Toyota. They emphasized that lean is more of a philosophy than a set of tools. These four rules
are briefly described as follows:
Rule 1. Specifications document all work processes and include content, sequence, timing, and
outcome – Each process should be clearly specified with detailed work instructions. For example, when
workers install seats with four bolts, the bolts are inserted and tightened in a set sequence. Every worker
installs them the same way every time. While lean thinking shows respect for people and values
experimentation (using PDCA), individual workers do not change processes. Teams work together to
experiment, analyze, and change processes. Workers need problem-solving skills to their support teams in
improving standard processes over time.
Rule 2. Connections with clear yes/no signals directly link every customer and supplier – Lean uses
kanban containers (or squares) that customers use to signal the need for materials movements or production.
Rule 3. Every product and service travels through a single, simple, and direct flow path – Toyota’s U-
shaped workcells are the ultimate manifestation of this rule. This improves consistency, makes trouble
shooting easier, and simplifies material handling and scheduling.
Rule 4. Workers at the lowest feasible level, guided by a teacher (Sensei), improve their own work
processes using scientific methods – Rule 4 is closely tied with Rule 1 and engages the entire workforce in
the improvement efforts.
Rule 5. Integrated failure tests automatically signal deviations for every activity, connection, and flow
path – This is the concept of jidoka or autonomation. It prevents products with unacceptable quality from
continuing in the process. Examples include detectors for missing components, automatic gauges that check
each part, and visual alarms for low inventory. The andon light is a good example of this rule.
See 3Gs, 5S, 8 wastes, A3 Report, absorption costing, agile manufacturing, agile software development,
andon light, batch-and-queue, blocking, Capability Maturity Model (CMM), catchball, cellular manufacturing,
champion, continuous flow, cross-training, defect, demand flow, Drum-Buffer-Rope (DBR), facility layout, flow,
functional silo, gemba, heijunka, hidden factory, hoshin planning, ISO 9001:2008, jidoka, JIT II, job design,
Just-in-Time (JIT), kaizen, kaizen workshop, kanban, Keiretsu, KISS Principle, Lean Advancement Initiative
(LAI), lean design, Lean Enterprise Institute (LEI), lean promotion office, lean sigma, milk run, muda,
multiplication principle, one-piece flow, Overall Equipment Effectiveness (OEE), overhead, pacemaker, pitch,
process, process improvement program, program management office, project charter, pull system, Quick
Response Manufacturing, red tag, rework, scrum, sensei, Shingo Prize, Single Minute Exchange of Dies (SMED),
stakeholder analysis, standardized work, subtraction principle, supermarket, takt time, Theory of Constraints
(TOC), Toyota Production System (TPS), transactional process improvement, true north, two-bin system, value
added ratio, value stream, value stream manager, value stream map, visual control, waste walk, water spider,
zero inventory.
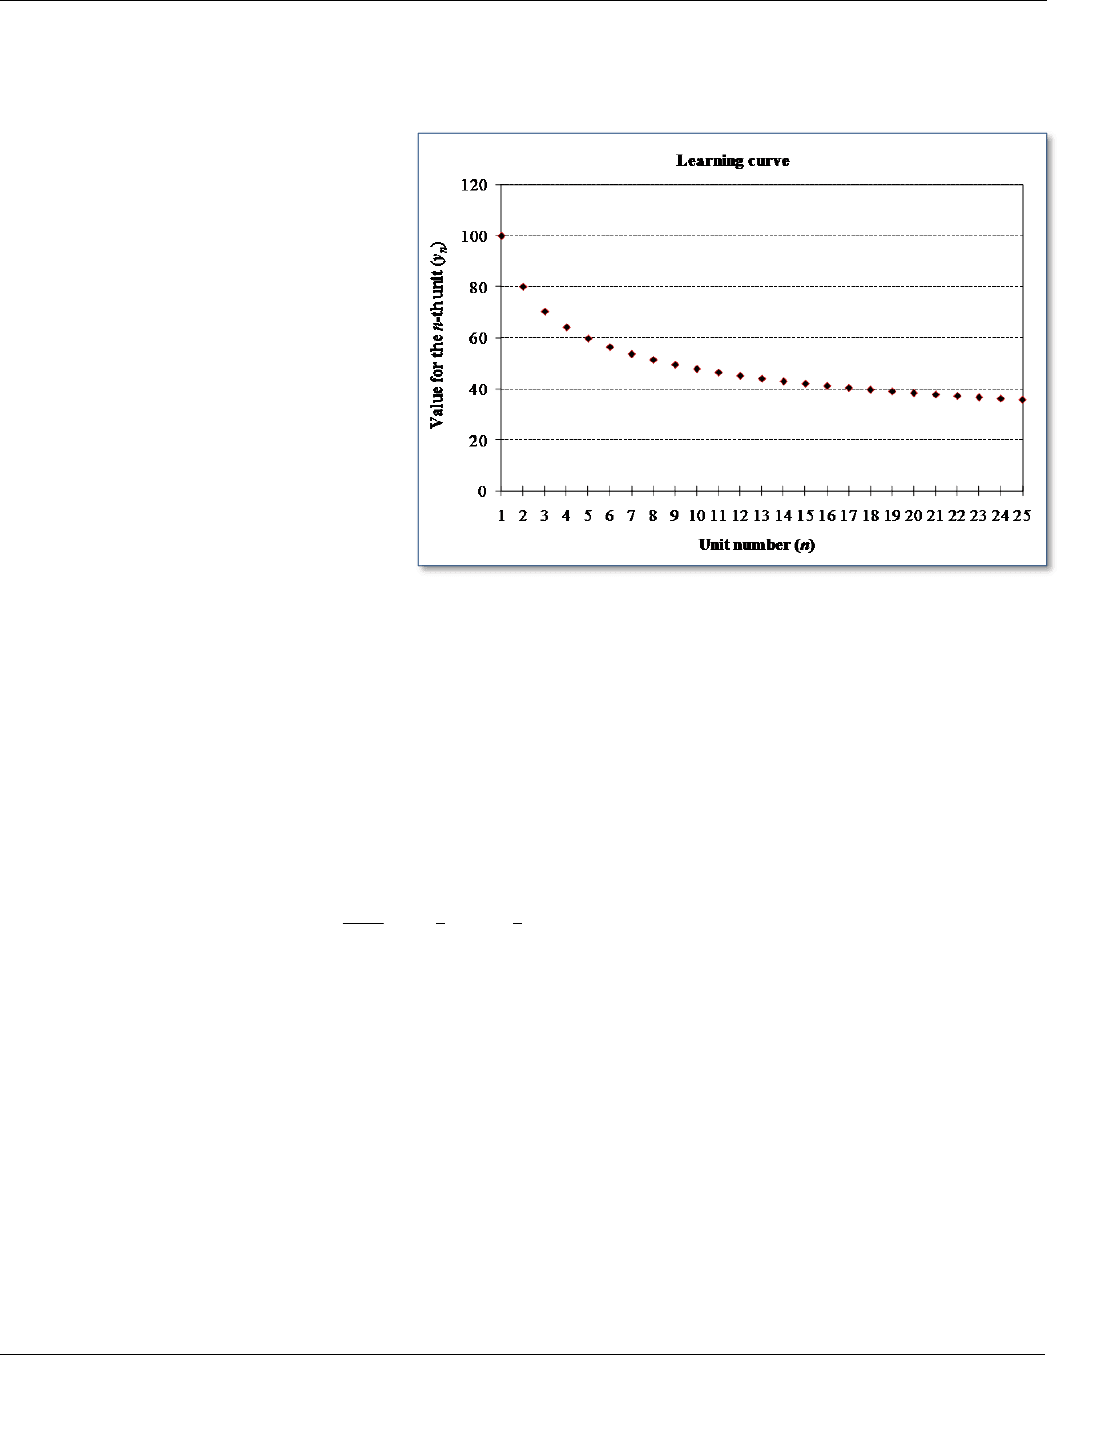
learning curve – A mathematical model that relates a performance variable (such as cost per unit) to the number of
units produced, where the performance variable decreases as the cumulative production increases, but decreases
at a slower rate; also called experience curve.
All systems can improve over time, and the rate of improvement can and should be measured. This learning
can take place at any level: the machine, individual, department, plant, business unit, and firm. Some authors
use the term “experience curve” for more complex systems, such as factories or firms; however, there is no
practical difference between the learning curve and experience curve concepts.
The performance variable is usually the cost per unit or time per unit, but could be any variable that has an
ideal point of zero. For example, other possible variables could be the defect rate (defects per million
ptg6843605
learning curve
–
learning curve
The Encyclopedia of Operations Management Page 198
opportunities, DPMO), customer leadtime, etc. Variables, such as yield and productivity, are not appropriate
performance variables for the learning curve because they do not have an ideal point of zero.
The graph below is an example of a learning curve with k = 80%, y
1
= 100, and a learning parameter of
b = 0.322. Learning curve graphs are only defined for integer values of n.
“Satisficing” is the practice of
meeting the minimum requirements
rather than seeking to improve over time.
People tend to “satisfice” if not given an
appropriate goal. The learning curve,
therefore, can be used to set appropriate
goals for improvement. The learning rate
can also be used to benchmark
organizational learning across
organizational boundaries. Every
measure in a balanced scorecard could
have a complementary measure for its
rate of learning.
With the learning curve, every time
the cumulative production volume
doubles, the cost goes down by a fixed
percentage. (The remainder of this
discussion will assume that the
performance variable is cost.) For
example, with an 80% learning curve, the cost goes down by 20% every time the cumulative production doubles.
If the unit cost for unit 1 is $100, the unit cost for unit 2 is $80, the unit cost for unit 4 is $64, etc.
The equation for the learning curve model is y
n
= y
1
n
–b
, where n is the unit number, y
n
is the cost for the n-th
unit, y
1
is the value for the first unit, and b is the learning parameter. The model requires that b ≥ 0 and uses a
negative sign in the model. Many textbooks present the model without a negative sign and have
b ≤ 0.
For a k-percent learning curve, the cost goes down by (1−k)% every time the cumulative production doubles.
If the learning rate parameter k is known, the learning curve is given by ln( ) / ln(2)b k . Conversely, if the
learning parameter b is known, the learning rate parameter is k = 2
–b
.
For example, for an 80% learning curve, k = 0.8 and b = 0.322. With y
1
= 100, the unit cost for the first 8
units is 100, 80, 70, 64, 60, 56, 53, and 51. (Note that these values are rounded to the nearest integer.)
The cumulative cost through the n-th unit is given by the following approximation (Camm, Evans, & Womer
1987; Badiru 1992):
(1 ) (1 )
1
1 1
2 2
1
( ) ( )
1
n
b b
n i
i
y
Y y n
b
. This approximation was tested for k = 0.8 and was
found to have an absolute percentage error of less than 2% when n = 1. The error approaches zero as n increases,
with an error of less than 0.03% for n > 100. This equation can be used to estimate the average cost through the
n-th unit as
/
n n
A Y n
.
The easiest approach for estimating the learning parameter from historical data is to find the value that fits
the curve to the first and last observed historical values
1
ln( / ) / ln( )
n
b y y n
. The parameter y
1
for this model
is set to the first observed historical value. However, this approach places too much weight on the first and last
values and ignores the historical data in between.
Another approach recommended by some is to estimate the model parameters b and
1
y
with linear regression
on log transformed historical data. We first apply the natural log transform to both sides of the basic learning
curve equation to find
ln( ) ln( )
n
y a b n
, where
1
ln( )a y
. We then apply linear regression to the transformed
data to estimate the intercept (
1
ln( )a y
) and slope (b) for the line. We then estimate the intercept
1
exp( )y a
and learning rate
2
b
k
. However, linear regression poses some serious technical problems due to

ptg6843605
learning organization − less than truck load (LTL)
Page 199 The Encyclopedia of Operations Management
autocorrelation in the data. Several methods, such as first differences, can be used to try to compensate for the
autocorrelation problem, but that is beyond the scope of this document. Note that the required transformation is
not possible if the performance variable is zero for any historical observation.
See autocorrelation, balanced scorecard, half-life curve, human resources, learning organization, linear
regression, Moore’s Law, operations performance metrics, satisficing, workforce agility.
learning organization – An organization that has the ability to learn from its environment and improve its ability
to compete over time.
Most organizations today find that their current products and processes will become obsolete in a fairly short
period of time. Jack Welch, former chairman of the board and CEO of General Electric, emphasized this point in
his famous quote, “When the rate of change outside the company is greater than the rate of change inside the
company, then we are looking at the beginning of the end” (Caroselli 2003, page 137).
It is necessary, therefore, for managers to lead their organizations in such a way that their organizations have
built-in systems for improving (learning) over time. Learning organizations have the ability to transform their
organizational experiences into improved products, processes, and knowledge.
Organizations can learn from many sources, including:
Customers – To learn about customer’s needs and desires as they change over time.
Suppliers – To learn about new materials, technologies, and processes.
Research labs and technology suppliers – To learn about new product and process technologies being
developed by research labs, universities, and suppliers.
Workers – To document new processes and make tacit knowledge explicit.
Senge (1990) argues that learning organizations exhibit five main characteristics: systems thinking, personal
mastery, mental models, a shared vision, and team learning. This author has created the following list of
strategies that organizations can deploy to nurture and accelerate learning. Most of these described are described
in other entries in this encyclopedia.
Create knowledge management systems – To leverage information systems to codify and share
knowledge.
Measure learning – To assess and reward learning based on measurable performance improvement. The
learning curve and the half-life curve can be used for this.
Offer service guarantees – To reward customers for sharing their complaint information.
Pursue early supplier involvement – To get suppliers more involved in product design.
Benchmark best-in-class processes and products – To capture standards and processes to use as a basis of
comparison. See benchmarking.
Use cross-training, job rotation, job enlargement, and job enrichment to develop workers – To
disseminate learning within the firm.
Use co-location – To improve learning across different functions and firms. See co-location.
Implement cycle counting – To find the source of data integrity problems. See cycle counting.
Use post-project reviews – To evaluate what went well (reinforce behavior) and what could have been done
better (to identify new behaviors) when a project is completed. See post-project review.
Conduct root cause analysis after every adverse event – To learn what could have been done to prevent a
specific situation with an undesired (or desired) effect. See Root Cause Analysis (RCA).
See balanced scorecard, business intelligence, co-location, cross-training, cycle counting, half-life curve,
human resources, intellectual capital, intellectual property (IP), job enlargement, job rotation, knowledge
management, learning curve, Moore’s Law, operations performance metrics, post-project review, Root Cause
Analysis (RCA), satisficing, workforce agility.
legacy system – An existing computer-based information system that is only being used until a newer system is
fully operational.
The term “legacy” often implies that the old system has been in use for a long time and is becoming obsolete.
Legacy systems are often expensive to maintain because they are difficult to interface with new systems.
See Enterprise Resources Planning (ERP).
less than container load (LCL) – A shipment of a container that is not full; LCL can also refer to a customer’s
freight that is combined with others to produce a full container load.

ptg6843605
less than truck load (LTL) – Lewin/Schein Theory of Change
The Encyclopedia of Operations Management Page 200
See less than truck load (LTL), logistics, shipping container, truck load.
less than truck load (LTL) – A shipment that does not fill the truck or a shipment with less than the weight
needed to qualify for a truck load quantity discount.
LTL shipments do not qualify for full truck load (FTL) rates based on weight or volume and normally have a
longer delivery time due to consolidation with other LTL shipments. LTL is usually used to designate shipments
weighing between 100 and 10,000 pounds. These shipments are usually not economical to ship via parcel
shippers or FTL carriers and fall somewhere in between. This quantity of freight also involves more intermediate
handling than does truck load freight.
A typical LTL carrier collects freight from various shippers, consolidates that freight onto trailers, and sends
the shipment for line-haul. For delivery, a similar process is followed, where the freight from the line-haul trailer
is unloaded, re-sorted, and sent for delivery. In most cases, drivers make deliveries first and then pick up from
shippers once the trailer is empty. Therefore, most pickups are made in the afternoon and most deliveries are
performed in the morning.
The main advantage of using an LTL carrier is that a shipment may be transported for a fraction of the cost
of hiring an entire truck and trailer for an exclusive shipment. A number of additional services are also available
from LTL carriers that are not typically offered by FTL or parcel carriers. These services include liftgate service
at pickup or delivery, residential (also known as “non-commercial”) service at pickup or delivery, inside
delivery, notification prior to delivery, freeze protection, and others. These services are usually billed at a
predetermined flat fee or for a weight-based surcharge calculated as a rate per pound or per hundred-weight.
See carrier, consolidation, cross-docking, less than container load (LCL), logistics, quantity discount,
shipping container, trailer, truck load.
level – See bill of material (BOM).
level loading – See load leveling.
level of service – See service level.
level production – See chase strategy, Heijunka, level strategy.
level strategy – A production planning approach that keeps the workforce level constant and satisfies seasonal
demand with inventories built during the off season, overtime, or subcontracting.
The level strategy maintains a constant workforce level and meets demand with inventory (built in the off
season), overtime production, subcontracting, or some combination thereof. In contrast with a chase strategy, the
workforce level is changed to meet (chase) demand.
Many firms are able to economically implement a chase strategy for each product and a level employment
overall strategy by offering counter-seasonal products. For example, a company that makes snow skis might also
make water skis to maintain a constant workforce without building large inventories in the off season. Other
examples of counter-seasonal products include snow blowers and lawn mowers (e.g., Toro) and snowmobiles
and all terrain vehicles (e.g., Polaris Industries).
See chase strategy, heijunka, load, load leveling, Master Production Schedule (MPS), production planning,
Sales & Operations Planning (S&OP), seasonality, subcontracting.
leverage the spend – Combine purchasing from multiple units in an organization to justify negotiation for lower
prices from a supplier.
An organization can “leverage the spend” with a supplier by combining all purchases across multiple
departments, plants, and divisions into one negotiated contract. This allows the organization to buy in larger
quantities, which gives it the power to bargain for a lower price. One common example is for Maintenance,
Repair and Operations (MRO) items (such as office supplies) purchased by a large multi-divisional
organization. Many organizations used to allow each department, location, plant, and division to buy its own
MRO supplies. The firm can often get a much better price from suppliers by combining “the spend” (all
purchases) across all divisions and all departments. The same concept can be used for many direct materials
(non-MRO items). Many consulting firms have made this concept a major part of their consulting services.
See consolidation, Maintenance-Repair-Operations (MRO), purchasing, spend analysis, Supply Chain
Management.
ptg6843605
Lewin/Schein Theory of Change
−
line balancing
Page 201 The Encyclopedia of Operations Management
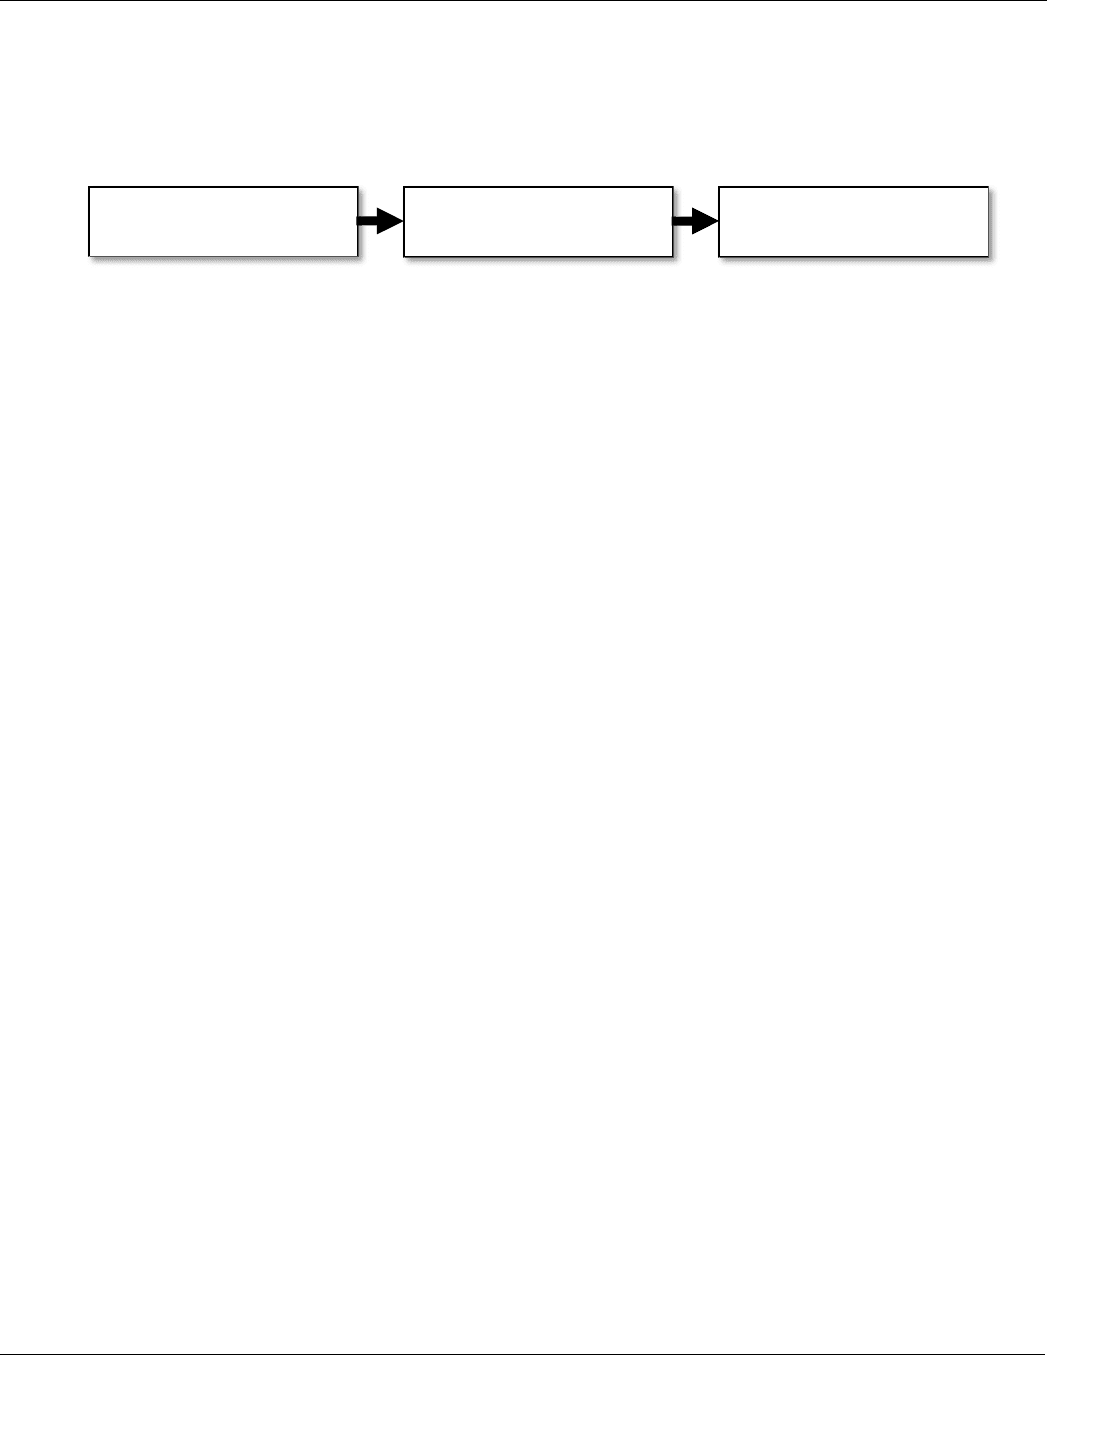
Lewin/Schein Theory of Change – A three-stage model developed by Kurt Lewin and Edgar Schein that
describes how individuals change; the three stages are unfreeze, change, and refreeze.
Kurt Lewin developed a three-stage model of change that has come to be known as the unfreeze-change-
refreeze model. Edgar Schein provided further detail for a more comprehensive model of change that he called
“cognitive redefinition.” The combined model is often called the Lewin/Schein Theory of Change or the
Lewin/Schein Change Model (Schein 1992). The three stages are described briefly below.
Unfreeze (motivate the change)
– Change requires adding new forces for change or removing some of the
existing factors that are at play in perpetuating the current behavior. This unfreezing process has three sub-
processes that relate to a readiness and motivation to change:
•
Disconfirmation
– Learning and change begins with dissatisfaction or frustration, such as not meeting
personal goals.
•
Survival anxiety
– When people accept the disconfirming information as valid, they feel “survival anxiety”
or guilt. However, this may not be sufficient to prompt change if “learning anxiety” is present.
•
Psychological safety
– Learning anxiety triggers defensiveness and resistance due to the pain of having to
unlearn what had been previously accepted. Three stages occur in response to learning anxiety: (1) denial,
(2) scapegoating and passing the buck, and (3) maneuvering and bargaining. It is necessary to move past the
possible anxieties for change to progress. This can be accomplished by either having the survival anxiety be
greater than the learning anxiety or, preferably, by reducing learning anxiety. Change agents can create
psychological safety by having people work in groups, providing positive visions for the learner, breaking
the learning process into small steps, providing coaching, etc.
Move (change what needs to be changed)
– Once sufficient dissatisfaction with the current conditions and
a sincere desire to change exists, it is necessary to identify exactly what needs to be changed. Three possible
impacts from processing new information are: words take on new or expanded meaning, concepts are interpreted
within a broader context, and the scale used to evaluate new input is adjusted. A concise view of the new state is
required to clearly identify the gap between the present and proposed state. Activities that aid in making the
change include imitation of role models and looking for personalized solutions through trial-and-error learning.
Refreeze (making the change permanent)
– Refreezing is the final stage where new behavior becomes
habitual, which includes developing a new self-concept and identity and also establishing new interpersonal
relationships. In the process improvement program literature, this is called the “control plan.”
The ADKAR model is very similar, but somewhat easier to understand and apply.
See ADKAR Model for Change, change management, control plan, force field analysis.
life cycle cost – See total cost of ownership.
life cycle planning – See product life cycle management.
lifetime demand – See all-time demand.
LIFO – See Last-In-First-Out (LIFO).
Likert scale – A psychometric scale commonly used in survey instruments.
When responding to a Likert-scaled item on a survey, respondents typically specify their level of agreement
to a statement. The following is an example of a five-point Likert scale often used by this author and his research
colleagues: 1 = Disagree strongly, 2 = Disagree, 3 = Neutral, 4 = Agree, 5 = Agree strongly. Note that each
phrase in this scale starts with either Disagree or Agree.
The Likert scale is named after Rensis Likert, who published a report describing its use (Likert 1932). The
proper pronunciation is “lick-urt” rather than “lie-kurt.”
line balancing – The problem of assigning tasks to workstations to minimize the number of workstations required
while still satisfying the cycle time and precedence constraints.
A perfectly balanced process will have all steps in the process working at exactly the same rate. This will
result in no idle time for any step and no inventory between steps. When designing an assembly line, many tasks
(elements) need to be assigned to workstations. These assignments are constrained by the cycle time for the line
UNFREEZE
Motivate the change
CHANGE
Make the change
REFREEZE
Sustain the change

ptg6843605
line extension – linear regression
The Encyclopedia of Operations Management Page 202
(i.e., one completion every five minutes) and the precedence relationships between the tasks (i.e., some tasks
need to be done before others). Many operations researchers have developed sophisticated mathematical
computer models to solve this problem. The line balancing problem is less important when the organization can
use cross-trained workers who can move between workstations as needed to maximize flow.
See assembly line, cross-training, facility layout.
line extension – A new product that is a variation of an existing product.
Line extensions are not significantly different from the original product and almost always share the same
brand. Examples include a new package size, a new flavor, or a new ingredient. For example, Cheerios cereal
now comes in many variants, with different flavors and package sizes.
See New Product Development (NPD).
line fill rate – See service level.
line of visibility – The line that separates a service operation into back office operations (that take place without the
customer) and front office operations (that are in direct contact with the customer).
See back office, service blueprinting, service management, service quality.
linear programming (LP) – A mathematical approach for finding the optimal value of a linear function of many
variables constrained by a set of linear equations of the same set of variables.
LP is one of many optimization techniques used in mathematical programming, which is one of the main
tools used in operations research. A linear program must have a single objective function, which is the linear
equation for the variable to be optimized. The LP must also have a set of linear constraints that must be satisfied.
LP has been applied to many operations problems. The most important problems are as follows:
The assignment problem – Match the items needing assignment with the possible assignments (locations)
to minimize the total cost subject to the constraint that each item must have exactly one location and each
location must have exactly one item. See the assignment problem entry for more detail.
The transportation problem – Find the amount of a product to send from plant i to market j to minimize
total cost. Constraints include (a) the need to exactly satisfy the market demand and (b) the requirement that all
available product be shipped somewhere. This problem can easily be extended to handle multiple periods (where
the product is “shipped” from one period to the next) and multiple products (commodities). Special-purpose
algorithms called network algorithms can solve the multiple-period, single-commodity problem very efficiently.
See the transportation problem entry for more detail.
The blending problem – Find the optimal blend of ingredients to minimize the total cost while still meeting
nutritional constraints.
The product mix problem – Find the optimal product mix to maximize the contribution to profit while still
meeting capacity and other constraints.
Mathematically, a linear program is expressed as: Minimize
1
n
j j
j
c x
subject to the constraints
1
N
ij j i
j
a x b
for constraints i = 1, 2, … , M. The x
j
are the decision variables, the c
j
are the coefficients of the objective
function, and the b
i
are the “right hand side” constraint coefficients.
The solution to a linear program provides the optimal values for each of the decision variables (the x
i
variables). In addition, the solution also provides “shadow prices” for each constraint. The shadow price is the
value added by relaxing a constraint by one unit. Shadow prices allow users to conduct “sensitivity analysis” to
experiment with a variety of what-if scenarios, such as increasing or decreasing resources.
Efficient computer code is available to solve linear programs with tens of thousands of variables. The Excel
Solver can solve smaller linear programs. Closely related mathematical programming tools include integer
programming (IP), mixed-integer programming (MIP), zero-one programming, network optimization, stochastic
programming, chance constrained programming, and goal programming.
See algorithm, assignment problem, integer programming (IP), mixed integer programming (MIP), network
optimization, Newton’s method, operations research (OR), optimization, product mix, production planning,
sensitivity analysis, transportation problem, Traveling Salesperson Problem (TSP), what-if analysis.

ptg6843605
linear regression − line-haul
Page 203 The Encyclopedia of Operations Management
linear regression – A standard statistical technique that is used to find an approximate linear relationship between
one or more independent (predictor) variables and a single dependent variable; also called regression and
regression analysis.
Linear regression is a powerful tool for both forecasting and understanding the relationships between two or
more variables. Linear regression fits a linear equation to a set of historical data points to minimize the sum of
the squared errors between the fitted linear equation and the historical data points.
The simplest type of regression is a trend line that relates the time period t to the dependent variable y
t
. The
parameters for the linear model
t t
y a bt
can be estimated to minimize the sum of the squared errors
2
1
n
t
t
with the equations
1 1
6 2
ˆ
( 1) 1
n n
t t
t t
b ty y
n n n
and
1
1
ˆ
ˆ
( 1) / 2
n
t
t
a y b n
n
. The equation for the
ˆ
b
parameter must be solved before the equation for the
ˆ
a parameter. In Excel, the formula
INDEX(LINEST(y_range),1,1) returns the slope and INDEX(LINEST(y_range),1,2) returns the intercept for a
trend line and TREND(y_range,,n+k) returns the k-th value ahead in the y_range time series with n values.
(Note that the two commas indicate that the x_range is not used.)
For simple linear regression with two variables, the input data consists of n observations on a single
independent variable (x
1
, x
2
, … , x
n
) and a single dependent variable (y
1
, y
2
, … , y
n
). The parameters for the linear
model
i i i
y a bx
can be estimated to minimize the sum of the squared errors
2
1
n
i
i
using
1 1 1
2
2
1 1
( )
ˆ
n n n
i i i i
i i i
n n
i i
i i
n x y x y
b
n x x
and
1 1
ˆ
1
ˆ
n n
i i
i i
b
a y x
n n
. The
ˆ
b
parameter must be solved before the
ˆ
a parameter.
The Excel function TREND(y_range, x_range, new_x_range) is useful for projecting trends into the future.
Excel charts can also show a trend line. The Excel formula INDEX(LINEST(y_range, x_range),1,1) calculates
the slope and INDEX(LINEST(y_range, x_range),1,2) calculates the intercept for a trend line.
For multiple regression, the input data consists of M observations on a single dependent variable (y
i
, i = 1,
2, …, M) and the N independent variables (x
i1
, x
i2
, … , x
iN
). The goal is to estimate the
j
parameters for the
linear model
0 1 1 2 2
...
i i i N Ni i
y x x x
that minimize the sum of the squared errors, where
i
is the
error for the i-th observation. In other words, the least squares fit minimizes the sum
2
1
M
i
i
. Multiple regression
uses matrix algebra to estimate the
j
parameters and evaluate the fit of the model.
Simple and multiple linear regression can also be done in Excel with Tools/Data Analysis/Regression. (If
Data Analysis is not listed under Tools, then go to Add-ins and check the Analysis ToolPak to load this feature
into your version of Excel.) A more direct approach for simple linear regression is to use
INDEX(LINEST(y_range, x_range),1,1) to return the slope and INDEX(LINEST(y_range, x_range),1,2) to
return the intercept. It is easy to extend this approach to access all the parameters and statistics for both simple
and multiple regression. See Excel’s Help menu for more details.
Although Excel can be used for most simple statistical analyses, its multiple regression capability is limited
because the input range must consist of contiguous (adjacent) columns of x variables. Most people involved in
serious statistical analysis use dedicated statistical software packages, such as Minitab, SPSS, SAS, or Jump.
See any standard statistics textbook for more information on this subject.
See Analysis of Variance (ANOVA), Bass model, Box-Jenkins forecasting, correlation, dampened trend,
discriminant analysis, Durbin-Watson Statistic, econometric forecasting, forecast error metrics, forecasting,
half-life curve, lean sigma, learning curve, logistic regression, outlier, scatter diagram, Theta Model, time series
forecasting, trend.

ptg6843605
linearity – locator system
The Encyclopedia of Operations Management Page 204
linearity – See heijunka.
line-haul – The longest leg of a shipment; also, the movement of freight between terminals.
See logistics.
Little’s Law – A fundamental queuing theory principle developed by MIT Professor John D. C. Little (Little 1961)
that shows that the relationship between the average time in system (W
s
), the average arrival rate (
), and the
average number in system (
s
L
) is given by
s
s
L W
for a system in steady state.
In other words, the average number of customers (units, calls, etc.) in the system in steady state is equal to
the product of the average arrival rate and the average time in system. For example, if a bank has an average
arrival rate of
= 10 customer/hour and the average time in system is
s
W
= 1 hour, the average number in
system is
s
L
= 10 customers. Similarly, the relationship between the average time in queue, average arrival rate,
and average number in queue is
q q
L
W
, which means that the number of customers waiting in queue is the
average arrival rate times the average time in queue. Both forms of the equation are considered Little’s Law.
Little’s Law can also be written as
/
s s
W L
to find the average time in system. For example, if a factory
has an average demand rate (
) of 10 orders per day and the current work-in-process inventory (
s
L
) is 100
orders, the average time in system (
s
W
) for an order will be
/
s s
W L
=100/10 = 10 days.
The average time in system is the sum of the average time in queue plus the average service time. This is
written mathematically as
1/
s q
W W
, where
is the mean service rate and 1/
is the mean service time.
See capacity, cycle time, periods supply, queuing theory, time in system, wait time, Work-in-Process (WIP)
inventory.
load – (1) In a production planning context: The amount of work (demand) planned for a resource in a given time
period; the requirements (in hours of work) for a resource in a time period. (2) In a logistics/transportation
context: Anything that is to be moved from one location to another.
In the production planning context, load is usually expressed in terms of standard hours of work. Load is a
measure of the actual (or forecasted) requirements for a resource. Therefore, load is used to determine if a
resource is in an under- or over-capacity situation.
A load report shows the number of planned hours of work in each time period (e.g., day) and compares it to
the capacity for that same time period. A load report is a simplified version of an input/output control report.
See Advanced Planning and Scheduling (APS), backward loading, capacity, finite scheduling, heijunka,
infinite loading, input/output control, level strategy, load leveling, project management, standard time.
load leveling – The practice of attempting to even out the requirements for machines, people, and other key
resources over time; also called level loading.
In both the project planning and manufacturing contexts, the goal is often to have a level (even) workload for
key resources (machines, people, etc.) over time. Production smoothing (also called production linearity) is a
key concept in lean manufacturing. (See the heijunka entry for more on production smoothing.) Some finite
planning manufacturing systems and some project management systems attempt to create schedules that
require about the same amount of a resource in every period. With finite loading, available capacity is an input,
whereas with load leveling, the average capacity requirement is an output.
See Advanced Planning and Scheduling (APS), Critical Path Method (CPM), finite scheduling, heijunka,
level strategy, load, project management.
load report – See load.
location analysis – See facility location.
locator system – An information system that (1) identifies storage locations where items are currently stored and
(2) finds appropriate storage locations for items that are going into storage.
A locator system is a fundamental tool in all modern Warehouse Management Systems (WMS). Locator
systems have several potential benefits, including:

ptg6843605
lockbox − logistics
Page 205 The Encyclopedia of Operations Management
• Maximize space utilization by assigning items to storage bins that are neither too small nor too large and by
allowing for random storage of items (instead of fixed storage locations) where any one SKU can be stored
in more than one location. (See the random storage location entry for more information.)
• Improve productivity by locating fast-moving products closer to more accessible locations and locating
items so they can be picked efficiently.
• Increase record accuracy by separating similar items.
Location systems require a logical location naming convention for warehouses, zones within warehouses,
aisles (or racks) within zones, bays or sections in an aisle, shelves (or levels) in a bay, and bins (for a specific
SKU). Real-time locator systems use RFID technology to help find items.
See fixed storage location, part number, random storage location, real-time, slotting, warehouse, Warehouse
Management System (WMS), zone storage location.
lockbox – A secure location used to receive checks in the mail, process them, and then transfer funds.
Lockboxes are more secure than typical business offices and can focus on receiving, capturing, and
truncating
29
checks and then transferring payments to the appropriate bank accounts. For example, Allianz, a
global insurance firm, uses a number of lockbox operations to process premium payments for insurance polices.
Lockbox services are often offered by larger banks. A well-run lockbox operation will be efficient and secure
and have minimal float (uncollected balances).
See Optical Character Recognition (OCR).
logistic curve – A growth curve that has an “S” shape as the market demand reaches a saturation point.
The logistic curve is ( ) / (1 exp( ))y t a c bt , where t is the time since introduction, y(t) is the cumulative
sales to time t, a is the saturation point (the maximum total market demand), and b is the coefficient of imitation.
The Richards Curve, a generalization of the logistic curve, is
1/
( ) / (1 exp( ( ))
c
y t d a c b t m
. The
additional parameters include d as the lower asymptote, b as the average growth rate, and m as time of maximum
growth. The Gompertz Curve has a similar shape and is given by
( ) exp( )
bt
y t a ce
, where t is the time since
introduction and a is the upper asymptote. Many researchers consider the Bass Model to be better than the
above models. Note that the logistic curve has nothing to do with logistics management.
See Bass Model.
logistic regression – Logistic regression is a statistical modeling approach used to predict a binary dependent
variable (the y response variable) based on a set of independent variables (the x variables); also called Binary
Logistic Regression.
The y variable is binary, which means that it can be either a zero or a one. The model can also be used to
estimate the probability that y = 1 for a given set of x values. Logistic regression can be a useful tool in the area
of quality for understanding the impact of variables on defects. Other applications include credit scoring
(determining which customers are worthy of credit), donor screening (determining which potential donors might
be more likely to donate), and niche marketing (determining which customers should receive a mailing).
For a single x variable, the logistic regression model has the form
0 1
0 1
ˆ
( )
1
x
x
e
p x
e
, where
ˆ
( )
p
x
is the
estimated probability that y = 1 for the given x value. The parameters
0
and
1
are usually estimated using a
Maximum Likelihood Estimation approach to provide the best fit with historical data. The model can be
extended to handle multiple x variables.
Logistic regression is closely related to Probit Analysis. Many statistical packages, such as SPSS, SAS, and
MINITAB, have logistic regression capabilities.
Note that logistic regression has nothing to do with logistics.
See cluster analysis, data mining, data warehouse, discriminant analysis, linear regression.
logistics – The organizational function responsible for managing a company’s total distribution, transportation, and
warehousing needs.
29
Check truncation is the process of taking an image of the check, using Optical Character Recognition (OCR) to convert the
information into digital form, and storing the checks until no longer needed.