James I.N. Introduction to Circulating Atmospheres
Подождите немного. Документ загружается.

6.2 Barotropic model 179
regarded as the result of interference between an equatorward propagating
wavetrain and a reflected poleward propagating train. It is difficult to
justify the existence of such reflecting regions in more realistic models of the
atmosphere.
As the packet propagates in the meridional direction, it will encounter
changing local values of parameters such as ft — U
yy
. Provided the distance
over which such changes take place is in some sense long compared to the
dimensions of the Rossby wave, it is possible to make some predictions
about the evolution of the propagating packet. The technique is called 'ray
tracing'; it is frequently employed in many branches of physics such as optics
and electromagnetic propagation through an inhomogeneous medium. In
such applications, there is frequently a huge scale separation between the
wavelength of the waves and the variations of the medium through which
they propagate. When this is the case, the slowly varying approximation is
extremely good. In our atmospheric application, it is much more doubtful
whether the mathematical conditions for the application of ray tracing can
be rigorously justified. The application of ray tracing can be defended as
providing an initial conceptual model of atmospheric forcing and can be veri-
fied by comparison with less restrictive, but correspondingly more complex,
models. We may rewrite the dispersion relation, Eq. (6.13), in the form:
co
= co(k,P), (6.20)
where ft = (P—U
yy
) is the basic parameter controlling the propagation. Then,
using the identities dk/dy = dl/dx
9
dk/dt = -dco/dx and dl/dt = - dw/dy,
it can be shown that the rate of change of frequency following the wave
packet is:
%r
=
(¥)
f'
(6
-
21)
where
denotes the rate of change following the wave packet. But in our linearized
model, jS does not vary in time; it therefore follows from Eq. (6.21) that the
packet conserves its frequency as it propagates. For the steady waves we
are currently discussing, this is of course simply zero. A similar relationship
describing the variation of wavenumber of the packet can also be derived:
Dt
180 Wave propagation
and
steady eddies
Since
the
basic state
is
purely zonal,
ft
depends upon
y
only
and so the
zonal wavenumber
of a
packet
is
conserved.
In
contrast,
its
meridional
wavenumber will evolve
as the
packet moves from
one
latitude
to
another.
The meridional wavenumber could
in
principle
be
derived
by
integrating
Eq. (6.23) with respect
to
time.
In
practice,
it is
much simpler
to use the dia-
gnostic relationship based
on the
dispersion relation with
co
= 0, Eq.
(6.14).
Since we know
co,
k and / as
functions
of
latitude, we
can
calculate
the
group
velocity
at any
location.
The
trajectory followed
by the
packet
of
Rossby
waves
is
therefore described
by:
d* 2pk
2
/r
^
A x
IF
-
IF
and
where
/
= ±^K
2
-k
2
.
(6.14)
Consider
the
propagation
of a
wave packet with zonal wavenumber
k
away
from some midlatitude source.
Two
trajectories
are
possible provided that
k
< K
s
;
one, corresponding
to the
negative root
in Eq.
(6.14),
is
directed
to
the south, while
the
positive root leads
to a
northward trajectory.
In
general,
we expect that
K
s
will increase
as the
subtropics
are
approached.
At
some
critical latitude, where
U
changes sign,
K
s
will first become extremely large
and then imaginary.
As K
s
becomes larger,
/
must become larger,
and so the
equatorward propagating
ray
will turn into
a
more meridional direction.
At
the same time, from
Eq.
(6.19),
the
group speed will become smaller.
As the
critical latitude
is
approached,
the
packet will propagate extremely slowly
in
a nearly meridional direction. The meridional scale
of
the Rossby waves will
become extremely small
(/
large). Indeed,
the
packet will, according
to
this
linear theory, take
an
infinite time
to
reach
the
critical latitude, which will
act
as
something
of a
'black hole'
to
Rossby wave information approaching
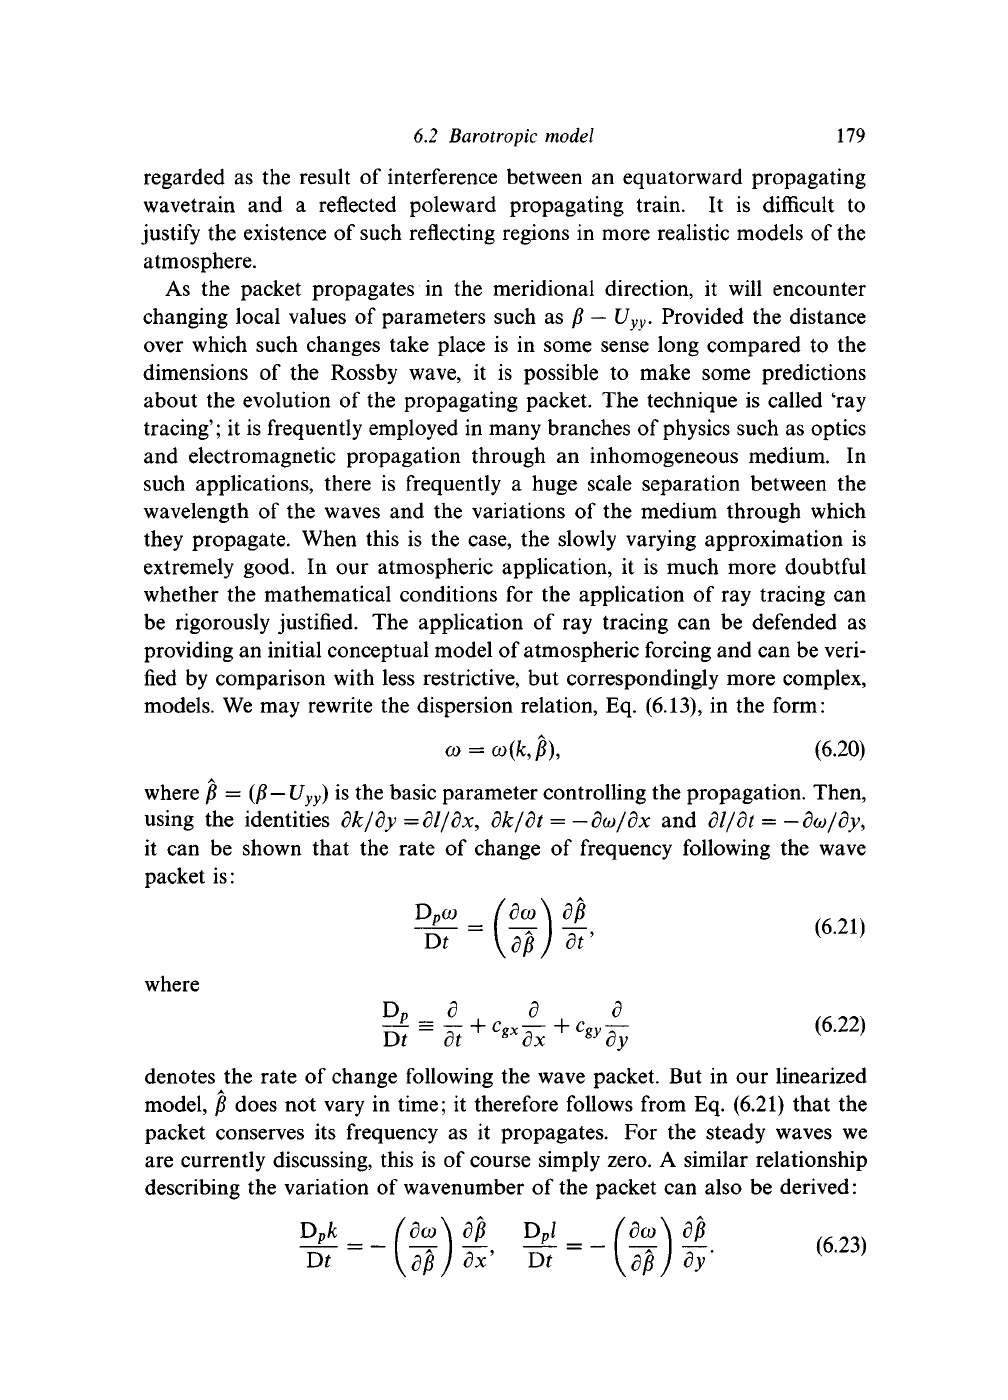
it from higher latitudes. Figure
6.11
gives
a
schematic illustration
of the
approach
to the
critical latitude.
If the
effect
of
friction were included,
we
might anticipate that
the
slowly moving, short length scale packet would
be
dissipated
in the
vicinity
of the
critical line.
In a
truly inviscid world,
the
linear theory would break down
in
the vicinity
of
the critical latitude.
A
more
sophisticated analysis suggests that
in
these circumstances,
the
critical line
might partially reflect some
of
the wave activity incident upon it. Whether
or
not such reflection
is
important
in the
atmosphere
is
difficult
to
determine.
6.2 Barotropic model 181
U=0
Fig. 6.11. Schematic illustration showing an equatorward Rossby ray approaching a
critical latitude where (7 = 0. The variation of K
s
is shown, and the crosses indicate
the location of the packet after equal intervals of time.
Evidence from the observed steady momentum fluxes (see below) suggests
that rather little reflection can be taking place. But the breakdown of zonality
and stationarity of the basic flow make it very difficult to interpret the details
of behaviour observed near U = 0.
For the poleward propagating ray, the packet will in general move into
an environment where K
s
is smaller. Once more, it may become imaginary
at some latitude where j8 becomes smaller than U
yy
, though such a latitude
is much less pathological than a critical latitude where U changes sign. As
K
s
becomes smaller, the packet will adjust by acquiring a smaller /, i.e., by
becoming more extended in the meridional direction. That is, the ray will
turn into a more zonal direction. Eventually, at a latitude where K
s
= k, it
will become completely zonal. The scale assumption of small spatial scale
of the packet compared to the scale of variations of K
s
becomes invalid
as such a latitude is approached and, strictly, a different analysis is needed
in this region. For our present purposes, it is enough to note that the
meridional wavenumber continues to decrease and becomes negative. The
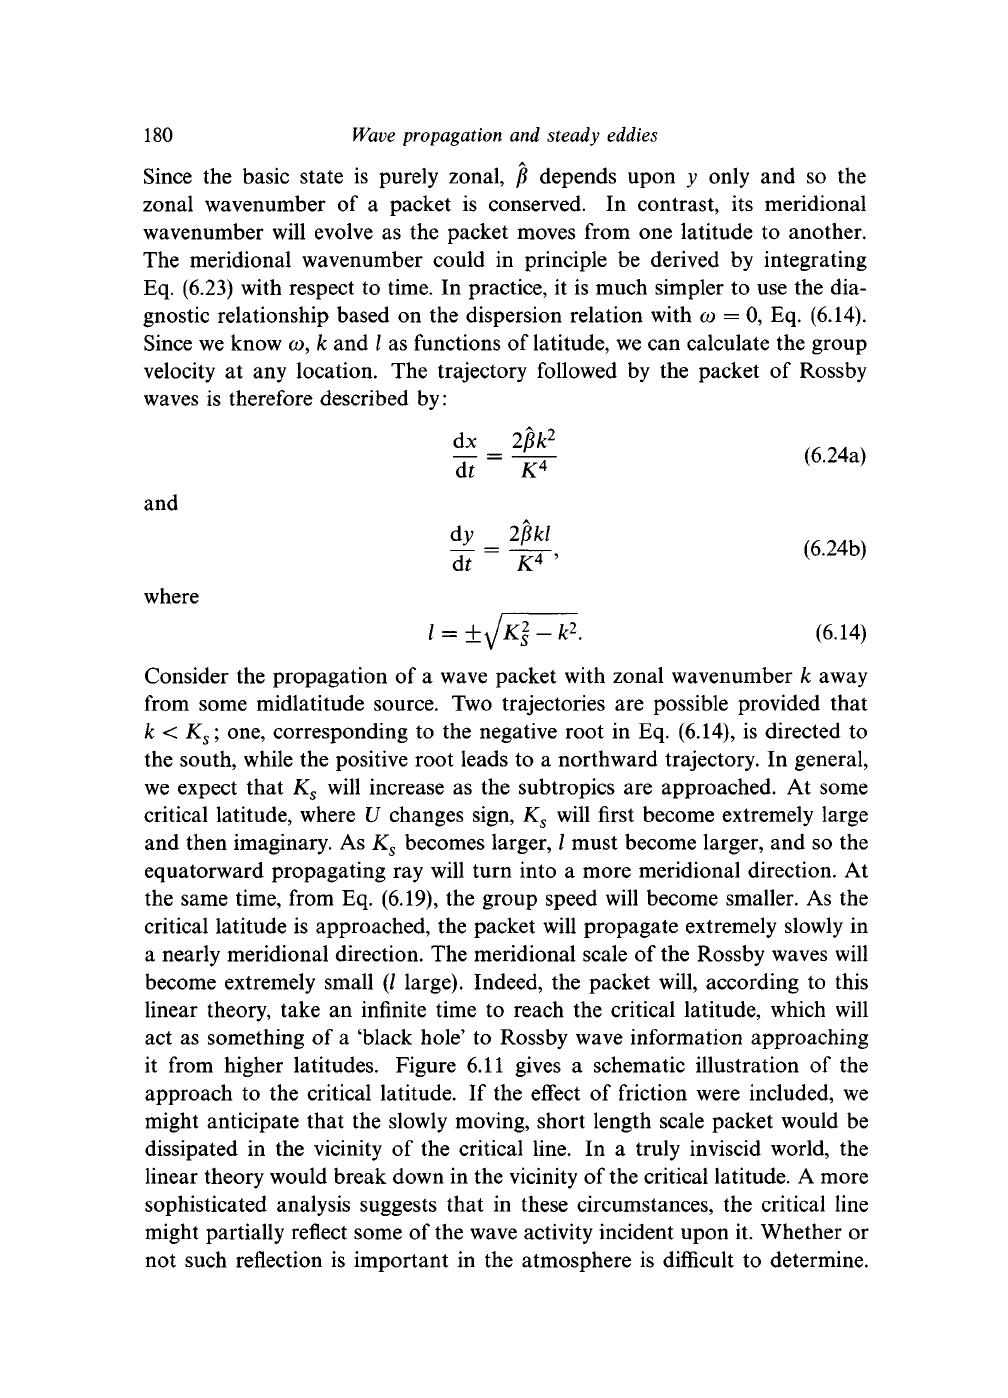
ray is refracted away from the K
s
= k latitude and back into lower latitudes,
as shown in Fig. 6.12. Eventually it slows down and approaches the critical
latitude.
182 Wave propagation
and
steady eddies
U=0
Fig.
6.12. As Fig.
6.11,
but
illustrating
a
poleward propagating
ray
approaching
the
latitude where
K, = k.
A wind profile such
as:
U
= U
E
cos
</>
(6.25)
provides
a
particularly simple example
of
steady Rossby wave propagation.
Such
a
profile corresponds
to
uniform superrotation
of the
atmosphere with
angular velocity
U
E
/a
relative
to the
solid Earth.
It is
particularly simple
because
jS , U and U
yy
all
have
the
same cosine dependence
on
latitude
so
that
the
total steady wavenumber
K
s
is
simply given
by:
2
2Qa+U
E
K
s
=
—#V^*
(626)
which is independent of latitude. Rays are straight lines in this flow. The
longer waves propagate more meridionally while the shorter waves propagate
more zonally. If full spherical geometry is retained, the rays are found to
follow great circle tracks. Wave packets originating in one hemisphere will
pass into the opposite hemisphere before returning to the region in which
they were excited.
But generally, the zonal wind becomes easterly in the tropics. A critical
latitude where [7 = 0 is typical, and acts to isolate one hemisphere from
another. Let us return to the profile illustrated in Fig. 6.9. We imagine
that a wavemaker which excites a wide spectrum of wavenumbers has been
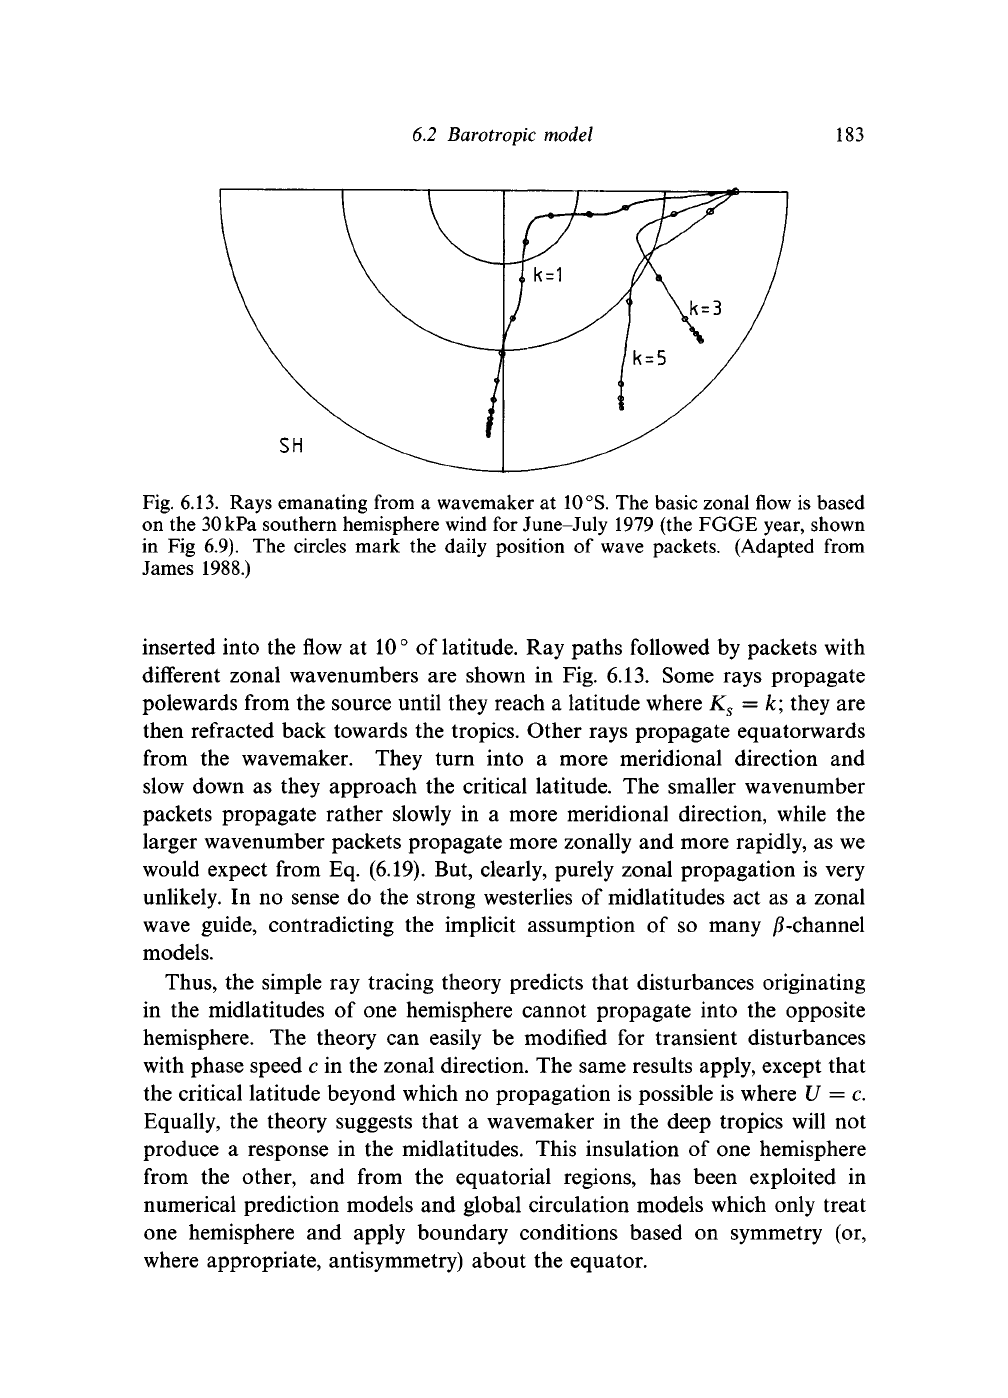
6.2 Barotropic model
183
SH
Fig. 6.13. Rays emanating from a wavemaker at
10
°S.
The basic zonal flow is based
on the 30kPa southern hemisphere wind for June-July 1979 (the FGGE year, shown
in Fig 6.9). The circles mark the daily position of wave packets. (Adapted from
James 1988.)
inserted into the flow at 10° of latitude. Ray paths followed by packets with
different zonal wavenumbers are shown in Fig. 6.13. Some rays propagate
polewards from the source until they reach a latitude where K
s
= k; they are
then refracted back towards the tropics. Other rays propagate equatorwards
from the wavemaker. They turn into a more meridional direction and
slow down as they approach the critical latitude. The smaller wavenumber
packets propagate rather slowly in a more meridional direction, while the
larger wavenumber packets propagate more zonally and more rapidly, as we
would expect from Eq. (6.19). But, clearly, purely zonal propagation is very
unlikely. In no sense do the strong westerlies of midlatitudes act as a zonal
wave guide, contradicting the implicit assumption of so many /^-channel
models.
Thus,
the simple ray tracing theory predicts that disturbances originating
in the midlatitudes of one hemisphere cannot propagate into the opposite
hemisphere. The theory can easily be modified for transient disturbances
with phase speed c in the zonal direction. The same results apply, except that
the critical latitude beyond which no propagation is possible is where U = c.
Equally, the theory suggests that a wavemaker in the deep tropics will not
produce a response in the midlatitudes. This insulation of one hemisphere
from the other, and from the equatorial regions, has been exploited in
numerical prediction models and global circulation models which only treat
one hemisphere and apply boundary conditions based on symmetry (or,
where appropriate, antisymmetry) about the equator.
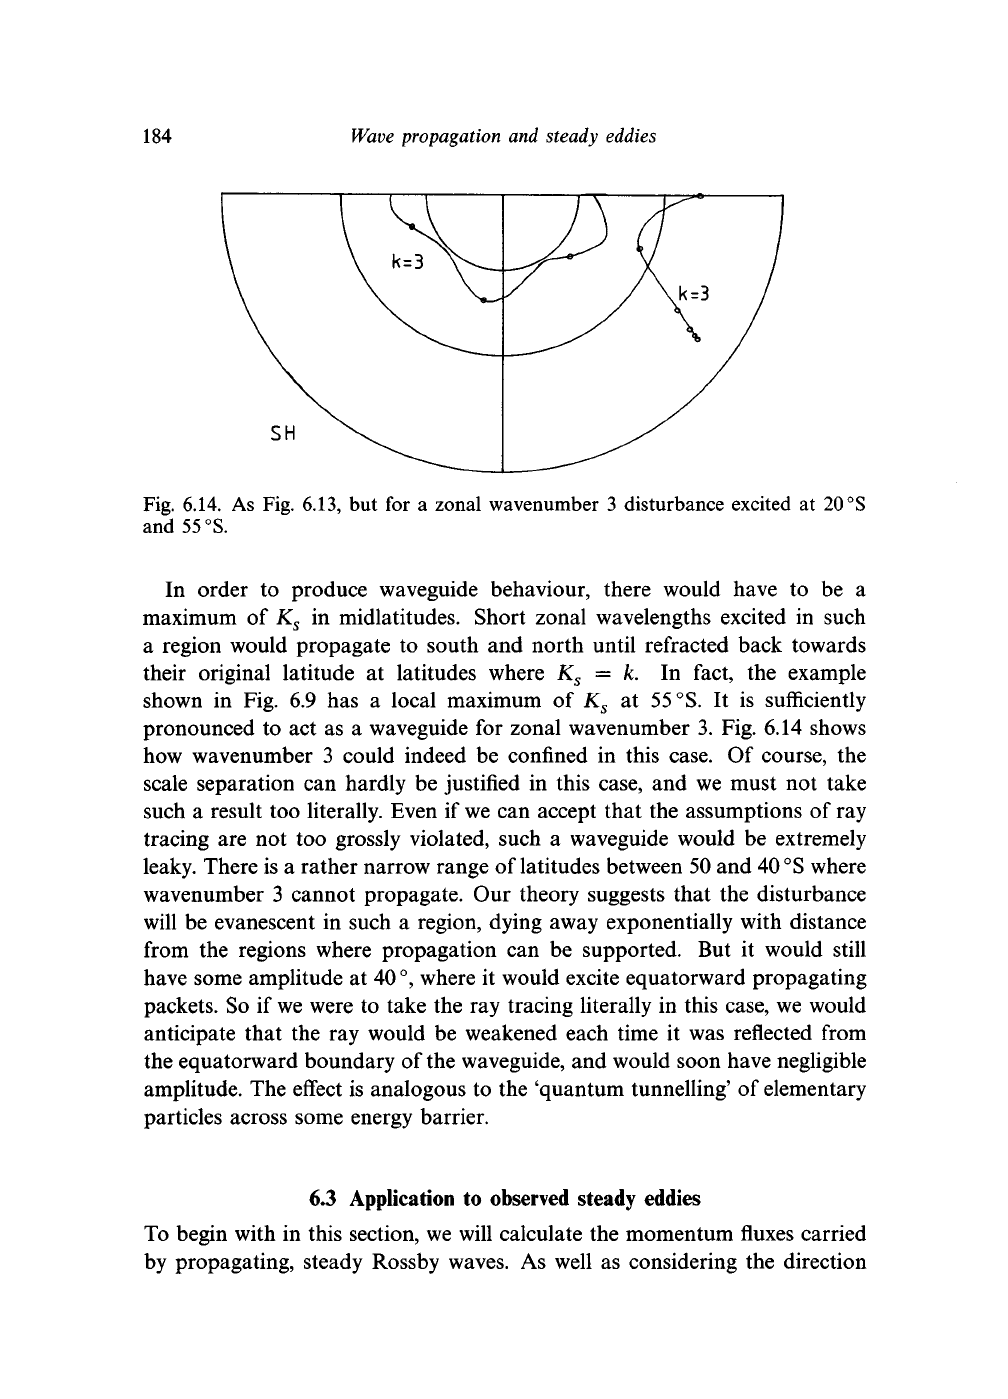
184
Wave propagation and steady eddies
SH
Fig. 6.14. As Fig. 6.13, but for a zonal wavenumber 3 disturbance excited at
20
°S
and55°S.
In order to produce waveguide behaviour, there would have to be a
maximum of K
s
in midlatitudes. Short zonal wavelengths excited in such
a region would propagate to south and north until refracted back towards
their original latitude at latitudes where K
s
= k. In fact, the example
shown in Fig. 6.9 has a local maximum of K
s
at
55
°S.
It is sufficiently
pronounced to act as a waveguide for zonal wavenumber 3. Fig. 6.14 shows
how wavenumber 3 could indeed be confined in this case. Of course, the
scale separation can hardly be justified in this case, and we must not take
such a result too literally. Even if we can accept that the assumptions of ray
tracing are not too grossly violated, such a waveguide would be extremely
leaky. There is a rather narrow range of latitudes between 50 and
40 °S
where
wavenumber 3 cannot propagate. Our theory suggests that the disturbance
will be evanescent in such a region, dying away exponentially with distance
from the regions where propagation can be supported. But it would still
have some amplitude at 40°, where it would excite equatorward propagating
packets. So if
we
were to take the ray tracing literally in this case, we would
anticipate that the ray would be weakened each time it was reflected from
the equatorward boundary of the waveguide, and would soon have negligible
amplitude. The effect is analogous to the 'quantum tunnelling' of elementary
particles across some energy barrier.
6.3 Application to observed steady eddies
To begin with in this section, we will calculate the momentum fluxes carried
by propagating, steady Rossby waves. As well as considering the direction
6.3
Application
to
observed steady eddies
185
of propagation, and the strength and nature of the forcing, we will need to
take into account the amplitude of the wave packet as it passes into regions
of differing K
s
.
In the last section, the waves were described by the perturbation stream-
function
:
w
*
= i{/e
i(/cx+
W, (6.27)
where \P is a (generally complex) amplitude. Such an expression is always
implicitly qualified by 'real part of, so it is more precise to write the
perturbation streamfunction as:
xp*
=
1 J¥e
i(fac+W
+ ^e~
i(/cx+w
}
,
(6.28)
where ¥ denotes the complex conjugate of *F. The two horizontal com-
ponents of the perturbation velocity field are therefore:
u
*
=
J^L
=
A
/-i/W^+W
+ i/*e-^
+
W)
,
(6.29a)
dy
2 I )
(6.29b)
v
= =
Then the poleward momentum flux is written:
(6.30)
The first pair of terms describes a wavelike variation, with zonal wavenumber
2k. This contribution will of course average to zero around a latitude circle.
The third term is a constant. We conclude that the zonal mean poleward
momentum flux is simply:
[IIV] =
~|V|
2
.
(6.31)
We will turn to the problem of estimating the variation of the wave amplitude
*F along the ray path shortly. For the present, we note that the poleward
momentum flux takes the opposite sign to /. Thus associated with a poleward
propagating packet will be an equatorward momentum flux, and vice versa.
The simplest example to consider is the case of uniform superrotation, with
K
s
given by Eq. (6.26). Rays are straight lines in our /?-plane approximation.
A poleward momentum flux is associated with those rays with negative /,
which propagate towards the equator. For those poleward propagating rays
with positive /, the momentum flux will be equatorward. The net result
is rather curious. There will be an eddy momentum flux which converges
186
Wave propagation and steady eddies
NH
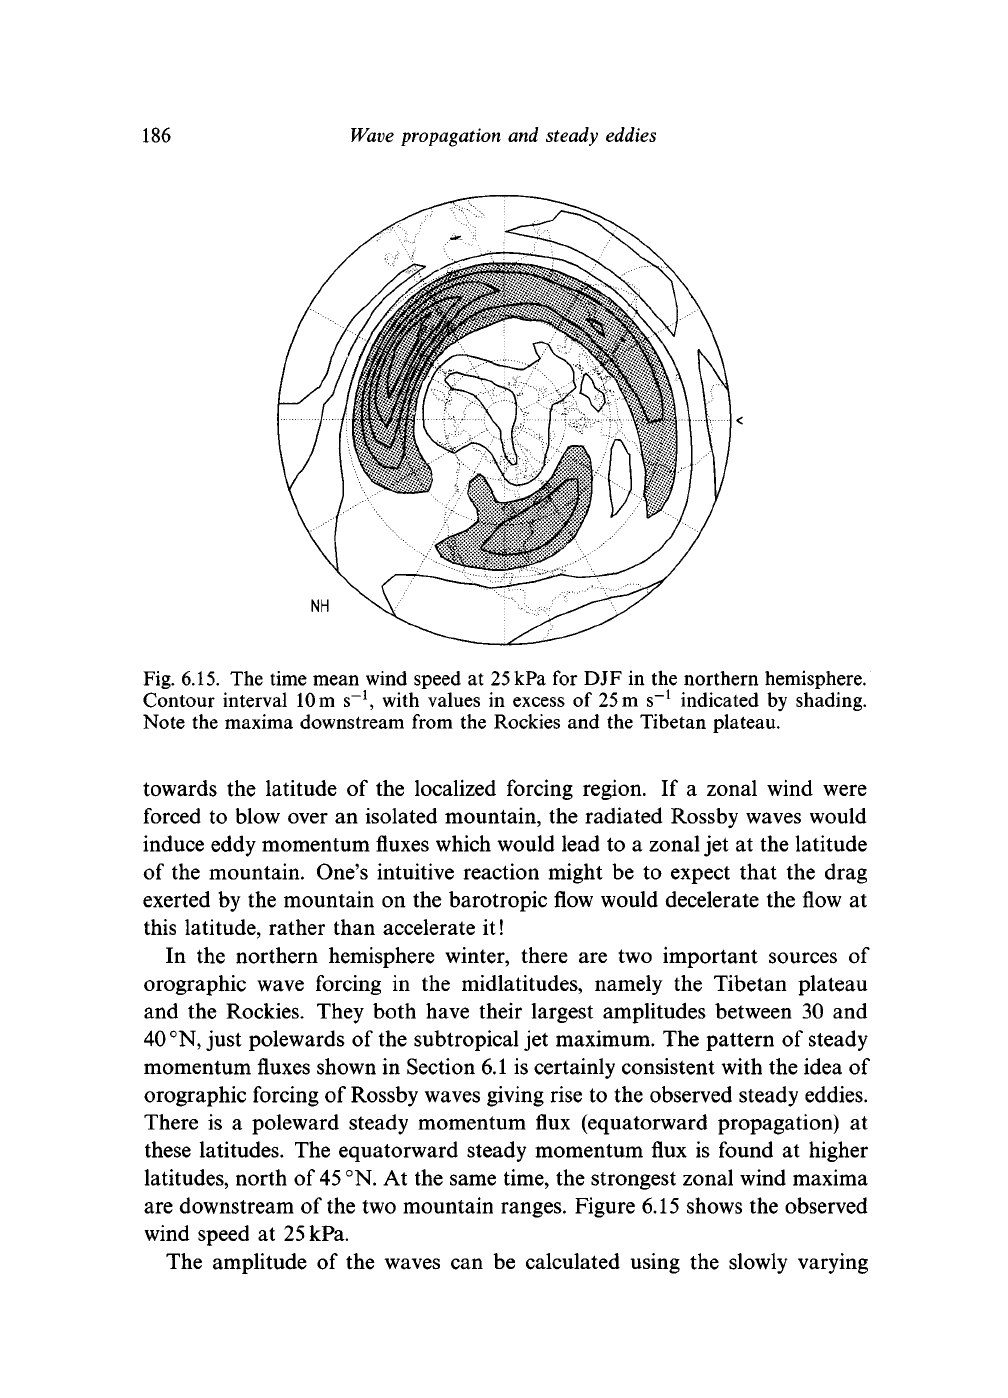
Fig. 6.15. The time mean wind speed at 25kPa for DJF in the northern hemisphere.
Contour interval
10 m
s"
1
, with values in excess of
25 m
s"
1
indicated by shading.
Note the maxima downstream from the Rockies and the Tibetan plateau.
towards the latitude of the localized forcing region. If a zonal wind were
forced to blow over an isolated mountain, the radiated Rossby waves would
induce eddy momentum fluxes which would lead to a zonal jet at the latitude
of the mountain. One's intuitive reaction might be to expect that the drag
exerted by the mountain on the barotropic flow would decelerate the flow at
this latitude, rather than accelerate it!
In the northern hemisphere winter, there are two important sources of
orographic wave forcing in the midlatitudes, namely the Tibetan plateau
and the Rockies. They both have their largest amplitudes between 30 and
40
°N,
just polewards of the subtropical jet maximum. The pattern of steady
momentum fluxes shown in Section 6.1 is certainly consistent with the idea of
orographic forcing of Rossby waves giving rise to the observed steady eddies.
There is a poleward steady momentum flux (equatorward propagation) at
these latitudes. The equatorward steady momentum flux is found at higher
latitudes, north of
45
°N.
At the same time, the strongest zonal wind maxima
are downstream of the two mountain ranges. Figure 6.15 shows the observed
wind speed at
25
kPa.
The amplitude of the waves can be calculated using the slowly varying
63 Application
to
observed steady eddies
187
approximation to obtain an equation describing the slow variation of *F
with y. An alternative approach is to use the concept of 'wave action'. The
quantity:
(co
- Uk)
is called the 'wave action density'. It can be shown that c
gy
A is conserved
following the ray, provided that the medium varies only in the meridional
direction and the slowly varying approximation is valid. From Eq. (6.27) it
is easily shown that
\[u
2
+
v*
2
]
=
^K
2
|¥|
2
.
(6.33)
2 2
For steady waves, the dispersion relation can be used to re-write the poleward
component of group velocity as:
<*-^. <«4)
Hence, for steady waves of zonal wavenumber fc, we have:
c
g
yA = —/I^FI
2
= constant. (6.35)
That is, along the ray, the amplitude varies as Z"
1
/
2
. The amplitude of an
equatorward propagating ray will become smaller as the packet approaches
the tropics where its group velocity is increasingly meridional. Conversely,
the amplitude on a ray propagating polewards is expected to increase as
the latitude where k = K
s
is approached. Of course, as pointed out in the
preceding section, the simple, slowly varying sinusoidal solutions break down
at this latitude, though a more sophisticated matched asymptotic analysis
can be carried out. One consequence of this result is that relatively weak
forcing at low latitudes could excite a meridionally propagating wavetrain
which would achieve substantial amplitude at higher latitudes. From this
idea has come a great deal of work relating anomalous weather patterns
in the midlatitudes to unusual forcing of waves in the subtropics. We will
return to these ideas in Section 7.2.
The results just derived must be treated with a degree of caution. Strictly,
they apply to a highly localized isotropic wavemaker. If an extensive moun-
tain were considered, interference between wavetrains emitted from different
parts of the orography could lead to the variation of amplitude with latitude
being very different from the Z"
1
/
2
behaviour discussed here.
It is clear that a number of highly restrictive approximations have been
made in deriving the ray tracing theories of the preceding two sections. The
188 Wave propagation and steady eddies
reader may well find the continual appeal to the slowly varying approxi-
mation unconvincing, especially when it appears that the most important
steady waves are of rather long zonal wavelength. Before returning to a
consideration of real data, it is worth comparing these results with those
from an intermediate model. Figure 6.16 shows a numerical calculation using
the linearized barotropic vorticity equation, Eq. (6.11). The zonal flow was
based upon the climatological zonal mean flow at 30kPa observed in the
northern hemisphere winter. A spectral representation of the fields was used,
and forcing was provided by a single isolated mountain at
30
°N.
No slowly
varying approximation has been made, and so the calculation is equally valid
for all wavenumbers. Two wavetrains, one propagating poleward and one
propagating equatorward from the mountain are clearly seen. The amplitude
of disturbances on the poleward propagating track in particular show an
increase towards higher latitudes. The agreement with the rather simple
arguments of the preceding section, despite the lack of formal scale sepa-
ration, suggests that ray tracing arguments can give at least a qualitative
account of the distribution of steady waves for a wide range of conditions.
A second calculation, shown in Fig. 6.17, is very similar. The same zonal
mean flow is used. But instead of passing over an isolated circular mountain,
it passes over the actual Earth orography, smoothed to match the resolution
of
the
numerical model. The vorticity field reveals the presence of
two
domin-
ant sets of wavetrains. The larger emanates from the Tibetan plateau, where
the equatorward train of waves is especially marked. The other originates
from the Rockies, where both poleward and equatorward trains of waves
can be seen. The vorticity field is relatively undisturbed over Europe and
western parts of
Asia.
The corresponding streamfunction, Fig. 6.17(b), shows
sharp troughs over the eastern coast of North America and over the east
Asian coast, with pronounced ridging in the eastern part of both the Pacific
and Atlantic Oceans. The pattern should be compared with the observed
geopotential height, Fig. 6.1. All these various features are present in the
observed fields. Indeed, Fig. 6.16 is as accurate a representation of the
observed steady eddy pattern as is produced by many sophisticated global
circulation models. Part of the reason for this is that a linear calculation does
not permit the eddy fluxes carried by the eddies to change the zonal flow, so
that by specifying the zonal mean wind, a large part of the climatology has
already been determined. However, the model clearly demonstrates that the
radiation of Rossby waves by mountains provides a useful conceptual model
of the observed steady eddy pattern.