Lyons W.C. (ed.). Standard handbook of petroleum and natural gas engineering.2001- Volume 1
Подождите немного. Документ загружается.

MWD
and
LWD
975
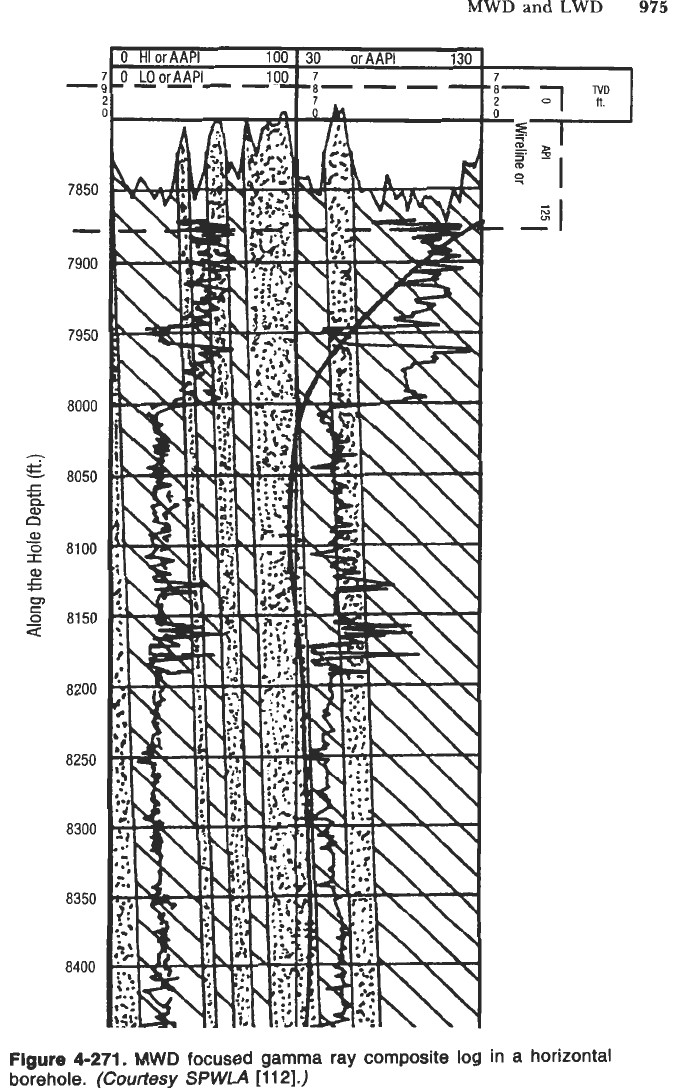
Flgure
4-271.
MWD
focused gamma ray composite log in a horizontal
borehole.
(Courtesy
SPWLA
[112].)
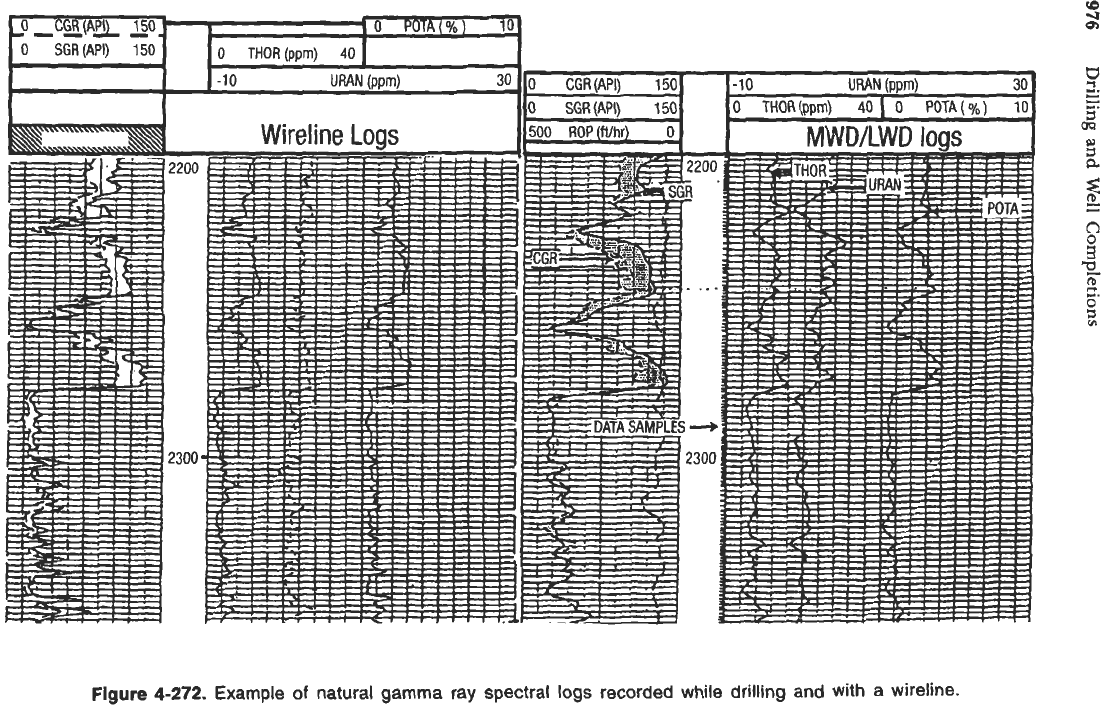
Figure
4-272.
Example
of
natural gamma ray
spectral
logs recorded while drilling and with
a
wireline.
MWD and LWD
977
3.
electromagnetic resistivity
4.
toroidal system resistivity
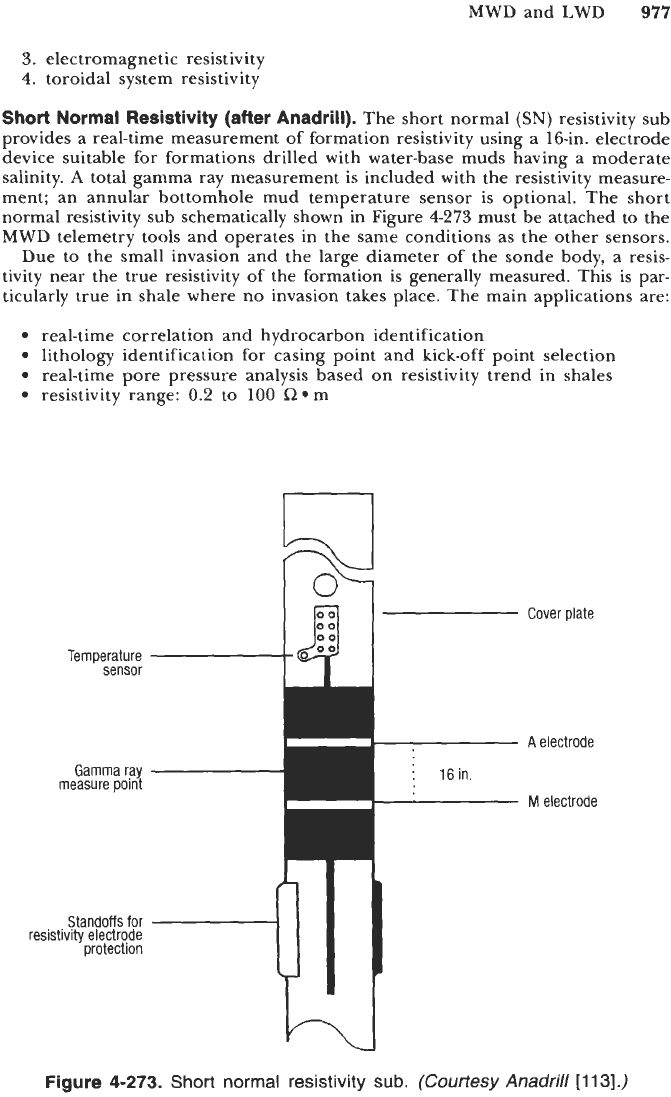
Short
Normal Resistivity (after Anadrill).
The short normal
(SN)
resistivity sub
provides a real-time measurement of formation resistivity using a 16-in. electrode
device suitable for formations drilled with water-base muds having a moderate
salinity.
A
total gamma ray measurement
is
included with the resistivity measure-
ment; an annular bottomhole mud temperature sensor is optional. The short
normal resistivity sub schematically shown in Figure
4-273
must be attached to the
MWD telemetry tools and operates in the same conditions as the other sensors.
Due to the small invasion and the large diameter of the sonde body, a resis-
tivity near the true resistivity of the formation is generally measured. This
is
par-
ticularly true in shale where
no
invasion takes place. The main applications are:
real-time correlation and hydrocarbon identification
lithology identification for casing point and kick-off point selection
real-time pore pressure analysis based on resistivity trend in shales
resistivity range:
0.2
to
100
R*m
Cover
plate
A
electrode
M
electrode
Figure
4-273.
Short
normal
resistivity
sub.
(Courtesy
Anadrill
[113].)
978
Drilling and Well Completions
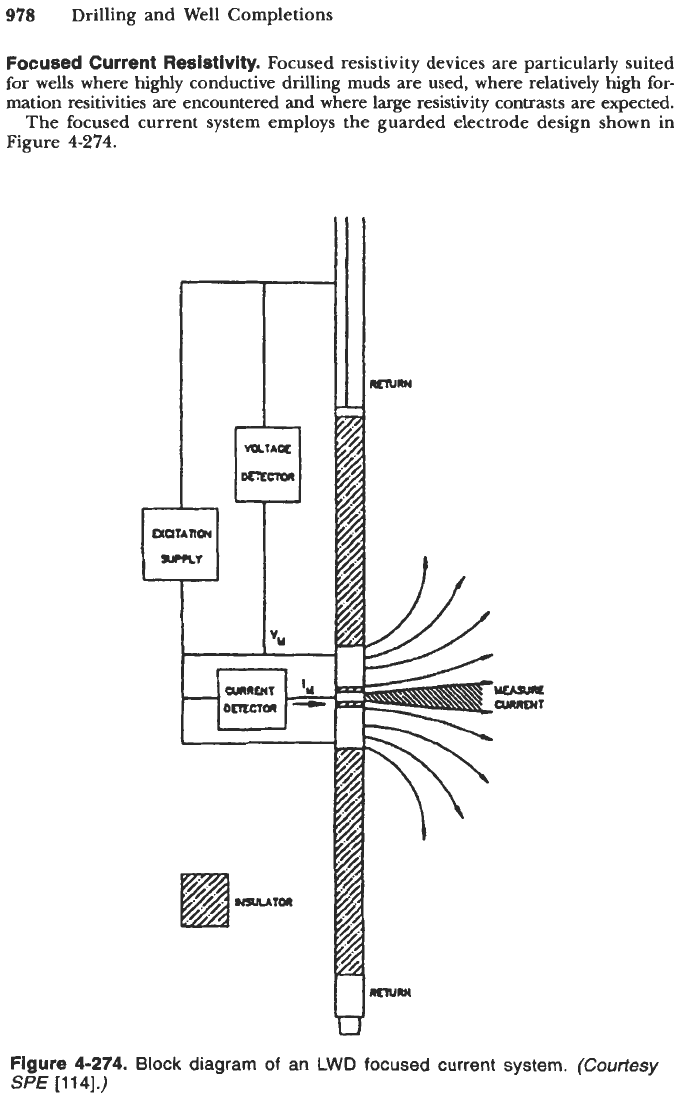
Focused Current Resistivity.
Focused resistivity devices are particularly suited
for
wells where highly conductive drilling muds are used, where relatively high
for-
mation resitivities
are
encountered
and
where large resistivity contrasts are expected.
The focused current system employs the guarded electrode design shown in
Figure
4-274.
W
u
Figure
4-274.
Block diagram
of
an
LWD
focused current
system.
(Courtesy
SPE
[114].)
MWD and LWD
979
The system is similar to the laterolog
3
used in wireline logging. A constant
1-k Hz
AC
voltage is maintained for all electrodes. The current flowing through
the center electrode
is
measured.
The resistivity range is 0.1 to 1000 C2.m. Beds as thin as 6 in. (15 cm) can
be adequately delineated.
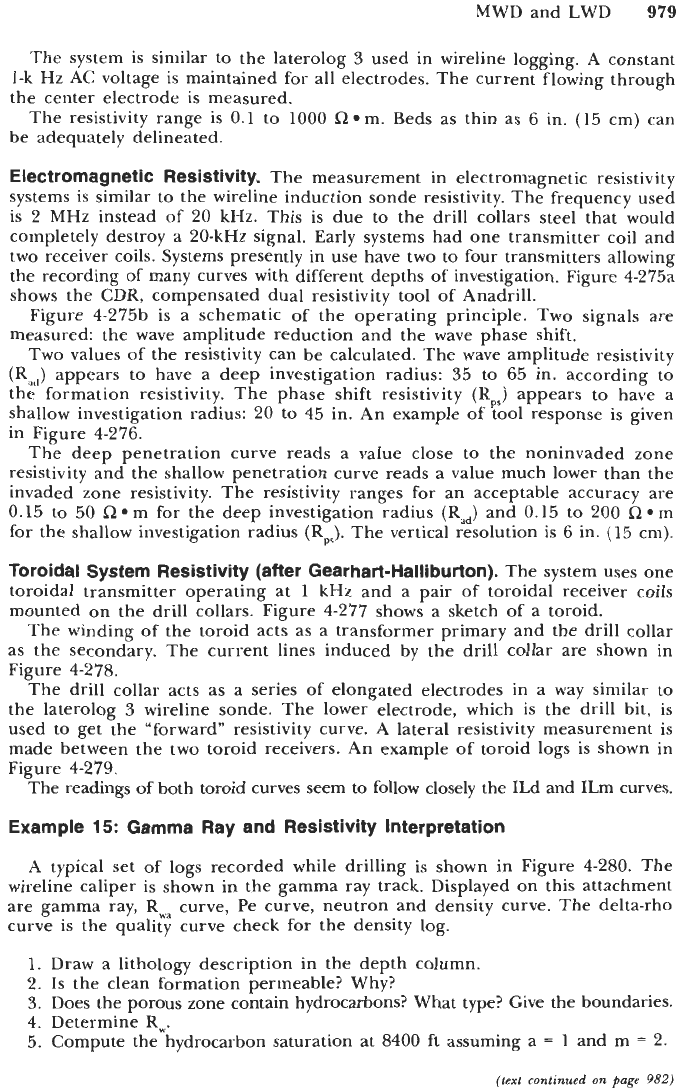
Electromagnetic Resistivity.
The measurement in electromagnetic resistivity
systems is similar to the wireline induction sonde resistivity. The frequency used
is 2 MHz instead of 20 kHz. This is due
to
the drill collars steel that would
completely destroy a 20-kHz signal. Early systems had one transmitter coil and
two receiver coils. Systems presently in use have two to four transmitters allowing
the recording of many curves with different depths of investigation. Figure 4-275a
shows the CDR, compensated dual resistivity tool
of
Anadrill.
Figure 4-275b is a schematic of the operating principle. Two signals are
measured: the wave amplitude reduction and the wave phase shift.
Two values
of
the resistivity can be calculated. The wave amplitude resistivity
(Rat,)
appears to have a deep investigation radius:
35
to
65 in. according to
the formation resistivity. The phase shift resistivity (Rp,) appears to have a
shallow investigation radius: 20 to 45 in. An example
of
tool response is given
in Figure 4-276.
The deep penetration curve reads a value close to the noninvaded zone
resistivity and the shallow penetration curve reads a value much lower than the
invaded zone resistivity. The resistivity ranges for an acceptable accuracy are
0.15 to 50
a*
m for the deep investigation radius (R,) and 0.15 to 200 R*m
for the shallow investigation radius (Rp,). The vertical resolution
is
6 in. (15 cm).
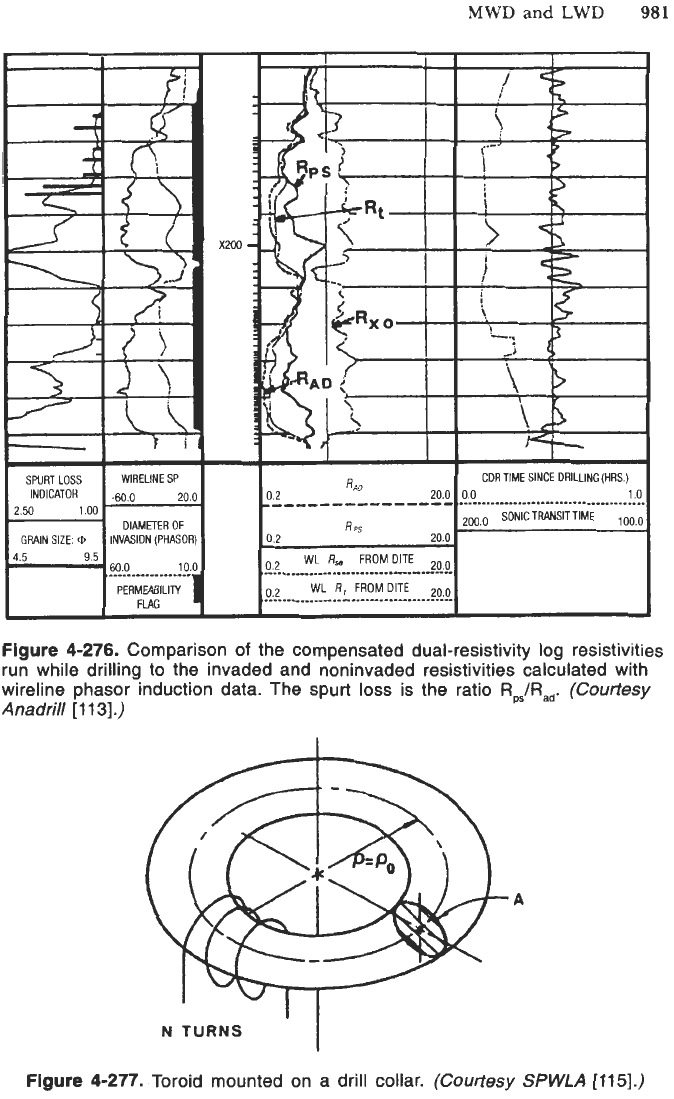
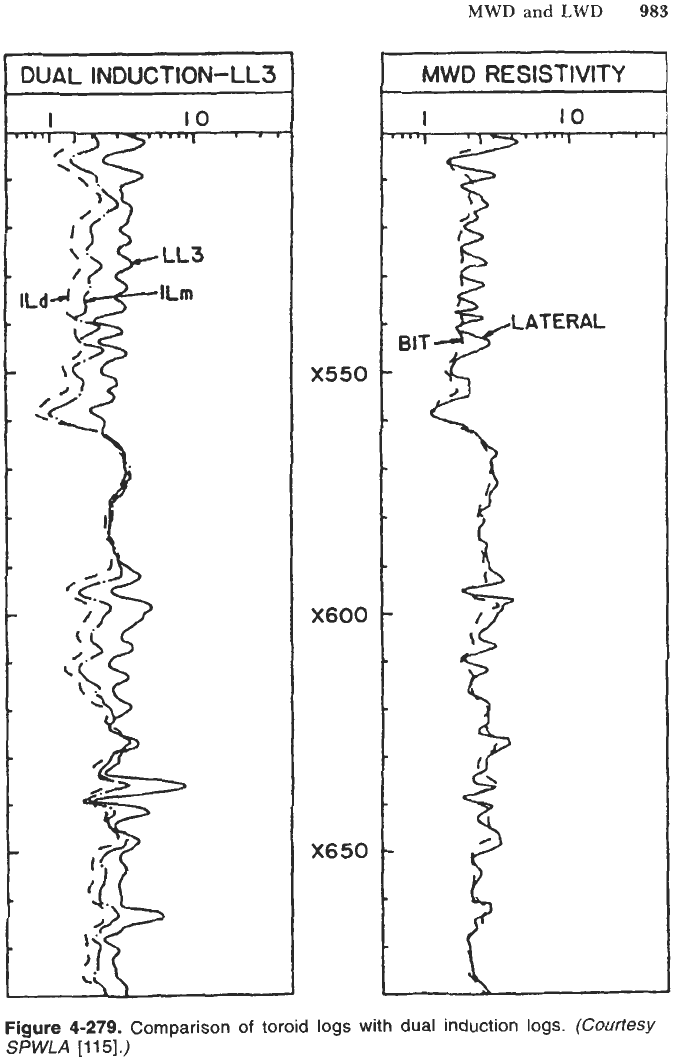
Toroidal System Resistivity (after Gearhart-Halliburton).
The system uses one
toroidal transmitter operating at
1
kHz and a pair of toroidal receiver coils
mounted on the drill collars. Figure 4-277 shows a sketch
of
a toroid.
The winding of the toroid acts as a transformer primary and the drill collar
as the secondary. The current lines induced by the drill collar are shown in
Figure 4-278.
The drill collar acts as a series of elongated electrodes in a way similar to
the laterolog
3
wireline sonde. The lower electrode, which is the drill bit, is
used to get the “forward” resistivity curve. A lateral resistivity measurement
is
made between the two toroid receivers. An example
of
toroid logs is shown in
Figure
4-279.
The readings of both toroid curves seem to follow closely the ILd and ILm curves.
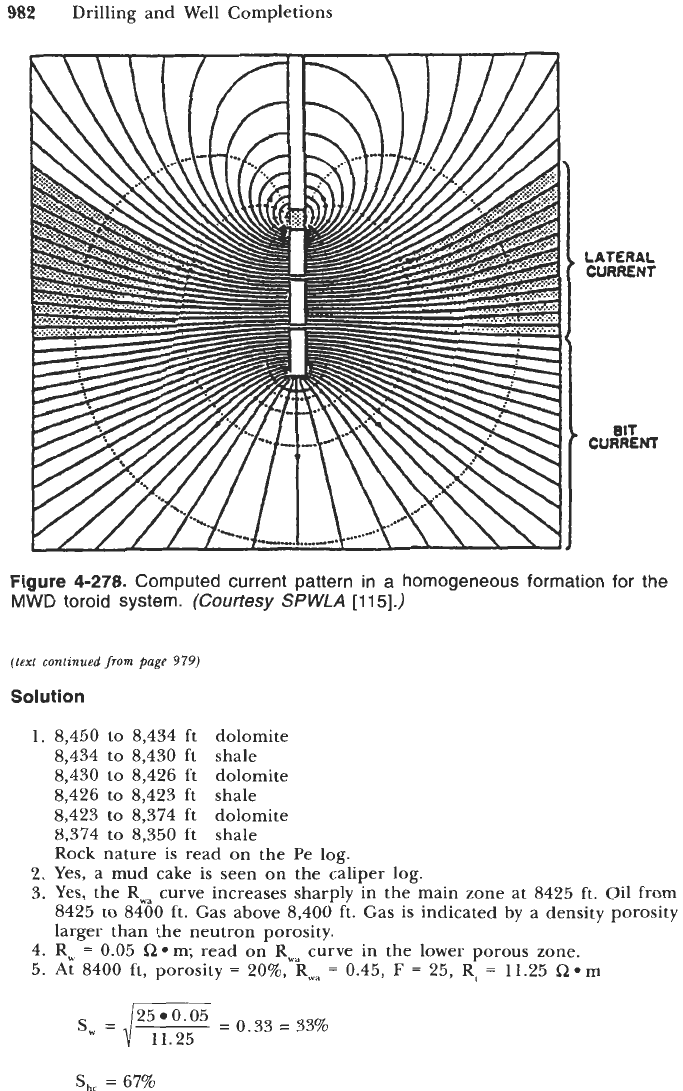
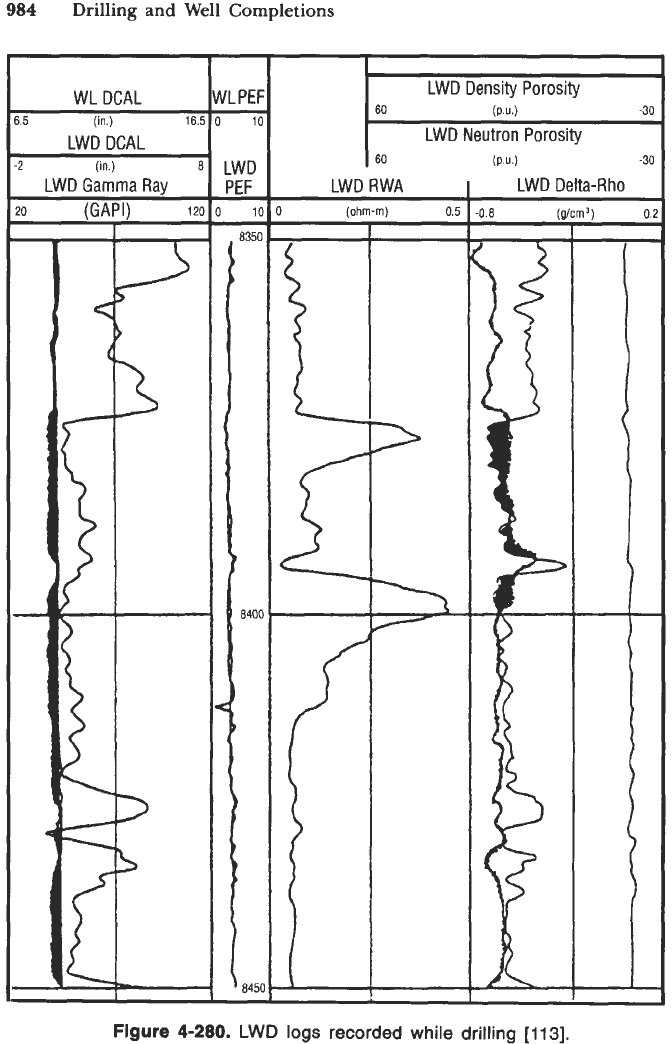
Example
15:
Gamma Ray and Resistivity Interpretation
A typical set of logs recorded while drilling is shown in Figure 4-280. The
wireline caliper is shown in the gamma ray track. Displayed on this attachment
are gamma ray,
RN,a
curve, Pe curve, neutron and density curve. The delta-rho
curve is the quality curve check for the density
log.
1.
Draw a lithology description in the depth column.
2.
Is
the clean formation permeable? Why?
3.
Does the porous zone contain hydrocarbons? What type? Give the boundaries.
4.
Determine
R,.
5.
Compute the hydrocarbon saturation at 8400 ft assuming a
=
1
and m
=
2.
(text
continued
on
page
982)
-
-
flow
channel
Battery
Gamma ray
Antenna recess
with
loop antenna
Electronics
Near receiver signal
Amplitude
1
Transmitters Receiver-
13
ml
Amplitude
2
lPhase
shift
Receiver-
Far receiver signal
Transmitter-
(a)
Figure
4-275.
Compensated dual-resistivity
tool;
(a) sub design; (b) operating principle.
(Courtesy
Anadrill
[
11
31.)
MWD
and
LWD
981
Figure
4-276.
Comparison
of
the compensated dual-resistivity
log
resistivities
run while drilling to the invaded and noninvaded resistivities calculated with
wireline phasor induction data. The spurt
loss
is the ratio
RpS/Rad.
(Courtesy
Anadrill
[113].)
A
I
N
TURNS
Figure
4-277.
Toroid mounted on a drill collar.
(Courtesy
SPWLA
[115].)
982
Drilling and Well Completions
LATERAL
CURRENT
BIT
CURRENT
Figure
4-278.
Computed current pattern in
a
homogeneous formation for the
MWD
toroid system.
(Courtesy
SPWLA
[115].)
(test
continued
from
page
979)
Solution
1.
8,450 to 8,434 ft dolomite
8,434 to 8,430 ft shale
8,430 to 8,426 ft dolomite
8,426 to 8,423 ft shale
8,423 to 8,374 ft dolomite
8,374 to 8,350 ft shale
Rock nature is read on the Pe
log.
2. Yes, a mud cake is seen on the caliper
log.
3.
Yes, the Rwa curve increases sharply in the main zone at 8425 ft. Oil from
8425 to 8400 ft. Gas above 8,400 ft. Gas is indicated by a density porosity
larger than the neutron porosity.
4. Rw
=
0.05
Rem;
read on
Rwa
curve in the lower porous zone.
5.
At 8400 ft, porosity
=
20%,
R,,
=
0.45,
F
=
25,
R,
=
11.25
Rem
S,
=
j2:i.:r
=
0.33
=
33%
S,,
=
67%
MWD
and
LWD
983
DUAL
INDUCTION-LL3
I
IO
X550
X600
X650
MWD
RESISTIVITY
Figure
4-279.
Comparison
of
toroid
logs
with dual induction
logs.
(Courtesy
SPWLA
[115].)
984
Drilling
and
Well
Completions
WL DCAL
LWD DCAL
?
(in.)
8
LWD Gamma Ray
0
(GAPI)
120
.5
(in.)
16.5
WLPEf
0
1(
LWD
PEF
0
1(
335c
840(
8451
~ ~~
LWD Density Porosity
LWD
Neutron
Porosity
60
(PU)
-30
60
LWD RWA
I
(ohm-m)
0.5
i
(P
u.1
-30
LWD Delta-Rho
0.8
iaicm31
0.:
Flgure
4-280.
LWD
logs
recorded
while
drilling
[113].