Martienssen W., Warlimont H. (Eds.). Handbook of Condensed Matter and Materials Data
Подождите немного. Документ загружается.


592 Part 4 Functional Materials
16
14
12
10
8
6
4
2
0
–2
–4
–6
–8
–10
–12
–14
–16
ΓΣ RLTMASHPKKMT' U
E (eV)
Wave vector k
2H-SiC
1
1
1
1
1
1
1
1
1,3
1,2
1
1
1
1
1
1
1
1
1
1
1
1
1
1
1
1
1
1
1
1
1
1
1
1
1
1
1
1
1
1
1
1
1
1
1
1
1
1
1
1
1
1
1
1
1
1
1
1
1
1
1
1
2
2
2
2
2
2
2
2
2
2
2
2
2
2
2
2
2
2
2
2
2
1
2
2
2
2
2
2
2
2
2
2
2
2
2
2
2
3
3
3
3
3
3
3
3
3
3
3
3
3
3
3
3
3
3
3
3
3
3
3
3
3
3
3
3
3
3
3
3
3
4
4
4
5
6
1,3
2,4
1,3
1,2
5,6
1,2
1,2
1,2
1,3
1,3
1,3
1,3
1,2
1,2
1,2
1,3
1,2
1,3
1,3
4
2,4
6
5
6
1,2
3
3
3
1,2
1,2
5,6
5,6
1,3
Fig. 4.1-30 Band structure of 2H silicon carbide
Table 4.1-13 Energy gaps of Group IV semiconductors and IV–IV compounds
Crystal Between Gap Energy Temperature Remarks
bands (eV) (K)
Diamond C Γ
25
v
and ∆
1c
E
g, indir
5.50 (5) RT Quantum photoyield
E
gx, indir
5.416 (2) 100 Indirect exciton gap with lower valence band
5.409 (2) Indirect exciton gap with upper valence band
Silicon Si Γ
25
v
and ∆
1c
E
g, ind
1.1700 0 Extrapolated, wavelength-modulated
transmission
1.1242 300 Wavelength-modulated transmission
E
g, th
1.205 0 Extrapolated from temperature dependence of
conductivity above 200 K
Γ
25
v
and Γ
2
c
E
g, dir
4.185 (10) 4.2 Electroreflection
4.135 190
Part 4 1.1

Semiconductors 1.1 Group IV Semiconductors and IV–IV Compounds 593
Table 4.1-13 Energy gaps of Group IV semiconductors and IV–IV compounds, cont.
Crystal Between Gap Energy Temperature Remarks
bands (eV) (K)
Germanium Ge Γ
8v
and L
6c
E
g, ind
0.744 (1) 1.5 Magnetotransmission
0.664 291 Optical absorption
E
g, th
0.785 0 Extrapolated from temperature dependence of
intrinsic conductivity
Γ
8v
and Γ
7c
E
g, dir
0.898 (1) 1.5 Magnetoabsorption
0.805 (1) 293
Silicon carbide 3C-SiC Γ
15v
and X
1c
E
g, ind
2.417 (1) 2 Wavelength-modulated absorption
2.2 300 Optical absorption
E
g, dir
6.0 300 Optical absorption
E
gx
2.390 2 Excitonic energy gap, wavelength-modulated
absorption
Silicon carbide 2H-SiC E
gx
3.330 4 Excitonic energy gap; optical absorption
Silicon carbide 6H-SiC E
g, ind
2.86 300 Optical absorption
E
gx
3.023 4
Table 4.1-14 Exciton energies of Group IV semiconductors and IV–IV compounds (E
b
= exciton binding energy)
Crystal Quantity State Exciton energy (eV) Temperature (K) Remarks
Diamond E
b
(1S) 0.19 (15) 1S core exciton
E
b
0.07 Indirect exciton binding energy
Silicon E(1S) 1.1552 (3) 1.8 Wavelength-modulated absorption
E
b
0.01412 4.2 Calculated binding energy
Germanium E(1S) 1S
3/2
3/2
(L
4
+L
5
) 0.74046 (3) 2.1, 5.1 Optical absorption at 2.1 K and
1S
3/2
1/2
(L
6
) 0.74158 (3) luminescence at 5.1K
E
b
1S
3/2
3/2
(L
4
+L
5
) 0.00418
1S
3/2
1/2
(L
6
) 0.00317
Silicon carbide (3C-SiC) E
b
0.027 2 Wavelength-modulated absorption
Table 4.1-15 Spin–orbit splitting energies of Group IV semiconductors and IV–IV compounds
Crystal Quantity Bands Splitting energy (eV) Temperature (K) Remarks
Diamond ∆(Γ
25
v
) 0.006 (1) Cyclotron resonance
Silicon ∆
0
(Γ
25
v
) 0.0441 (3) 1.8 Wavelength-modulated absorption
Germanium ∆
0
Γ
7v
to Γ
8v
0.297 10 Electroreflectance
Γ
6v
to Γ
8c
0.200
Silicon carbide (3C-SiC) ∆
0
0.010 2 Wavelength-modulated absorption
Table 4.1-16 Effective masses of electrons (in units of the electron mass m
0
) for Group IV semiconductors and IV–IV compounds
Crystal Quantity Value Temperature (K) Remarks
Diamond m
n, parall
1.4 Field dependence of electron drift velocity
m
n, perpend
0.36
Silicon m
n, parall
0.9163 (4) 1.26 Cyclotron resonance with uniaxial stress
m
n, perpend
0.1905 (1)
Part 4 1.1

594 Part 4 Functional Materials
Table 4.1-16 Effective masses of electrons for Group IV semiconductors and IV–IV compounds, cont.
Crystal Quantity Value Temperature (K) Remarks
Germanium m
n, perpend
(L
6
) 0.0807 (8) 30–100 Cyclotron resonance magnetophonon resonance
0.0823 120
m
n, parall
(L
6
) 1.57 (3) 30–100 Cyclotron resonance magnetophonon resonance
1.59 120
m
n
(Γ
7
) 0.0380(5) 30 Piezomagnetoreflectance
Gray tin m
n, light
(Γ
8
) 0.0236 (2) 1.3 Density-of-states mass
m
n, heavy
(L
6
) 0.21 4.2
Silicon carbide (3C-SiC) m
n, parall
0.677 (15) 45 Cyclotron resonance
m
n, perpend
0.247 (11)
Silicon carbide (6H-SiC) m
n, parall
3–6 Cyclotron resonance
m
n, perpend
0.48 (2)
Table 4.1-17 Effective masses of holes (in units of the electron mass m
0
) for Group IV semiconductors and IV–IV compounds
Crystal Quantity Value Temperature (K) Field direction Remarks
Diamond m
p, heavy
1.08 Calculated from valence band
m
p, light
0.36 parameters
m
spin–orbit split
0.15
m
p, dens stat
0.75 300 Hall effect
Silicon m
p, heavy
0.537 4.2 Cyclotron resonance
m
p, light
0.153
m
spin–orbit split
0.234
m
p, dens stat
0.591 Density-of-states mass
Germanium m
p, light
0.0438 (3) 4 B parallel to [100] Cyclotron resonance
0.0426 (2) B parallel to [111]
0.0430 (3) B parallel to [110]
m
p, heavy
0.284 (1) B parallel to [100]
0.376 (1) B parallel to [111]
0.352 (4) B parallel to [110]
m
spin–orbit split
0.095 (7) 30 Piezomagnetoabsorption
Gray tin m
p
(Γ
8
) 0.195 Interband magnetoreflection
m
p
(Γ
7
) 0.058
Silicon carbide (3C-SiC) m
p
0.45 45 High-field cyclotron resonance
Silicon carbide (6H-SiC) m
p, parall
1.85 (3) Cyclotron resonance
m
p, perpend
0.66 (2)
Table 4.1-18 g-factor g
c
of conduction electrons for Group IV semiconductors
Crystal g
c
Temperature (K) Remarks
Diamond 2.0030 (3) 140–300 Electron spin resonance
Silicon 1.99893(28) Electron spin resonance
Germanium −3.0(2) 30 Piezomagnetoabsorption
Part 4 1.1

Semiconductors 1.1 Group IV Semiconductors and IV–IV Compounds 595
C. Transport Properties
Tables 4.1-19 – 4.1-21.
Electronic Transport, General Description.
Diamond (C). Owing to the large band gap, most
diamonds are insulators at room temperature, and
Table 4.1-19 Intrinsic carrier concentration n
i
and electrical conductivity σ
i
of Group IV semiconductors and IV–IV
compounds
Crystal n
i
(cm
−3
) σ
i
(
−1
cm
−1
) T (K) Temperature dependence
Silicon 1.02× 10
10
3.16× 10
−2
300 Fig. 4.1-31
a
Germanium 2.33 × 10
13
2.1×10
−2
300 Figs. 4.1-32 and 4.1-33
3C-SiC Fig. 4.1-34
Si–Ge alloys Composition dependence of intrinsic conductivity: Fig. 4.1-36
Composition dependence of the mobilities: Figs. 4.1-35 and 4.1-37
a
The intrinsic conductivity of Si up to 1273 K is given by the phenomenological expression log
10
σ
i
= 4.247−2.924×10
3
T
−1
(σ
i
in Ω
−1
cm
−1
, T in K).
10
3
10
2
10
1
10
–1
10
–2
10
–3
T
–1
(10
–3
K
–1
)
10
4
10
3
10
2
10
1
10
–1
10
–2
R
H
(cm
3
C
–1
)
σ (Ω
–1
cm
–1
)
T (K)
1200 800 600 500 400 300
0 1.0 2.0 3.01.5 2.5 3.50.5
R
H
Si
σ
Fig. 4.1-31 Si. Conductivity and Hall coefficient vs. re-
ciprocal temperature in the range of intrinsic conduction;
n- and p-type samples with doping concentrations of
1.7×10
14
cm
−3
and above [1.23]. The different symbols
show results from different samples
so electronic transport is extrinsically determined
and therefore strongly dependent on the impurity
content. Natural (type IIb) and synthetic semicon-
ducting diamonds are always p-type. The electron
mobility can be derived only from photoconductivity
experiments.
10
3
10
2
10
1
10
–1
10
–2
10
–3
T
–1
(10
–3
K
–1
)
σ
i
(Ω
–1
cm
–1
)
T (K)
1000 800 600 500 400 300350 273 250
0.8 1.6 2.4 3.22.0 2.8 3.61.2 4.0
Ge
p-type
n-type
Computed
Fig. 4.1-32 Ge. Conductivity vs. reciprocal temperature in
the range of intrinsic conduction [1.24]
Part 4 1.1

596 Part 4 Functional Materials
10
19
10
18
10
17
10
16
10
15
10
14
10
13
10
12
T
–1
(10
–3
K
–1
)
n
i
(cm
–3
)
T (K)
0.8 1.6 2.4 3.22.0 2.8 3.61.2 4.0
1000 800 600 500 400 300350 273 250
Ge
p-type
n-type
computed
Fig. 4.1-33 Ge. Intrinsic carrier concentration vs. recipro-
cal temperature [1.24]
x
10
–1
10
–2
10
–3
10
–4
10
–5
10
–6
σ
–1
(Ω
–1
cm
–1
)
0 0.2 0.4 0.6 0.8 1.0
Si
x
Ge
1–x
4×10
14
10
17
10
16
10
15
6
4
2
8
6
4
2
8
1000 500 200 100 70
0 2.5 5.0 7.5 10.0 12.5 15.0
6
8
T (K)Carrier concentration (cm
–3
)
T
–1
(10
–3
K
–1
)
3C- SiC
Si/C: 0.33
0.37
0.40
Fig. 4.1-34 3C-SiC. Temperature dependence of carrier
concentration for n-type films grown by CVD on Si(100)
substrates [1.25]. Solid lines, calculated values. Si/C =
ratio of source gases
3000
2000
1000
0
µ
H,n
(cm
2
/V s)
x
0 0.2 0.4 0.6 0.8 1.0
Si
x
Ge
1–x
Fig. 4.1-35 Si
x
Ge
1−x
. Composition dependence of the
electron Hall mobility at room temperature [1.26]
Fig. 4.1-36 Si
x
Ge
1−x
. Composition dependence of the in-
trinsic conductivity at room temperature [1.26]
Part 4 1.1

Semiconductors 1.1 Group IV Semiconductors and IV–IV Compounds 597
Table 4.1-20 Electron mobilities µ
n
and hole mobilities µ
p
of Group IV semiconductors and IV–IV compounds
Crystal µ
n
(cm
2
/Vs) µ
p
(cm
2
/Vs) T (K) Remarks
Diamond 2000 2100 293 See Figs. 4.1-38 and 4.1-39 for temperature dependence
Silicon 1450 370 300 See Figs. 4.1-40 and 4.1-41 for temperature dependence
2×10
5
20
Germanium 3800 1800 300 See Figs. 4.1-33 and 4.1-42 for temperature dependence
Gray tin µ
n
(Γ
8
)0.12 × 10
6
10× 10
3
100 From Hall and magnetoresistance data, via conductivity
µ
n
(L
6
)1.6×10
3
and Hall coefficient
Silicon carbide (3C-SiC) 510 15–21 296 Epitaxial film grown on Si(100)
0 0.2 0.4 0.6 0.8 1.0
2000
1000
0
µ
H,p
(cm
2
/V s)
x
Si
x
Ge
1–x
Fig. 4.1-37 Si
x
Ge
1−x
. Composition dependence of the
hole Hall mobility at room temperature [1.26]
10
4
10
3
10
2
µ
n
(cm
2
/V s)
60
10
2
6
4
2
8
6
4
8
8246
10
3
40
2×10
4
6
8
T (K)
8
2
Diamond
10
4
10
3
10
2
µ
n
(cm
2
/V s)
60
10
2
6
4
2
8
8246
10
3
6
4
2
8
2
4×10
4
T (K)
Diamond
Fig. 4.1-38 Diamond. Electron mobility vs. temperature.
Open circles, drift mobility data from [1.27]; filled tri-
angles and filled circles, Hall mobility data from [1.28]
and [1.29, 30], respectively. Continuous curve, theoretical
drift mobility [1.27]
Fig. 4.1-39 Diamond. Hole mobility vs. temperature.Open
circles, drift mobility data from [1.31]; filled circles
and filled triangles, Hall mobility data from [1.29, 30]
and [1.32], respectively. Solid and dashed curves: calcu-
lated drift and Hall mobilities, respectively [1.33]
Part 4 1.1

598 Part 4 Functional Materials
10
6
10
5
10
4
10
3
10
2
410
10
2
10
3
µ
n
(cm
2
/V s)
T
–2.42
T (K)
4 × 10
13
1.3 × 10
17
n
d
10
12
cm
–3
Si
Fig. 4.1-40 Si. Electron mobility vs. temperature [1.34].
Data points for n
d
≤ 10
12
cm
−3
obtained by time-of-
flight technique [1.35]. Other experimental values taken
from [1.36] (4 × 10
13
cm
−3
) and [1.23] (1.3×10
17
cm
−3
).
Continuous line, theoretical lattice mobility, after [1.35].
Dash–dotted line, T
−2.42
dependence of µ
n
around room
temperature
Silicon (Si). The electronic transport is due exclusively
to electrons in the [100] conduction band minima and
holes in the two uppermost (heavy and light) valence
bands. In samples with impurity concentrations be-
low 10
12
cm
−3
, the mobilities are determined by pure
lattice scattering down to temperatures of about 10 K
(n-type) or 50 K (p-type), for electrons and holes, respec-
tively. Higher impurity concentrations lead to deviations
from the lattice mobility at corresponding higher tem-
peratures. For electrons, the lattice mobility below
50 K is dominated by deformation-potential coupling
10
6
10
5
10
4
10
3
10
2
µ
H,p
(cm
2
/V s)
6
4
2
8
2
10
468
10
2
4×10
2
6
4
2
8
6
4
2
8
6
4
2
8
T (K)
Light-hole band
Total
Heavy-
hole band
Spin-orbit
band
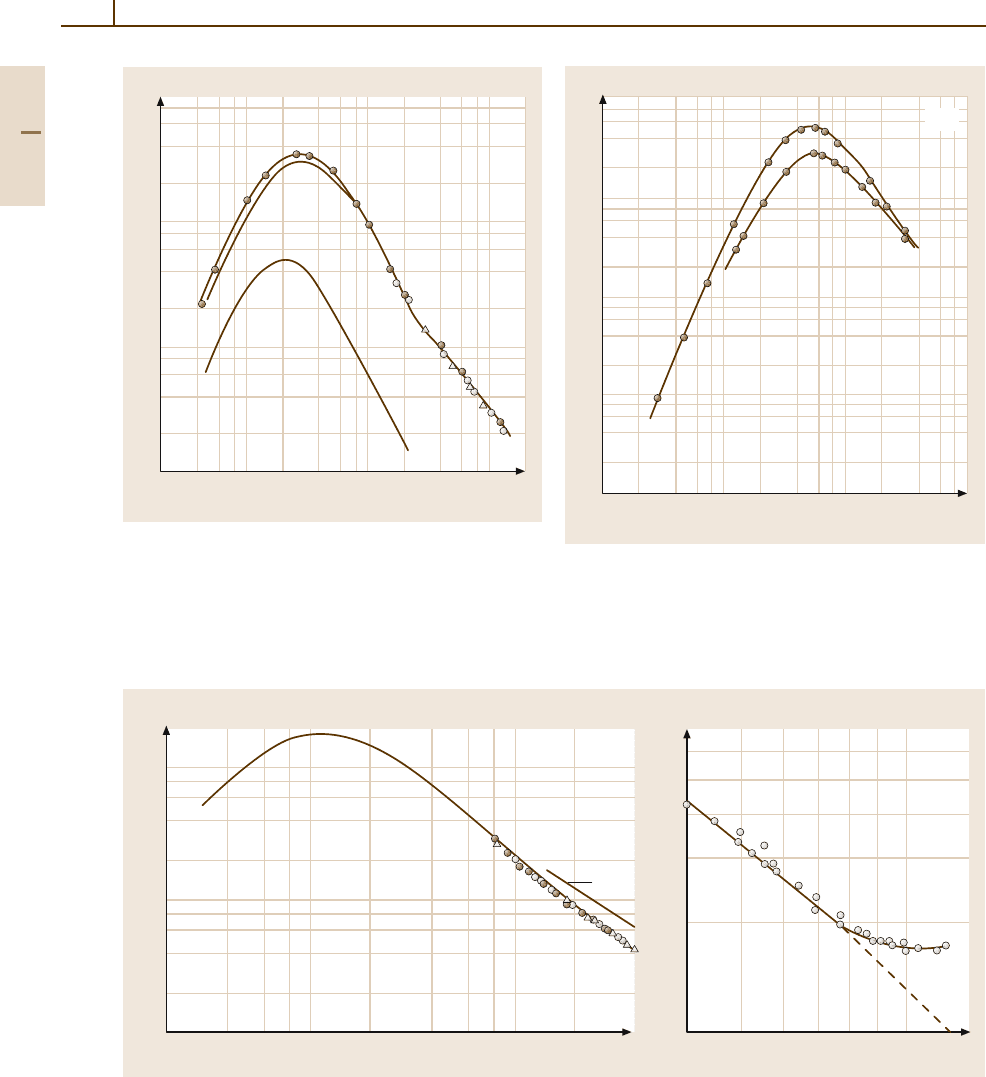
Fig. 4.1-41 Si. (b) Hall hole mobility vs. temperature; cir-
cles from [1.37], solid lines calculated contributions from
the three valence bands
to accoustic phonons. At higher temperatures, interval-
ley scattering between the six equivalent minima of
the conduction band is added to the intravalley pro-
cess, modifying the familiar T
−1.5
dependence of the
acoustic-mode-dominated mobility to T
−2.42
.Attem-
peratures below 100 K, the lattice mobility of holes is
dominated by acoustic scattering, but does not follow
a T
−1.5
law, owing to the nonparabolicity of the va-
lence bands. The proportionality of µ
p
to T
−2.2
around
room temperature is a consequence of optical-phonon
scattering.
Germanium (Ge). Low-field electronic transport is pro-
vided by electrons in the L
6
minima of the conduction
band and holes near the Γ
8
point in the valence bands. At
room temperature, the mobility of samples with impurity
concentrations below 10
15
cm
−3
is limited essentially
by lattice scattering; higher donor or acceptor concen-
Part 4 1.1

Semiconductors 1.1 Group IV Semiconductors and IV–IV Compounds 599
µ (10
3
cm
2
/V s)
100
90
80
70
60
50
40
30
20
15
10
9
8
7
6
5
4
3
2
30 40 50 60 80 100 150 200 300
T (K)
Ge
µ
n
Slope = –1.66
µ
p
Slope = –2.33
Fig. 4.1-42 Ge. Electron and hole mobilities vs. tem-
perature for a constant carrier concentration (high-purity
samples) [1.38]
trations result in an increasing influence of impurity
scattering. At 77 K, even for doping concentrations be-
low 10
13
cm
−3
, the mobilities depend on the impurity
Table 4.1-21 Thermal conductivity κ of Group IV semiconductors and IV–IV compounds
Crystal κ(W/cmK) Temperature (K) Remarks
Diamond C 6–10 293 See Fig. 4.1-43 for temperature dependence
Silicon Si 1.56 300 See Fig. 4.1-44 for temperature dependence
Germanium Ge See Fig. 4.1-46 for temperature dependence
Silicon carbide 3C-SiC
6H-SiC 4.9 300 Perpendicular to c axis; See Fig. 4.1-45 for temperature
dependence
10
4
10
3
10
2
10
1
10
2
10
3
101
κ
T (K)
(W/cm K)
Diamond
Fig. 4.1-43 Diamond. Thermal conductivity vs. tempera-
ture for three type Ia diamonds [1.39]
concentration. Low temperatures and high concentra-
tions lead to the replacement of free-carrier conduction
by impurity conduction.
Gray Tin (α-Sn). In intrinsic samples, light electrons and
holes in the Γ
8
bands determine the transport properties.
When the Fermi level crosses the energy of the L
6
min-
ima, heavy electrons have an influence. This leads,
for example, to a screening enhancement of the light-
electron mobility and, in heavily doped n-type samples,
to a dominant role of the L electrons. Consequently,
Part 4 1.1
600 Part 4 Functional Materials
10
2
10
2
1
10
–1
6
4
8
2
6
4
8
2
6
4
8
2
2
468
10
2468 2468
10
2
10
3
κ
Si
(W/cm K)
κ
2
T
κ
L
T (K)
Fig. 4.1-44 Si. Lattice thermal conductivity vs. tempera-
ture, according to [1.40] (filled circles), [1.41] (open
circles), and [1.42] (triangles). The curves marked κ
L
and
2κ
T
represent the contributions of the longitudinal and
transverse phonons, respectively [1.43]
2
468
10
2468 2
10
2
10
1
10
–1
6
4
2
8
20
4×10
2
400 500 600 800 1000 1200
0.7
0.6
0.5
0.4
0.3
0.2
0.1
6
4
2
8
T (K)
T
–1
κ
(W/cm K)
T (K)
κ
(W/cm K)
a) b)
Ge
Fig. 4.1-46a,b Ge. Thermal conductivity vs. temperature. (a) 3–400 K, (b) 400–1200 K. Solid curve in (a) and data
in
(b) from [1.40]; experimental data in (a) from [1.45]. Dashed line in (b), extrapolated lattice component
1
468
10
2468 24
10
2
10
2
10
1
10
–1
10
–2
6
4
8
2
10
3
268
6
4
8
2
6
4
8
2
6
4
8
2
6
4
8
2
T (K)
κ
(W/cm K)
SiC
Fig. 4.1-45 6H-SiC. Thermal conductivity (⊥c axis) vs.
temperature for two different samples [1.44]
Part 4 1.1

Semiconductors 1.1 Group IV Semiconductors and IV–IV Compounds 601
heavily doped n-type samples behave as indirect-gap
semiconductors with an E
g
of about 0.09 eV.
Silicon–Germanium Alloys (Si
x
Ge
1−x
). The transport
properties have been investigated mostly on single crys-
tals. The mobility is influenced by alloy scattering,
which makes a contribution µ
alloy
∝ T
0.8
x
−1
(1−x)
−1
.
Near the band crossover (x = 0.15), intervalley scatter-
ing has to be taken into account.
D. Electromagnetic and Optical Properties
Tables 4.1-22 – 4.1-25.
Table 4.1-22 High-frequency dielectric constant ε (real part of the complex dielectric constant) of Group IV semicon-
ductors and IV–IV compounds
Crystal ε T (K) Frequency Method
Diamond C 5.70 (5) 300 1–10 kHz Capacitance bridge
Silicon Si 12.1 4.2 750 MHz Capacitance bridge
11.97 300
Germanium Ge 16.5 4.2 750 MHz Capacitance bridge
16.0 4.2 9200 MHz Microwave measurement
16.2 300
15.8 77 1MHz Capacitance bridge
Gray tin α-Sn 24 300 Infrared Infrared reflectance measurement
Silicon carbide 3C-SiC 9.52 300 Low frequency Infrared transmission
6.38 High frequency
Silicon carbide 6H-SiC 9.66 300 Low frequency ε
perp
10.03 ε
parall
6.52 300 High frequency ε
perp
6.70 ε
parall
Optical Constants. The real part (ε
1
) and imaginary part
(ε
2
) of the dielectric constant at optical frequencies were
measured by spectroscopic ellipsometry. The refractive
index n, the extinction coefficient k, the absorption co-
efficient K, and the reflectivity R have been calculated
from ε
1
and ε
2
. The frequency dependences of ε
1
, ε
2
, n,
and K are shown in Figs. 4.1-48 and 4.1-47.
Diamond. The refractive index n is equal to 3.5at
λ = 177.0 nm. The spectral dependence of the refractive
index n can be approximated by the empirical formula
n
2
−1 =aλ
2
/
λ
2
−λ
2
1
+bλ
2
/
λ
2
−λ
2
2
,
with the parameters a = 0.3306, b = 4.3356, λ
1
=
175.0nm,andλ
2
= 106.0nm.
Silicon. (See Table 4.1-23).
Germanium. (See Fig. 4.1-48).
Gray Tin (α-Sn). The index of refraction n, extinction
coefficient k, and absorption coefficient K versus pho-
ton energy are shown in Fig. 4.1-47.
Silicon Carbide (SiC).
Part 4 1.1