Muga G. Time in Quantum Mechanics - Vol. 2
Подождите немного. Документ загружается.


326 G.G. Paulus and D. Bauer
rather fulfills an inhomogeneous Schr
¨
odinger equation with a source term (see, e.g.,
[11]). This source term may, in principle, be removed by an extension of the quan-
tum system being described, i.e., by incorporating the bound state dynamics prior
to the “birth” of the wave packet in the case of strong-field ionization.
Let us start with an electronic eigenstate of the field-free Hamiltonian. The elec-
tron may at time t
i
be in the ground state |Ψ
0
(t
i
) with energy E
0
< 0, for instance,
and the laser field is not yet switched on. Now let us consider the matrix element
M
p
(t
f
, t
i
) =Ψ
p
(t
f
)|
ˆ
U(t
f
, t
i
)|Ψ
0
(t
i
) , (11.37)
which governs the probability w
i→f
=|M
p
(t
f
, t
i
)|
2
to find the electron at time t
f
in
the scattering state |Ψ
p
(t
f
) where p is the asymptotic momentum far away from the
atom (where the measurement is performed). We assume that at time t
f
the laser
field is off again.
ˆ
U(t, t
) =
ˆ
U
†
(t
, t) is the time-evolution operator associated with
the time-dependent Schr
¨
odinger equation
i
∂
∂t
|Ψ (t)=
ˆ
H(t)|Ψ (t) ,
ˆ
H(t) =
1
2
[
ˆ
p + A(t)
]
2
+
ˆ
V (r) , (11.38)
where A(t) is the vector potential describing the laser field in dipole approximation
and
ˆ
V (r) is the binding potential. The minimum coupling Hamiltonian
ˆ
H(t) can be
split in various ways:
i
∂
∂t
|Ψ (t)=[
ˆ
H
0
+
ˆ
W(t)]|Ψ (t)=[
ˆ
H
V
(t) +
ˆ
V (r)]|Ψ (t) , (11.39)
with
ˆ
H
0
=
ˆ
p
2
2
+
ˆ
V (r) ,
ˆ
H
V
(t) =
ˆ
p
2
2
+
ˆ
W(t) , (11.40)
and
ˆ
W(t) the interaction with the laser field,
ˆ
W(t) =
ˆ
p · A(t) +
1
2
A
2
(t) (velocity gauge) . (11.41)
The gauge transformation of the potentials (both scalar potential φ and vector
potential A) and the wave function |Ψ (t),
A
= A +∇χ(r, t) ,φ
= φ −
∂χ(r, t)
∂t
, |Ψ
(t)=e
−iχ(r,t)
|Ψ (t) ,
where χ(r, t) is an arbitrary differentiable scalar function, leaves the electric and the
magnetic field unchanged:
E =−∂
t
A − ∇φ = E
, B = ∇ × A = B
. (11.42)

11 Double-Slit Experiments in the Time Domain 327
This gauge invariance offers the possibility to choose a gauge that suits us best, e.g.,
with respect to computational simplicity. However, this statement only holds true
as long as all approximations we make do not destroy the gauge invariance (see
Sect. 11.4.6). Transformation to the so-called length gauge is achieved by choosing
χ(r, t) =−A(t) ·r . (11.43)
Because of ∇χ =−A the vector potential is “transformed away” while φ
=
−∂
t
χ =−E · r. The Hamiltonian in length gauge reads
ˆ
H
(t) =
ˆ
p
2
2
+
ˆ
V (r) −φ
(r, t) =
ˆ
p
2
2
+
ˆ
V (r) +E(t) ·
ˆ
r (11.44)
(one could also absorb
ˆ
V (r)inφ and φ
). Note that the transformation of the wave
function
|Ψ
(t)=e
i
ˆ
r·A(t)
|Ψ (t) (11.45)
can be interpreted as a translation in momentum space. In fact, while in velocity
gauge the quiver momentum is effectively subtracted from the kinetic momentum,
leading to a canonical momentum different from the kinetic momentum, in length
gauge kinetic and canonical momenta are equal.
From (11.44) we infer
ˆ
W
(t) = E(t) ·
ˆ
r (length gauge), (11.46)
with E(t) =−∂
t
A(t).
11.4.1 Volkov Wave Functions
The Volkov–Hamiltonian
ˆ
H
V
(t) governs the free motion of the electron in the laser
field. It fulfills in velocity gauge
i
∂
∂t
|Ψ
V
p
(t)=
ˆ
H
V
(t)|Ψ
V
p
(t)=
1
2
[
ˆ
p + A(t)]
2
|Ψ
V
p
(t) . (11.47)
Thanks to the dipole approximation the Volkov–Hamiltonian is diagonal in momen-
tum space. The solution of (11.47) is thus readily written down:
|Ψ
V
p
(t, t
i
)=e
−iS
p
(t,t
i
)
|p, S
p
(t, t
i
) =
1
2
t
t
i
dt
[p + A(t
)]
2
, (11.48)
where |p are momentum eigenstates, r|p=e
ip·r
/(2π)
3/2
. Note that the lower
integration limit t
i
affects the overall phase of the Volkov solution only. As
328 G.G. Paulus and D. Bauer
mentioned above, the transition to the length gauge corresponds to a translation
in momentum space. It is thus easy to check that in length gauge one has
|Ψ
V
p
(t, t
i
)=e
−iS
p
(t,t
i
)
|p + A(t) (length gauge), (11.49)
with the same action S
p
(t, t
i
) as in (11.48). In passing we note that in the original
paper by Wolkow [66] the solution to the Dirac equation (i.e., relativistic and thus
without dipole approximation) was presented.
11.4.2 Strong-Field Approximation (SFA)
The time-evolution operator
ˆ
U(t, t
) satisfies the time-dependent Schr
¨
odinger equa-
tion (11.39),
i∂
t
ˆ
U(t, t
) = [
ˆ
H
0
+
ˆ
W(t)]
ˆ
U(t, t
) . (11.50)
Its formal solution is given by the integral equations
ˆ
U(t, t
) =
ˆ
U
0
(t, t
) − i
t
t
dt
ˆ
U(t, t
)
ˆ
W(t
)
ˆ
U
0
(t
, t
)
=
ˆ
U
0
(t, t
) − i
t
t
dt
ˆ
U
0
(t, t
)
ˆ
W(t
)
ˆ
U(t
, t
) , (11.51)
where
ˆ
U
0
(t, t
) is the evolution operator corresponding to the time-dependent
Schr
¨
odinger equation with
ˆ
H
0
only. Inserting (11.51) into the matrix element (11.37)
leads to
M
p
(t
f
, t
i
) =−i
t
f
t
i
dt
Ψ
p
(t
f
)|
ˆ
U(t
f
, t
)
ˆ
W(t
)|Ψ
0
(t
) , (11.52)
where use of Ψ
p
(t
f
)|
ˆ
U
0
(t
f
, t
i
)|Ψ
0
(t
i
)=Ψ
p
(t
f
)|Ψ
0
(t
f
)=0 was made because
|Ψ
p
(t
f
) is a scattering state orthogonal to |Ψ
0
(t
f
) and
ˆ
U
0
(t
, t
i
)|Ψ
0
(t
i
)=|Ψ
0
(t
).
Since the propagator
ˆ
U(t, t
) also satisfies the integral equations
ˆ
U(t, t
) =
ˆ
U
V
(t, t
) − i
t
t
dt
ˆ
U
V
(t, t
)
ˆ
V
ˆ
U(t
, t
)
=
ˆ
U
V
(t, t
) − i
t
t
dt
ˆ
U(t, t
)
ˆ
V
ˆ
U
V
(t
, t
) , (11.53)
where
ˆ
U
V
(t, t
) is the evolution operator corresponding to the time-dependent
Schr
¨
odinger equation (11.47), one obtains, upon inserting (11.53) in (11.52) [42],

11 Double-Slit Experiments in the Time Domain 329
M
p
(t
f
, t
i
) =−i
t
f
t
i
dt
Ψ
p
(t
f
)|
ˆ
U
V
(t
f
, t
)
ˆ
W(t
)|Ψ
0
(t
)
−i
t
f
t
i
dt
t
f
t
dt
Ψ
p
(t
f
)|
ˆ
U
V
(t
f
, t
)
ˆ
V
ˆ
U(t
, t
)
ˆ
W(t
)|Ψ
0
(t
)
.
(11.54)
Using
%
t
f
t
i
dt
%
t
f
t
dt
=
%
t
f
t
i
dt
%
t
f
t
i
dt
Θ(t
− t
) =
%
t
f
t
i
dt
%
t
t
i
dt
expression (11.54)
may be recast in the form [42]
M
p
(t
f
, t
i
) =−i
t
f
t
i
dt
Ψ
p
(t
f
)|
ˆ
U
V
(t
f
, t
)
ˆ
W(t
)|Ψ
0
(t
)
−i
t
t
i
dt
ˆ
V
ˆ
U(t
, t
)
ˆ
W(t
)|Ψ
0
(t
)
. (11.55)
Equation (11.55) is still exact and gauge invariant. Whatever is missed in the first
term of (11.55) is included in the second term where the full but unknown time-
evolution operator
ˆ
U(t
, t
) appears. Neglecting the second term, replacing the final
state |Ψ
p
(t
f
) withaplanewave|p, and making use of the expansion of the Volkov
propagator into Volkov waves
ˆ
U
V
(t, t
) =
d
3
k |Ψ
V
k
(t, t
i
)Ψ
V
k
(t
, t
i
)| (11.56)
(t
i
is arbitrary since it cancels), we obtain, up to an irrelevant overall phase
exp[−iS
p
(t
f
, t
i
)], the SFA or so-called Keldysh amplitude [36, 37, 22, 60]
M
K
p
(t
f
, t
i
) =−i
t
f
t
i
dt Ψ
V
p
(t
f
, t)|
ˆ
W(t)|Ψ
0
(t) . (11.57)
The SFA transition amplitude integrates over all ionization times t where the tran-
sition from the bound state |Ψ
0
(t) to the Volkov state |Ψ V
p
(t
f
, t), mediated by the
interaction with the laser field
ˆ
W(t), may take place.
6
Expression (11.57) thus may
be thought of replacing in a self-consistent manner Eq. (11.25) in the simple ad hoc
model of a continuous slit.
In length gauge the matrix element (11.57) reads
M
K
p
(t
f
, 0) =−i
T
p
0
dt
e
−iS
p
(t
f
,t
)
p + A(t
)|r · E(t
)|Ψ
0
e
−iE
0
t
. (11.58)
Here we assumed that the electric field E(t) is nonvanishing only for t ∈ [t
i
= 0, T
p
].
Multiplication by the constant phase factor exp[iS
p
(t
f
, 0)] finally gives
6
The second term in the matrix element (11.55) may be taken into account in a similar, approxi-
mate way, allowing for the description of rescattering processes [48].

330 G.G. Paulus and D. Bauer
M
K
p
=−i
T
p
0
dt
p + A(t
)|r · E(t
)|Ψ
0
e
iS
p,E
0
(t
)
, (11.59)
where
S
p,E
0
(t) =
t
0
dt
1
2
[p + A(t
)]
2
−E
0
. (11.60)
In the case of a hydrogen-like ion starting from the ground state the matrix element
needed in (11.59) reads
k|r · E(t)|Ψ
0
=−i2
7/2
(2|E
0
|)
5/4
k · E(t)
π(k
2
+2|E
0
|)
3
. (11.61)
In experiments one usually measures the differential ionization probability w
p
,
which is the probability to find an electron of final energy E
p
= p
2
/2 emitted in
a certain direction, i.e., into the solid angle element dΩ
p
that is covered by the
measuring device. The probability w
p
is related to the transition matrix element M
p
through
w
p
dE
p
=>?@
p dp
dΩ
p
=|M
p
|
2
d
3
p =|M
p
|
2
p
2
dp dΩ
p
, (11.62)
so that
w
p
= p |M
p
|
2
. (11.63)
Hence, in order to calculate the SFA differential ionization probability w
K
p
=
p |M
K
p
|
2
for a given final momentum p and hydrogen-like ions only the time
integral in (11.59) remains to be evaluated. With nowadays computers, the brute
force numerical evaluation of such an integral is so fast that an entire photoelectron
momentum or angle-resolved energy spectrum can be obtained in a couple of sec-
onds. However, more insight is gained if we employ the saddle-point approximation
to evaluate the time integral in (11.59), as will be shown in the following.
11.4.3 Interfering Quantum Trajectories
The saddle-point times contributing most to the time integral in (11.59) are deter-
mined by the stationary phase equation ∂
t
S
p,E
0
(t)|
t=t
s
= 0, which leads to
1
2
[p + A(t
s
)]
2
= E
0
. (11.64)
Because E
0
< 0 the saddle-point times t
s
are necessarily complex. For the case
of a hydrogen-like ion the matrix element (11.59) can be rewritten in terms of the
saddle-point solutions as [48]

11 Double-Slit Experiments in the Time Domain 331
M
K
p
−2
−1/2
(2|E
0
|)
5/4
s
exp[iS
ps
]
S
ps
, (11.65)
where
S
ps
= S
p,E
0
(t
s
) (11.66)
and
S
ps
=
d
2
S
p,E
0
(t)
dt
2
t=t
s
=−E(t
s
) · [p +A(t
s
)] . (11.67)
In the following we shall restrict ourselves to linearly polarized laser pulses
where A(t) = A(t)e
z
. The photoelectron momentum spectra then have azimuthal
symmetry about the z-axis, and with p
= p · e
z
and p
⊥
= p − p
e
z
, Eq. (11.64)
can be rewritten as
A(t
s
) =−p
±i
2|E
0
|+p
2
⊥
. (11.68)
For an infinite pulse A(t) is periodic and infinitely many saddle-point times t
s
for a
given final momentum p contribute in the sum (11.65), giving rise to discrete peaks
in the photoelectron energy spectra, separated by ω. For a finite pulse only a finite
number of solutions exist, and only those with the smallest imaginary part of S
ps
are important. If there are two or more solutions of similar maximum weight, i.e.,
similar ImS
ps
, we expect an interference pattern in the photoelectron momentum or
energy spectra. If, on the other hand, only one saddle-point solution is dominating
the sum in (11.65), no interference pattern is expected.
The action (11.66) is complex but otherwise classical. One may therefore inter-
pret the matrix element (11.65) as a sum over complex classical trajectories [48] or
so-called quantum trajectories. Each saddle-point solution corresponds to a quan-
tum trajectory which starts at the complex time t
s
(ionization) and which arrives
with the desired asymptotic momentum at a detector. The initial conditions can be
chosen such that Re r(t
s
) = 0, and all entities become real once the electron leaves
from the tunnel exit r(Re t
s
) into the classically allowed region. We do not need
to calculate these trajectories explicitly for our purposes. However, we would like
to mention that they were successfully used as a starting point for incorporating
Coulomb corrections into plain SFA (see Sect. 11.4.6).
The connection of (11.65) with the time slits discussed in Sect. 11.2 is now estab-
lished. In Sect. 11.2 we put the time slits “by hand” upon assuming that at certain
time instances wave packets appear in the continuum. Each of these Gaussian wave
packets contained all momenta. Instead, in expression (11.65) each saddle-point
solution corresponds to a time slit for a given final momentum. The corresponding
quantum trajectory connects the time slit with the detector. Several quantum tra-
jectories for a given final momentum may interfere. This gives rise to interference

332 G.G. Paulus and D. Bauer
patterns in the momentum spectra |M
K
p
|
2
or differential energy spectra (11.63).
7
While in (11.26) we put some weighting function g(t) “by hand,” it is automatically
taken care of in (11.65) via the imaginary part of S
ps
: If the ionization probability
at time Re t
s
is too low, the imaginary part of S
ps
is large, thus suppressing the
contribution of this saddle point to the transition matrix element.
11.4.4 Analysis of Few-Cycle Ionization Dynamics: Attosecond
Time Slits
Let us illustrate the saddle-point approach to the SFA for a particular example.
We assume a laser pulse of the form (11.28) with ω = 0.056, n
cyc
= 4, and
ˆ
E =−ω
ˆ
A = 0.1. We will first discuss the case ϕ
cep
= 0 and concentrate on
photoelectron spectra along the laser polarization direction, i.e., p
⊥
= 0.
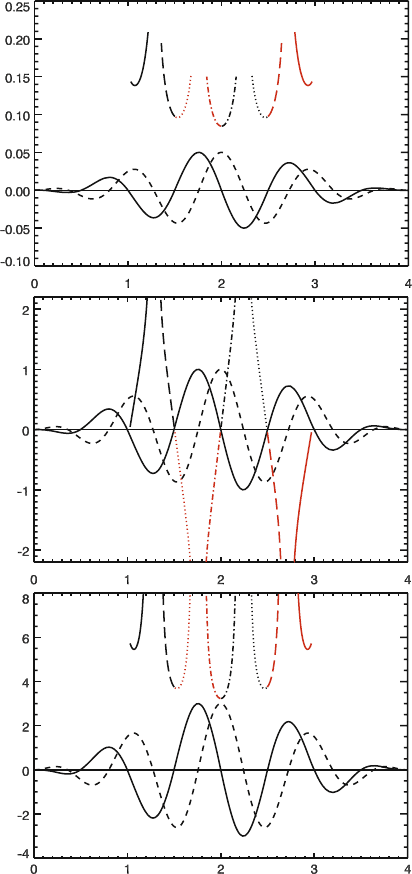
Figure 11.13 helps to analyze the dominating saddle-point solutions of (11.68)
for p
⊥
= 0 and p
∈ [−2.2, 2.2]. Panel (a) shows the saddle points t
s
in the
complex time plane. The vector potential A(t) (solid) and the electric field E(t)
(dashed) are indicated in order to show that Im t
s
is smallest whenever |E(t)| has a
local maximum, i.e., ionization is probable. The signs + and − refer to the signs in
(11.68), the colors to positive (black) or negative (gray; red online) final momentum
p
, as is clearly seen in panel (b) where the final momentum p
is plotted vs the
ionization time Re t
s
: The negative of the value of the vector potential at the time of
ionization determines the final momentum at the detector. High final momenta are
achieved if ionization occurs at low |E(t)|, i.e., high |A(t)|. However, the ionization
probability is expected to be low for small |E(t)|, as is confirmed in panel (c) where
Im S
ps
is plotted, which determines the weight of the saddle-point solution in the
sum in (11.65). Hence, the dashed-dotted saddle-point solutions are the dominating
ones, followed by the dotted, dashed, and solid ones. We identify three dominant
time slits, centered around the three largest local maxima in |E(t)|. The central slit
(“slit 1”) is the most dominant one since it is connected to the absolute maximum of
the electric field, which coincides with the maximum of the pulse envelope for the
carrier-envelope phase chosen. Slits 2a and 2b have already a lower weight since
Im S
ps
is larger. For our choice of the pulse (even number of cycles and carrier-
envelope phase ϕ
cep
= 0), the saddle-point solutions for ±|p
| are symmetric in
the sense that Im S
ps
is independent of the sign of p
. As a consequence, the SFA
predicts a perfect “left/right symmetry” of the photoelectron momentum spectrum
so that it is sufficient to analyze the differential photoelectron energy spectrum in,
say, polarization direction e
z
, i.e., p
> 0.
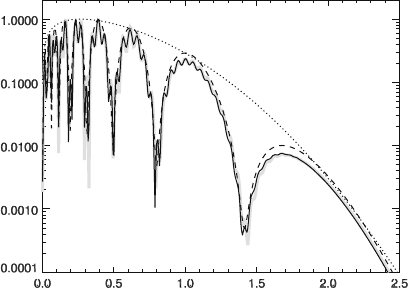
Figure 11.14 shows the result of such an analysis where the number of time slits
in the evaluation of the matrix element (11.65) is increased stepwise. Including only
7
In order to obtain an analytical formula for the spectra one may try to rewrite the discrete sum
(11.65) as an integral, i.e., to introduce a continuous slit [27].
11 Double-Slit Experiments in the Time Domain 333
p
||
(a.u.)Im S
ps
(a.u.)
Re t
s
(laser cycles)
Im t
s
(laser cycles)
(a)
−
(b)
+
+
−
−
++
−
(c)
−
−
slit 1
slit 2b
slit 2a
Fig. 11.13 (Color online) Saddle-point analysis for an n
cyc
= 4-cycle linearly polarized sin
2
-pulse
(11.28) with ω = 0.056 and
ˆ
E =−ω
ˆ
A = 0.1. In each of the panels, the vector potential A(t)
(solid) and the electric field E(t)(dashed) are indicated (arbitrarily normalized) and the same color
and line styles are used. (a) Saddle times t
s
in the complex time plane; the signs + and − refer to
the signs in (11.68), the colors to positive (black)ornegative(gray; red online) final momentum
p
; only saddle points within plus/minus one cycle around the pulse maximum are shown. (b)Final
momentum p
vs the ionization time Re t
s
.(c) Imaginary part of the saddle-point action Im S
ps
vs
the ionization time Re t
s
334 G.G. Paulus and D. Bauer
p
||
/ 2 (a.u.)
2
Yield (arb. units)
Fig. 11.14 Photoelectron spectra (11.63) in laser polarization direction for the pulse analyzed in
Fig. 11.13. The exact SFA spectrum from the numerical integration of (11.59) (gray and bold)is
compared with the saddle-point results (11.65), taking into account only the dominating quantum
trajectory (dotted), the two most dominating ones (dashed), and the three most dominating ones
(solid). All spectra are shifted vertically such that their maximum is at 1
the dominating saddle-point solutions drawn dash-dotted in Fig. 11.13 gives the
dotted spectrum, i.e., just the overall slope without any interference pattern. Includ-
ing the next branch of saddle-point solutions (drawn dotted in Fig. 11.13) gives the
dashed spectrum, which reproduces correctly the pronounced interference pattern of
the full, numerical SFA result (plotted gray and bold). These saddle-point solutions
constitute the second half of slit 2a and the first half of slit 2b. Finally, incorporating
also the second halves of slits 2a and 2b (dashed saddle-point solutions in Fig. 11.13)
gives the spectrum drawn solid, which reproduces the small-scale modulations in
the full, numerical SFA spectrum. The spectrum does not change anymore if more
saddle-point solutions are taken into account (the next most important ones would
be the solutions drawn solid in Fig. 11.13 for which, however, Im S
ps
is already too
large to have a sizable effect on the spectrum).
11.4.5 Carrier-Envelope Phase Dependence
Figure 11.13 shows that for the above-chosen pulse, the value ϕ
cep
= 0 cor-
responds to the case of perfect left/right symmetry: Each time slit has equally
weighted parts leading to left (p
< 0) and right (p
> 0) going electrons. Such
a pulse is frequently called a “cosine pulse” since the electric field behaves like a
cosine with respect to the maximum of the pulse envelope. It is obvious that the
situation changes with changing ϕ
cep
. The most asymmetric case is expected for
ϕ
cep
=±π/2, i.e., a “sine pulse.” In fact, as is seen from Fig. 11.15 there are two
groups of two equally weighted slits (“slit 1a,” “slit 1b” and “slit 2a,” “slit 2b,”
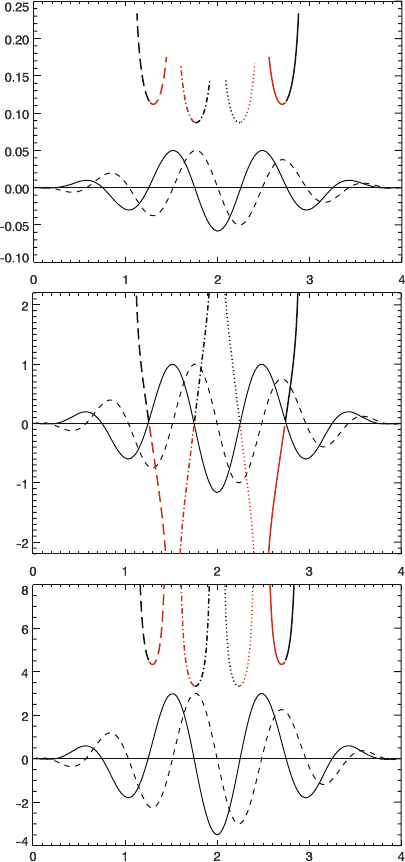
11 Double-Slit Experiments in the Time Domain 335
(a)
(b)
(c)
+
−
+
−
+
−
+
−
slit 1a
slit 2a
slit 2b
slit 1b
p
||
(a.u.)
Im S
ps
(a.u.)
Re t
s
(laser cycles)
Im t
s
(laser cycles)
Fig. 11.15 (Color online) Same as Fig. 11.13 but for a “sine-like” pulse (ϕ
cep
= π/2). Now there
are two most dominant time slits (indicated “slit 1a” and “slit 1b” in panel (c)) and two next most
important ones (“slit 2a” and “slit 2b”). However, the situation is now asymmetric with respect to
the sign of the final momentum, as is seen from panel (b)