Odekon M. Encyclopedia of paleoclimatology and ancient environments
Подождите немного. Документ загружается.

moraines and ice-flow features (e.g., drumlins), and it is more
abundantly constrained by radiocarbon dates. From its 30 ka
BP
position, Laurentide ice expanded to its late Wisconsinan maxi-
mum position in the northwest, south, and northeast about
23–24 ka
BP and in the southwest and far north about 20–21 ka BP
(Dyke et al., 2002). Hence, the general limit of glaciation
expanded by 500–1,000 km in 7,000–10,000 years, including
the inception and growth of the Innuitian and Cordilleran Ice
Sheets. Relatively little recession occurred prior to 14 ka
BP except
in deep water on the continental shelf off New England and
Atlantic Canada (Figure L20). Indeed, the southwestern margin
of the Cordilleran Ice Sheet continued to advance through the
Puget Lowland of Washington State until 14.5 ka
BP. Thus, the per-
iod of generally maximum ice cover in North America spanned
from about 22 to 14 ka
BP, which is broader than the interval of
the global sea-level minimum by several millennia on either side.
This fact suggests that North America is more susceptible to
glaciation than are the other large, periodically glaciated regions.
The recession of ice from the LGM is portrayed in
Figure L20 at 1,000-year intervals in radiocarbon years,
assembled from Dyke et al. (2003). The glacial geomorphology
of the continent is the fundamental constraint on any interpreta-
tion of North American deglaciation. Two specific patterns,
those of end moraines and other ice marginal features and those
of ice flow features, are of primary importance. These broad
patterns have been known for decades from large-scale compi-
lations such as the Glacial Map of Canada (Prest et al., 1968 ;
Dyke and Prest, 1987) and the Glacial Map of the United States
east of the Rockies (Flint et al., 1959). The fundamental
assumption in interpreting these patterns, in common with pre-
sent and previous efforts, is that where moraines or other ice
marginal features do not record specific ice margins, the mar-
gins tended to follow normal ice flow directions. This common
assumption accounts for the fundamentally similar patterns
seen in most reconstructions of Laurentide deglaciation over
the decades, namely recession back to the three major centers
of Keewatin, Quebec-Labrador, and Baffin Island.
The second major constraint in interpreting the history of
deglaciation is the set of relevant numerical age determinations.
New “exposure dating” studies have provided important tests of
models of terrain age in the “weathering zones” along the moun-
tainous eastern seaboard (e.g., Steig et al., 1998) and have re-
affirmed the late Wisconsinan age of final coalescence of the
Laurentide and Cordilleran Ice Sheets in Alberta (Jackson et al.,
1997). However, only radiocarbon age determinations are suffi-
ciently precise at this time to allow mapping of the deglaciation
sequence at centennial resolution. The radiocarbon database of
Dyke et al. (2003) provides direct and minimum-limiting dates
on ice recession as well as maximum-limiting dateson readvances,
including the advance to the late Wisconsinan glacial limit.
Most direct dates on ice marginal positions are from sites
where moraines or meltwater features have been followed into
shell-bearing marine deposits, such as commonly occur in ice-
contact deltas. Opportunities to date ice marginal features land-
ward of the limit of postglacial marine incursion directly are
exceedingly rare, being limited to those few localities where
ice readvanced across living or recently dead vegetation or
where the varve chronologies of proglacial lakes can be tied
into the radiocarbon time scale. The remaining age control is
entirely in the form of minimum-limiting dates on lake sedi-
ments, peat, wood, plant macrofossils, foraminifera, and mam-
mal bones. Reservoir corrections are applied to radiocarbon
dates on foraminifera as they are to marine mollusks.
In summary, ages of deglaciation are reasonably well estab-
lished in most coastal areas. Varve chronologies and dated
readvances provide control at key inland sites. Elsewhere,
minimum-limiting dates are valuable constraints. Recent
improvements in age control and more detailed mapping of
deglacial patterns have brought the North American deglacia-
tion sequence more evidently into correlation with the major
climatic events recognized in the North Atlantic region and in
the Greenland ice cores. Thus, the acceleration of retreat at
14 ka
BP corresponds to the sudden warming evident in the
Summit, Greenland ice core record. More significantly, the
Younger Dryas cooling now emerges as an important control
of ice marginal behavior of the North American ice sheets,
similar to that shown by the Scandinavian Ice Sheet, a result
commensurate with growing recognition of this event in North
American pollen records. Similarly, the prominent 8.2 cal ka
BP
cold event (7.5
14
CkaBP) is now firmly correlated with the
deglaciation of Hudson Bay and drainage of glacial lakes
Agassiz and Ojibway (Barber et al., 1999).
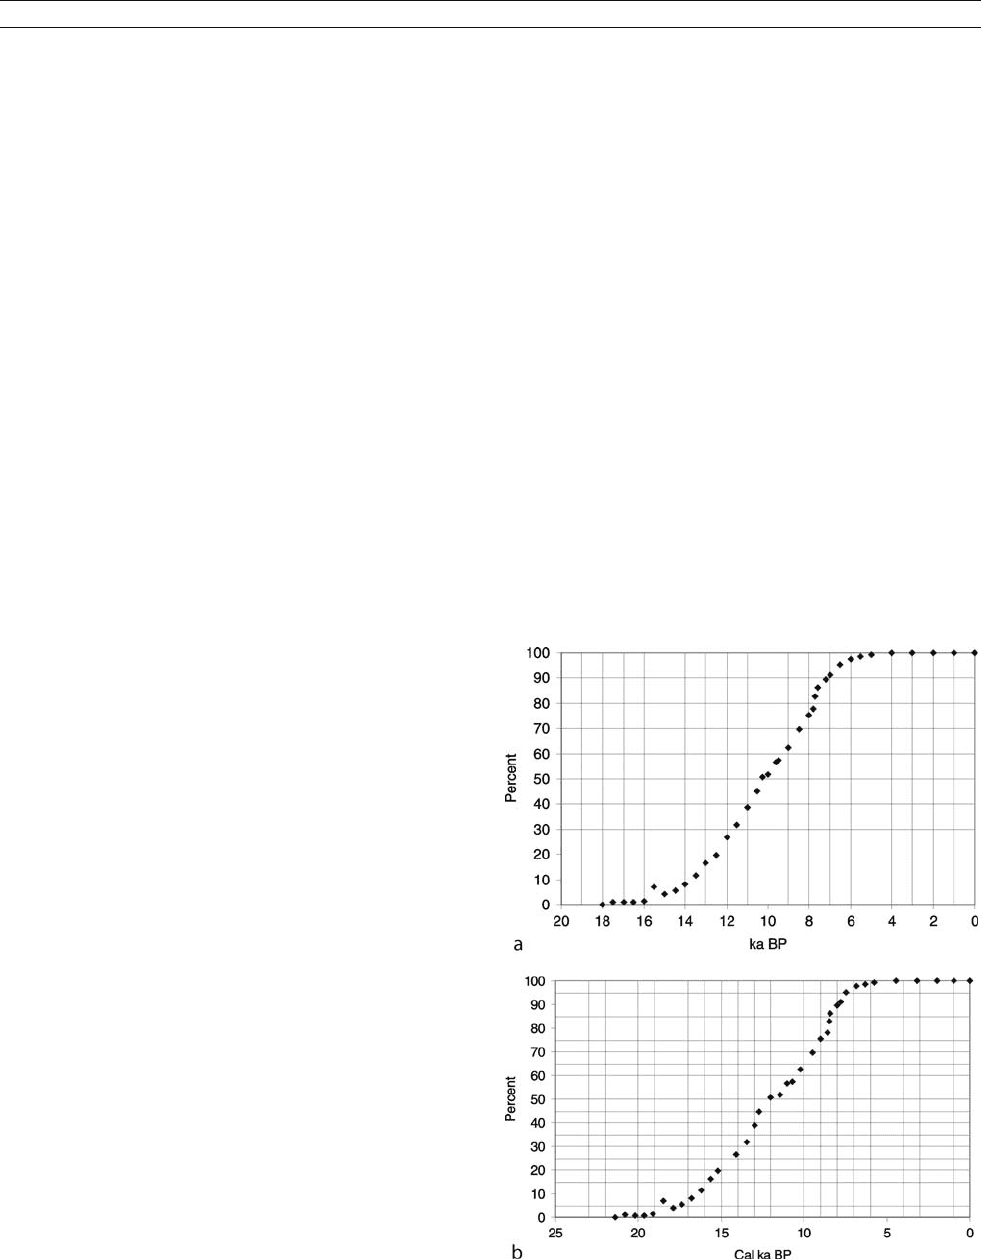
The world’s largest ice sheet complex lost < 10% of its area
prior to 14 ka
BP. It then retreated nearly linearly until 7 ka BP,
by which time only 10% of the area remained more glaciated
than it is today. This linear reduction of area, as currently
understood, was interrupted by two events: a reduced rate of
recession during the later half of the Younger Dryas, and an
increased rate as ice cleared from Hudson Bay ( Figure L21).
These events are clearer when plotted on the calendar time
Figure L21 Percent area deglaciated in North America and Greenland,
plotted on radiocarbon (a) and calendar (b) time scales.
LAURENTIDE ICE SHEET 519

scale, because the radiocarbon time scale abbreviates the dura-
tion of the Younger Dryas (Figure L21b).
The deglacial chronology accords reasonably well with
the record of global sea-level rise (Fairbanks, 1989), which
features two meltwater pulses separated by reduced melting
during the Younger Dryas interval. During meltwater pulse IA
(13–11 ka
BP), the North American ice sheet complex decreased
from about 14.9 10
6
km
2
to 1 1.5 10
6
km
2
.Duringmeltwater
pulse IB (10.5–8.5 ka
BP), ice area decreased from 10.5 10
6
km
2
to 4.2 10
6
km
2
. These area reductions correspond approxi-
mately to volume losses of 10.8 10
6
km
3
(5,400 km
3
a
1
)and
11.7 10
6
km
3
(5,600 km
3
a
1
). These rates account for 40% of
meltwater pulse IA and 60% of meltwater pulse IB. The relatively
early demise of the Eurasian ice sheets accounts for their greater
contribution to meltwater pulse IA.
Arthur S. Dyke
Bibliography
Barber, D.C., Dyke, A.S., Hillaire-Marcel, C., Jennings, A.E., Andrews, J.T.,
Kerwin, M.W., Bilodeau, G., McNeely, R., Southon, J., Morehead, M.D.,
and Gagnon, J.-M., 1999. Forcing of the cold event of 8,200 years ago by
catastrophic drainage of Laurentian lakes. Nature, 400,344–348.
Bryson, R.A., Wendland, W.M., Ives, J.D., and Andrews, J.T., 1969.
Radiocarbon isochrones on the disintegration of the Laurentide Ice
Sheet. Arct. Alp. Res., 1,1–14.
Denton, G.H., and Hughes, T.J., 1981. The Last Great Ice Sheets.
New York: Wiley, 484pp.
Dyke, A.S., and Prest, V.K., 1987. The Late Wisconsinan and Holocene his-
tory of the Laurentide Ice Sheet. Géographie physique et Quaternaire,
41,237–263.
Dyke, A.S., Andrews, J.T., Clark, P.U., England, J.H., Miller, G.H.,
Shaw, J., and Veillette, J.J., 2002. The Laurentide and Innuitian ice
sheets during the Last Glacial Maximum. Quaternary Sci. Rev ., 21,9–31.
Dyke, A.S., Moore, A., and Robertson, L., 2003. Deglaciation of North
America. Geological Survey of Canada Open File, 1574: Thirty-two
digital maps at 1:7 000 000 scale with accompanying digital chronolo-
gical database and one poster (two sheets) with full map series.
Fairbanks, R.G., 1989. A 17,000-year glacio-eustatic sea level record:
Influence of glacial melting rates on the Younger Dryas event and deep
ocean circulation. Nature, 342, 637–642.
Flint, R.F., Colton, R.B., Goldthwait, R.P., and Wilman, H.B., 1959. Glacial
Map of the United States east of the Rocky Mountains. Geological
Society of America, 1:1,750,000.
Jackson, L.E. Jr., Phillips, F.M., Shimamura, K., and Little, E.C., 1997.
Cosmogenic
36
Cl dating of the Foothills erratics train, Alberta,
Canada. Geology, 25, 195–198.
Prest, V.K., 1969. Retreat of Wisconsin and Recent ice in North America.
Geological Survey of Canada Map, 1257A, scale 1:5 000 000.
Prest, V.K., Grant, D.R., and Rampton, V., 1968. Glacial Map of Canada.
Geological Survey of Canada Map, 1253A, scale 1:5 000 000.
Steig, E.J., Wolfe, A.P., and Miller, G.H., 1998. Wisconsinan refugia and
the glacial history of eastern Baffin Island, Arctic Canada: Coupled
evidence from cosmogenic isotopes and lake sediments. Geology, 26,
835–838.
Cross-references
Cordilleran Ice Sheet
Glacial Geomorphology
Glaciations, Quaternary
Last Glacial Maximum
Moraines
Radiocarbon Dating
Sea Level Change, Quaternary
The 8200-Year BP Event
Tills & Tillites
Wisconsinan (Weichselian, Würm) Glaciation
Younger Dryas
LITTLE ICE AGE
General description
The period known as the “Little Ice Age” spans roughly the
sixteenth through the mid-nineteenth centuries. During this
time, temperatures over much of Europe were frequently unu-
sually cold, Alpine glaciers advanced, and European rivers
froze much more often than during medieval times or during
the past century and a half. Cold climates also prevailed over
several other areas, especially those adjacent to the North
Atlantic. The combination of cold conditions over both Europe
and eastern North America, the two areas with the greatest
amount of western record-keeping, led many to consider the
period as one of global cooling, resulting in the label “Little
Ice Age.”
Modern science has shown, however, that there is consider-
able regional variation in the extent of the cooling, with some
areas even warming during this period. It now appears that the
Northern Hemisphere as a whole cooled only moderately (Briffa
et al., 1998; Jones et al., 1998;Mannetal.,1999;Crowley,
2000), by several tenths of a degree. However, not enough
data exists to establish a reliable estimate for the Southern
Hemisphere as a whole. Furthermore, even in the areas that
cooled, there is a great deal of variability in the timing of the
cooling. This latter fact has led to a proliferation of time-periods
that are called the Little Ice Age, with some extending it to the
fourteenth century (Fagan, 2000).
Despite the inhomogeneous cooling during the Little Ice
Age, it remains important as it is the most reliably documented,
relatively large climate anomaly during the last millennium
(prior to the industrial revolution). Understanding the Little
Ice Age is therefore an important test of our comprehension
of natural climate variability.
Evidence
Based on early thermometer measurements, documentary evi-
dence, and proxies for past temperatures (such as tree rings
and glacier extents), it is believed that annually averaged
European temperatures were roughly 1–1.5
C colder during
the Little Ice Age relative to preceding or subsequent periods
(Pfister, 1995; Shindell et al., 2001). However, many winters
appear to have been much colder (e.g., see Fagan, 2000). Dutch
masterpieces from that time by Brueghel, van der Neer and
others show people skating on canals and rivers that almost
never freeze today. Ice was so prevalent in northern seas that
Inuit fisherman were seen as far south as Scotland. Glaciers
advanced in the Alps, Scandinavia and Iceland, destroying out-
lying farms and threatening to crush whole villages. Snow lay
on the ground in Britain and the Netherlands an average of
20–30 days during the winter between 1680 and 1730, as
opposed to an average of 2–10 days every winter during the
twentieth century (Fagan, 2000). In North America, native
tribes banded together to form the League of the Iroquois in
the face of declining food supplies and other natural hardships
during those cold years. During the American Revolutionary
War, British soldiers were able to drag massive cannons across
a frozen New York Harbor.
It is often claimed that the Viking settlements in Greenland
and the New World were wiped out by the severe drop in
520 LITTLE ICE AGE

temperatures. Local climate conditions likely changed in these
locations, but not necessarily in concert with those elsewhere.
Additionally, it seems that the cutting off of trade routes back
to Europe played a primary role in the settlements ’ demise.
An increase in North Atlantic sea ice due to climatic changes
may therefore have been more important than altered local con-
ditions. Weather in Iceland illustrates the complexity of relating
climate change to habitability. Iceland was locked in by sea ice
for several months during most years of the Little Ice Age, but
seldom after 1880. Barley was grown effectively in Iceland
from the ninth century through the twelfth, after which this
crop failed until the warming of the late 1900s. While con-
ditions were certainly harsher in Iceland during the Little
Ice Age, the cold weather there may have actually begun much
earlier.
Cause s of cooling
I t h a s l o n g b e en s p e cu la t e d th at t h e d r o p i n t em p er at u r e s w a s
due to a dimmer Sun. G al ileo ’ s development of t he teles c ope
for a stronom y in the ea r ly 1 600s al lowed early observers t o
char t t he behav i or of the S un. T hey r eg ularly noticed dark
spots, which c ycled over a period of ab o ut 11 years, a s t hey
do today. After 1645, the sp ots largel y vanished. They reap-
pear ed aro und 17 15, an d t he sunspot cy cl e has bee n present
ever sin ce. The in t erven i ng year s a re now kno wn as the
Maunder M inimum, t he most prolong ed and dramatic of sev-
eral decadal timescal e red uct ions in solar ir radiance during
the l ast mille nnium. This period c oinci des with the c oldest
European temperatures . M odern sat e llite meas urements have
confirmed th e ear l y a ssumption t hat t he number of sun spots
is rel a ted to the total brightn ess o f the Sun, though the exact
rel atio nship is not yet well quan ti fied . The Maunder Mini-
mum period, with almost no sunspots reco rded by European
a s tr o n o m er s , r ep r e s en t s t h e ex t r e m e l o w o f a m u lt i - ce n t u r y
period that ap pears to have b ee n marked by generally lo wer
solar output. E vidence f rom c osmog en i c i sotopes ( ato m i c i so-
topes p roduced only by c osmic rays wh ose abili ty to reach
the E ar th dep e nds on the sun) obtai ned from i ce co res
match es t he general pat tern of sun spot var i ab il ity during past
centuries , incl udin g the Littl e Ice A ge (Stuiver and Braziu nas ,
1989). The reduction i n solar output du ring t he Maunder
Minimu m i s es timated at about one-quarter of one percent
(Lean et al., 1995). Th ough this is a ver y smal l ch an ge, t he
output of the Sun is so large that this ca n stil l have a sizea ble
impact. H owev er, i t i s not enough to plung e t he whole E ar th
into much co lder conditions, a nd ev en to acc ount for the
modern view of the L ittl e Ice Age as a regional ph en om en o n
requires some amplific ation.
The other maj or fact or in the cooling durin g this period
was a n i ncrease i n volca nic e rup ti on f requency a nd size (Free
and R obock , 1999; C r o w l ey, 200 0). Limited historica l infor-
mation i s su pplem en ted by t he signatu re volcanic as h lay e rs
pres erv ed in ice co res. Eruptions injecte d a larger n umber of
aer osol particles in to the at mospher e during the seven teenth
cen t ury t han during t he period immediat ely f ollowing the Lit-
tle Ice A ge or during the Mediev al War m Period, which pre-
ceded it. These par ticl e s r eflect solar r adiat ion, a nd it is
esti mat e d that the additional er uptions of the sev en teen th ce n-
tury would h av e reduced the r ad ia tion reac hing t he Earth by
an amount co mpar able to the r ed uced solar output at that time
( Cr o w l ey, 2000). The global a verage surfac e te mperat ure
res ponse is proporti onal to this en ergy c hange; theref ore,
volcan ism co uld have pla yed a r ole i n th e glob al or hemi-
spheric mean r esponse al t hough t he global effects la sted only
1 – 3 year s. A combination o f solar and volcan ic influ en ces
seem s the most likely ex pla nation f or the hemispheric -sca le
cooling of the Litt le Ice Age.
Regiona l climate change
Studies have shown that changes in stratospheric ozone in
response to solar variations amplify the climate impact of those
irradiance variations (Haigh, 1996; Shindell et al., 1999; Shin-
dell et al., 2001). Incorporating those ozone changes, the most
recent climate model simulations have found that the reduced
brightness of the Sun during the Maunder Minimum causes
global annual average surface temperature changes of only a
few tenths of a degree, in line with the small hemispheric aver-
age cooling seen in the proxy data. However, regional winter-
time cooling over Europe and North America is 5–10 times
larger due to a shift in atmospheric winds (Shindell et al.,
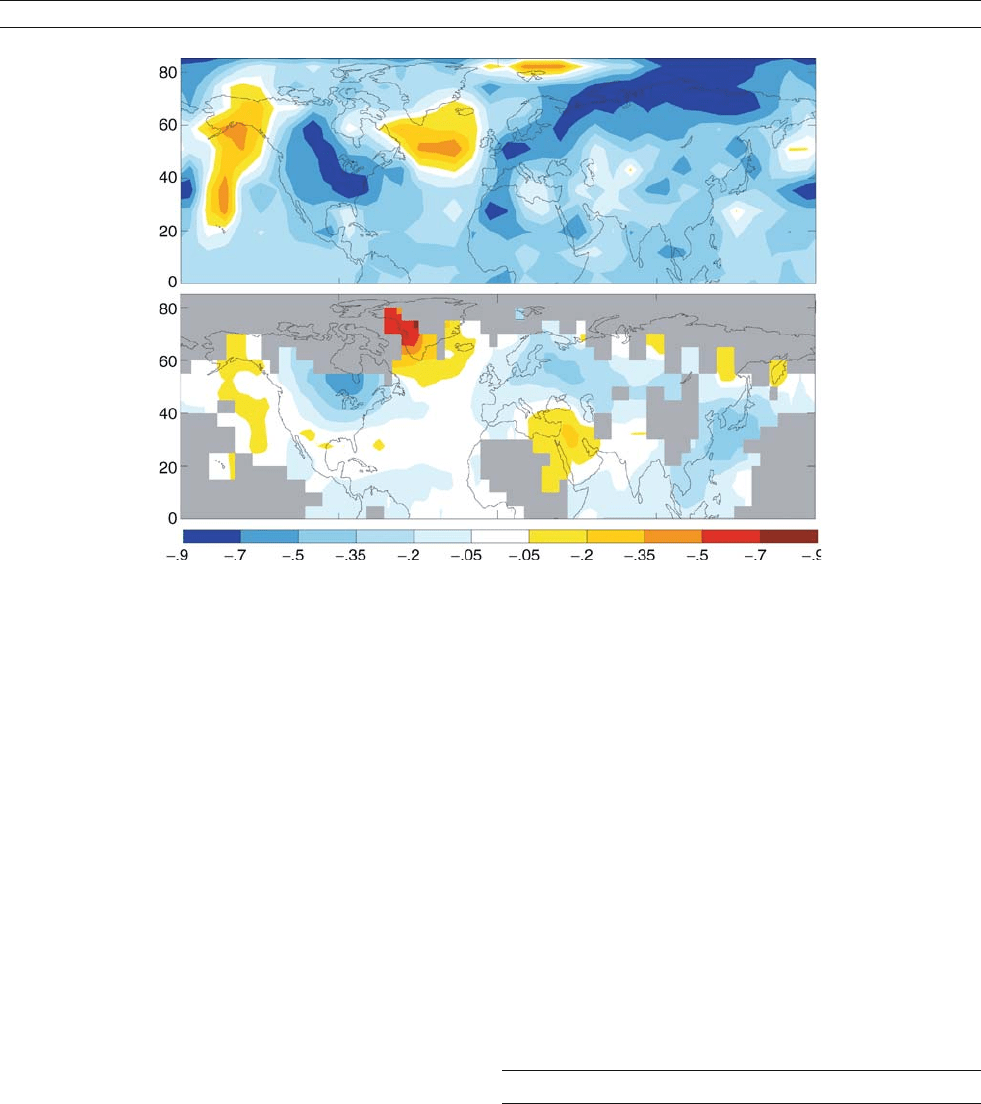
2001). Both the climate model and proxy data show that sur-
face temperature changes associated with solar output varia-
tions exhibit alternating warm oceans and cold continents at
mid-latitudes of the Northern Hemisphere (Figure L22). These
seem to occur primarily through a slowdown in the speed of
westerly winds at the Earth’s surface associated with the North
Atlantic Oscillation (NAO). Greater heating by the Sun in the
tropics relative to high latitudes causes an equator-to-pole
flow of air, which is turned towards the east by the Earth’s rota-
tion. A reduction in the amount of sunlight reaching the planet
leads to a weaker equator-to-pole heating difference, and there-
fore slower winds. Ozone changes in the stratosphere amplify
this effect.
Impacts on surface temperatures are particularly large in
winter. Because the oceans are relatively warm during the win-
ter due to their large heat storage, the diminished flow creates a
cold-land / warm-ocean pattern (as shown in Figure L22 )by
reducing the transport of warm oceanic air to the continents,
and vice versa. Changes in this wind flow have only a small
impact on global temperatures as the warm and cold regions
average out. However, they have a large regional effect and
increase the frequency of extreme events, such that a reduction
in winds would lead to many more extremely cold days over
Europe and eastern North America (which may stand out in
the historical record). The shift in circulation thus appears to
be the solution to the apparent paradox of extreme cold with
only a marginally dimmer sun. Ocean circulation may have
also responded to solar irradiance fluctuations. Volcanic erup-
tions are known to induce a positive bias in the NAO during
the winter following the eruption, but this is opposite to the
pattern seen during the Little Ice Age. Their long-term impact
is likely to be relatively minor, as the particles injected into
the upper atmosphere typically remain there in sufficient num-
bers to affect climate for only a year or two.
Though early records of wind flow are extremely limited,
historical data associates the European seventeenth century
winter cooling with enhanced northeasterly advection of con-
tinental air, consistent with an anomalous negative phase of
the NAO (Slonosky et al., 2001). Reconstructions of the
strength of the NAO from instrumental and proxy data suggest
that there may have been a long-term weakening during the Lit-
tle Ice Age (Luterbacher et al., 1999). Ocean sediments show a
decreased sea surface temperature of 1–2
C in the Sargasso
Sea during the sixteenth to nineteenth centuries, and warmer
LITTLE ICE AGE 521
Atlantic temperatures north of 44
N latitude, extending to the
area off Newfoundland (Kiegwin and Pickart, 1999), consistent
with a reduced NAO, but not with uniform basin-wide cooling.
Drew T. Shindell
Bibliography
Briffa, K.R., Jones, P.D., Schweingruber, F.H., and Osborn, T.J., 1998.
Influence of volcanic eruptions on Northern Hemisphere summer tem-
perature over the past 600 years. Nature, 393, 350–354.
Crowley, T.J., 2000. Causes of climate change over the past 1000 years.
Science, 289, 270–277.
Fagan, B., 2000. The Little Ice Age, New York: Basic Books, 272 pp.
Free, M., and Robock, A., 1999. Global warming in the context of the Lit-
tle Ice Age. J. Geophys. Res., 104, 19057–19070.
Haigh, J.D., 1996. The impact of solar variability on climate. Science, 272,
981–984.
Jones, P., et al., 1998. High-resolution palaeoclimatic records for the last
millennium: interpretation, integration and comparison with General
Circulation Model control-run temperatures. Holocene, 8, 455–471.
Kiegwin, L.D., and Pickart, R.S., 1999. Slope water current over the Laur-
entian Fan on Interannual to Millennial Time Scales. Science, 286,
520–523.
Lean, J., Beer, J., and Bradley, R., 1995. Reconstruction of solar irradiance
since 1610: Implications for climate change. Geophys. Res. Lett., 22,
3195–3198.
Luterbacher, J., Schmutz, C., Gyalistras, D., Xoplaki, E. and Wanner, H.,
1999. Reconstruction of monthly NAO and EU indices back to AD
1675. Geophys. Res. Lett., 26, 2745–2748.
Mann, M.E., Bradley, R.S., and Hughes, M.K., 1999. Northern hemisphere
temperatures during the past millennium: Inferences, uncertainties, and
limitations. Geophys. Res. Lett., 26, 759–762.
Pfister, C., 1995. Monthly temperature and precipitation in central Europe
1525–1979: Quantifying documentary evidence on weather and its
effects. In Bradley,R.S., and Jones, P.D. (eds.), Climate Since A.D.
1500. London: Routledge, pp. 118–142.
Shindell, D.T., Rind, D., Balachandran, N.K., Lean, J., and Lonergan, P.,
1999. Solar cycle variability, ozone, and climate. Science, 284, 305–308.
Shindell, D.T., Schmidt, G.A., Mann, M.E., Rind, D., and Waple, A., 2001.
Solar forcing of regional climate change during the Maunder Minimum.
Science
, 294, 2149–2152.
Slonosky, V.C., Jones, P.D., and Davies, T.D., 2001.Instrumental pressure
observations and atmospheric circulation from the 17th and 18th centu-
ries: London and Paris. Int. J. Climatol., 21, 285–298.
Stuiver, M., and Braziunas, T.F., 1989. Atmospheric C-14 and century-
scale solar oscillations. Nature, 338, 405–408.
Cross-references
Climate Variability and Change, last 1,000 years
Cosmogenic Radionuclides
Maunder Minimum
Medieval Warm Period
North Atlantic Oscillation (NAO) Records
Sun-Climate Connections
Volcanic Eruptions and Climate Change
LOESS DEPOSITS
Definition
Loess can be defined simply as a terrestrial clastic sediment,
composed predominantly of silt-sized particles, which is
formed essentially by the accumulation of wind-blown dust.
Initially, von Leonhard (1823–1824) used the word “Loeb”
for friable silty deposits near Heidelberg, based on the word
“Loesch” for loose soil, which was the term used by the local
people of the Rhine Valley. Lyell (1834–1845) brought the
Figure L22 Annual average surface temperature change (C) due to solar irradiance change between the Maunder Minimum (late seventeenth
century) and a century later, when solar output had returned to relatively large values, in the NASA Goddard Institute for Space Studies climate
model (top) and in the historical temperature reconstructions (bottom).
522 LOESS DEPOSITS
term into widespread usage and was responsible for stimulating
interest in similar deposits. However, the eolian origin of loess
did not become widely accepted until the publications of
von Richthofen (1870–1885). Several genetic and descriptive
definitions of loess have been discussed since that time.
Although the sub-aerial wind-fall origin, as well as silt-sized
quartz particles domination, are the leading criteria of loess sedi-
ments, other additional definitive features (e.g., loose, unstrati-
fied, porous, calcareous, pale yellow, occurring in mantle form,
etc.) are advocated by many scientists. In a historical perspective,
the definition’s use was controlled by its application.
Composition and features
Loess is relatively well-sorted clastic sediment that is homoge-
neous, porous and slightly altered. Typical loess (so called “pri-
mary loess”) usually has a yellow or pale yellow color. Coarse
silt particles (10–50 mm in diameter) make 40–70% of typical
loess by weight. This size fraction of particles is characteristic
of eolian dust deposits and commonly is called the “basic,”
“loess” or “loessic” fraction. The percentage of clay and sand
content in loess is subordinate in importance (5–20%). Beside
the prevailing quartz grains (40–80%), it may contain feldspar,
calcite and dolomite. Quartz in loess occurs as irregular, suban-
gular and angular grains with characteristic surfaces resulting
from mechanical fragmentation. Among clay minerals, either
illite or montmorillonite dominates are present, although kaoli-
nite, vermiculite and chlorite may also be present in smaller
amounts. Carbonate content is variable (ranging from 1 to
20%), depending on environmental conditions. Mineral grains
are slightly cemented and partly aggregated mostly by carbonate.
Primary carbonates usually are dolomite particles but secondary
carbonates consist of calcite coatings on silt grains, fillings in
interstices and vertical tubes left from the decay of grass roots.
The void ratio is usually extremely high (45–55%) in loess,
and the average diameter of aggregates is 10–15 mm. Loess is
permeable to water and easily collapses when saturated with
water. The compression strength of loess is about 1.5 kg dm
2
.
The collapsibility leads to eventual problems for engineering
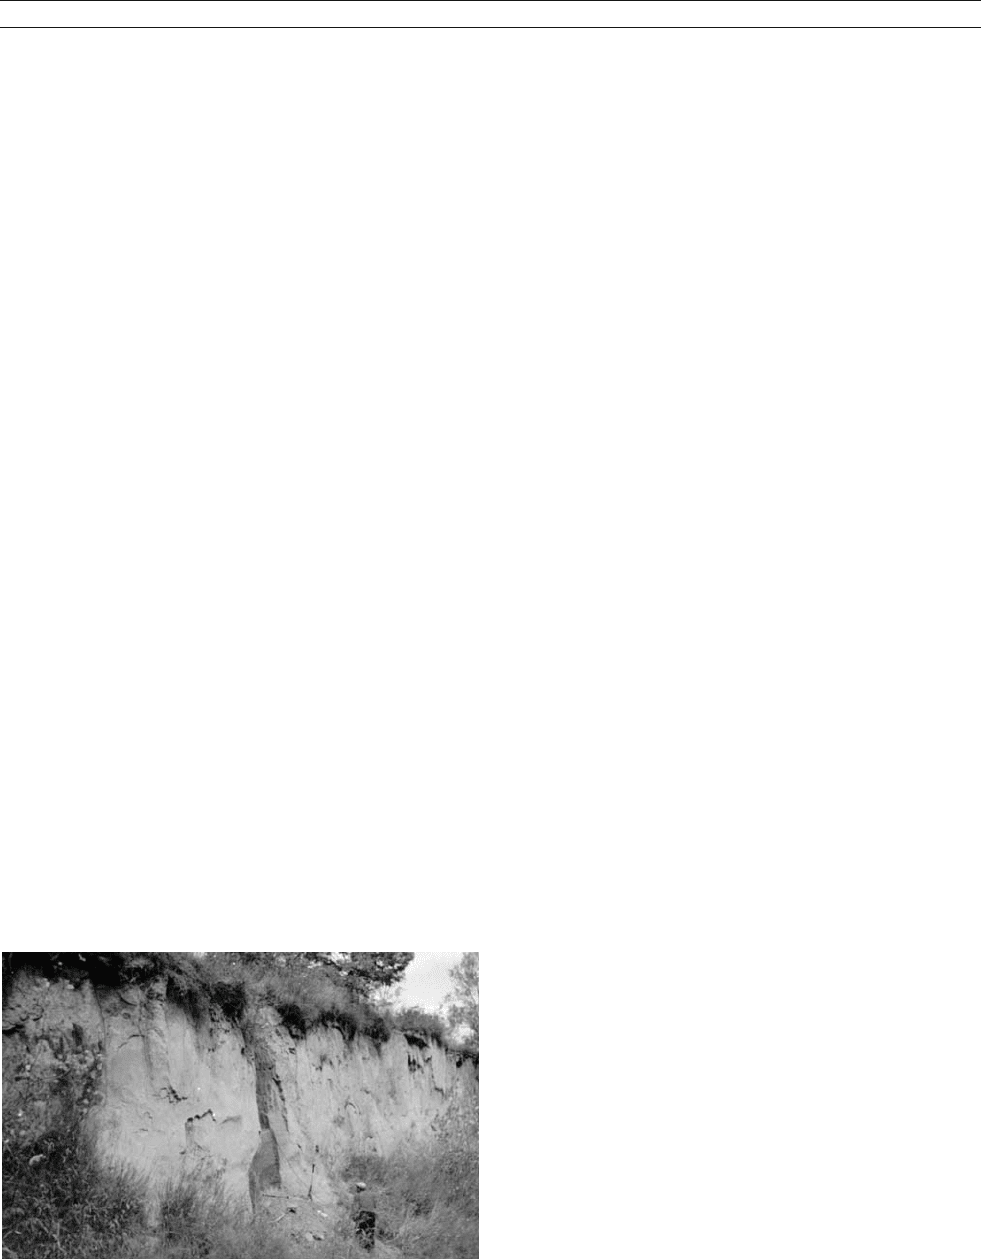
activities in loess areas. Moreover, loess is easily eroded by sur-
face water and liable to underground piping, though under
dry conditions even steep loess walls are stable (Figure L23).
Remnants of terrestrial materials, mostly of cryophile fauna
and flora, are typical in the loess horizons. Individual loess
horizons are usually unstratified, but loess sequences often contain
intercalated loam or sand beds (Liu et al., 1985; Pécsi, 1990).
Although the above features are characteristic of typical
loess, non-typical loess or “loess-like sediments” of similar
properties and genesis is widespread. In many loess sequences
there is a continuum of modified loess, which ranges from
weakly developed leached layers to intensely weathered paleo-
sols and pedocomplexes. When altered by active soil forma-
tion, loess becomes more clay-like, hardens and can be either
leached of primary carbonates or enriched by secondary carbo-
nates. When redeposited by rainwater runoff, snowmelt and
other processes, loess becomes slightly stratified. The terms
“secondary loess,”“altered loess,”“degraded loess,”“redepos-
ited loess,”“loess derivates” and “reworked loess” have been
used to describe such varieties of loess.
Origin
The origin of loess has a long history of controversy. Since von
Richthofen suggested the “subaerial” theory of loess formation
in 1870, the eolian origin of loess has been the most popular
and best-documented. Succeeding investigations refined the
process of eolian dust sedimentation and loess feature forma-
tion. The contributions of Tutkovskii, Obruchev and Kriger
(Russia), von Richthofen and Grahmann (Germany), Liu
(China), Fink (Austria), Kukla (Czechoslovakia) and Pécsi
(Hungary), as well as Pye and Péwé (USA), are well known
(Smalley, 1975; Liu et al., 1985; Pécsi, 1990; Pye, 1995).
Three conditions are required for loess deposition: (a) a
large supply of suitable dust-sized particles that is sustained,
at least episodically, over a period of tens to hundreds of thou-
sands of years; (b) adequate wind energy to transport the dust,
and (c) the existence of suitable dust traps downwind of the
dust source area.
Although in situ weathering products may be directly
deflated, in most instances at least one intermediate stage
of alluvial or glaciofluvial transport and deposition is involved
before it is picked up by wind and deposited as loess. Extensive
loess deposits appear to be a Quaternary phenomenon and show
a clear spatial relationship with areas of Pleistocene continental
glaciation. Such deposits have been referred to as “glacial” or
“periglacial” loess. The constituent silt particles were formed
largely by sub-glacial grinding and subsequently deflated from
glaciofluvial outwash deposits. Loess cover is particularly thick
(almost up to 30 m) near valleys that served as meltwater draina-
geways, but thins and becomes finer away from valleys. Depos-
its of loess also occur on the semi-arid margins of some deserts
(“peridesert loess”). In this case, significant amounts of quartz
silt are probably produced by eolian abrasion and weathering
processes in deserts or in adjacent mountain ranges before being
deflated and deposited as loess. As opposed to the “cold
loesses” of periglacial zones, the peridesert loesses are called
“warm loesses” (Smalley, 1975, Liu, 1985, Pye, 1995).
The magnitude of the dust flux and pattern of dispersion from a
potential source are strongly influenced by the nature of the pre-
vailing regional winds. Local wind systems, such as valley winds,
can be important in forming proximal dust deposits, but longer-
range transport and formation of distal deposits requires the invol-
vement of regional-scale wind systems. Dry deposition is
enhanced wherever there is a reduction in wind speed or an
increase in surface roughness. However, if dust passesover a water
body, moist ground or a vegetated surface, the particles may be
trapped. Subsequently, on impact of rainwater runoff, snowmelt
or other processes on the slope, grains may be moved further away
Figure L23 Peoria and Roxana loess horizons of the Wisconsinian time
at Crowley’s Ridge, Arkansas.
LOESS DEPOSITS 523
until they are stabilized by vegetation. Soil and related weathering
processes are a syn- or post-depositional alteration of the primary
deposit, and to some geologists are early stage diagenesis.
An alternative hypothesis (“soil-eluvial,”“in situ” or “back-
swamp-loessification”) of loess formation was suggested by
Berg in Russia in 1916, and then advocated by Russel and Fisk
in the USA in 1944 (Smalley, 1975; Follmer, 1996). This
hypothesis excludes the eolian factor and assumes most of
loess sediments have a fluvial origin. According to this idea,
any fine-grained deposits may be converted into typical loess
as a result of weathering and soil forming processes. The in situ
theory has not been well-documented or widely accepted since
that time. The fundamental defect of the theory is that it creates
a cascade of increasingly complex relationships that require
unrealistic explanations, such as great tectonic uplift, excessive
amounts of alluviation, and greater depths of valley cutting dur-
ing erosion cycles. Also the characteristic angular grains of
quartz are not explained by this theory.
Distribution
Loess is one of the widest-spread formations of the ice age, but
it also forms on semi-arid desert margins and on foothills of
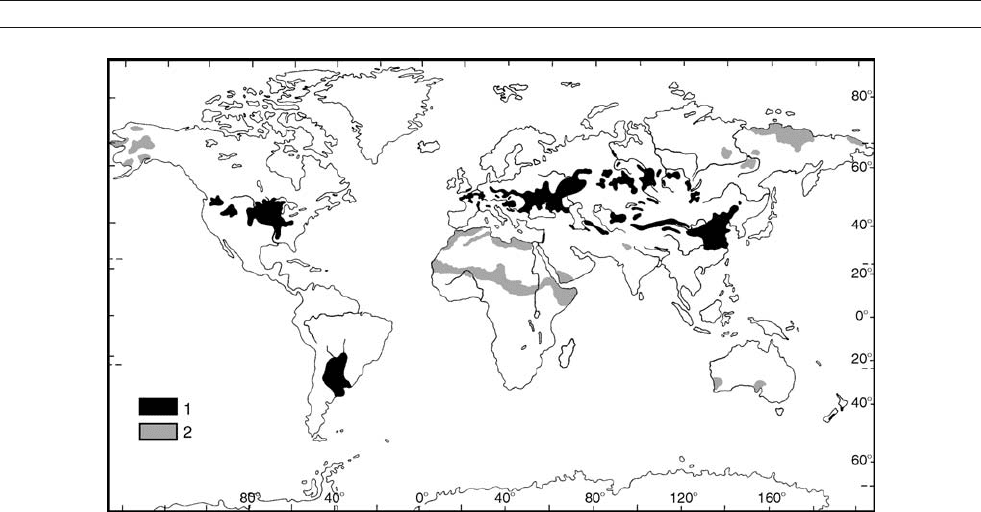
mountain ranges. Loess sediments cover almost 10% of the
world’s land surfaces. Extensive loess and loess-like sediments
occur on plains, plateaus, pediments and major river basins
(Figure L24). Loess reaches its maximum thickness ( > 100 m)
on the Loess Plateau of China, but usually loess series are not more
than 30 m thick. In Eurasia, typical loess is also common in south-
ern Siberia, central Asia, on the Russian Plain, in central Europe,
and in isolated areas in Western Europe. Loess is widespread on
the Columbia Plateau and Mississippi basin in North America
and on La Plata basin in South America.
Outside the present-day temperate belt, non-typical loess vari-
eties have developed. They vary in clay and sand content, mineral
composition and color. Some loess, such as that in New Zealand
and Argentina has a high content of volcanic glass and feldspars,
while loess in parts of Central Asia, the Rhine Valley and the Mis-
sissippi Valley has a high content of carbonate minerals (up to
30%). Some deposits, such as those of Nebraska, contain up to
40% sand (sandy loess). At the other end of the spectrum, fine-
grained loesses on the southeastern and eastern marginsof the Chi-
nese Loess Plateau and Tadjikistan have more than 20% clay
(clayey loess). Brownish-pink loess varieties are common in the
Mediterranean climatic zone (Kashmir, Pakistan, Iran, Israel,
North Africa and New Zealand) and non-calcareous loesses were
formed under relatively humid environmental conditions in some
regions. A special loess variety, the “yedoma” loess-ice complex,
occurs in large patches in northeastern Siberia, in the permafrost
tundra zone. Along Yukon River in Alaska and on the Loess
Plateau of China, high rates of loess deposition continue today.
Konstantin G. Dlussky
Bibliography
Follmer, L.R., 1996. Loess studies in central United States: Evolution of
concepts. Engin. Geol., 45, 287–304.
Liu, T., et al., 1985. Loess and the environment, Beijing, China: China
Ocean Press, 251pp.
Pécsi, M., 1990. Loess is not just the accumulation of dust. Quat. Int., 7/8,
1–21.
Pye, K., 1995. The nature, origin and accumulation of loess. Quat. Sci.
Rev., 14, 653–667.
Smalley, I.J. (ed.), 1975. Loess: lithology and Genesis. Benchmark Papers in
Geology, vol. 26. Stroudsburg, PA: Dowden, Hutchinson & Ross, 429pp.
Cross-references
Dust Transport, Quaternary
Eolian Sediments and Processes
Glaciations, Quaternary
Mineral Indicators of Past Climates
Paleosols – Quaternary
Sedimentary Indicators of Climate Change
Wisconsinan (Weichselian, Würm) Glaciation
Figure L24 Distribution of loess and loess-like sediments. 1: Loess and loess-like sediments; 2: Loess derivates and loess-like sediments (after
Pe
´
csi, 1990).
524 LOESS DEPOSITS

M
MARINE BIOGENIC SEDIMENTS
General features
Biogenic (or biogenous) sediments are ubiquitous in marine
environments; the main divisions are readily classified with
reference to the amount of carbonate present and the depth of
water at which they are found (shallow or deep). The dominant
types are (in the order of abundance): deep-sea carbonates (cal-
careous ooze, foraminifer ooze, nannofossil ooze); deep-sea
siliceous deposits (siliceous ooze, diatom ooze, radiolarian
ooze); hemipelagic silica-rich deposits (at continental margins
below upwelling regions); shelf carbonate deposits (reef and
platform carbonates, dominated by coral and algal debris or
by foraminifer and mollusk materials, depending on circum-
stances; reefal debris, lagoonal carbonate muds, etc.); and var-
ious types of anaerobic deposits (rich in organic matter and
with or without opal or carbonate). Because deep sea covers
most of the surface of the planet, the dominant biogenic depos-
its are deep-sea sediments, and their dominant ingredient is
pelagic plankton, reflecting the fact that production is tied to
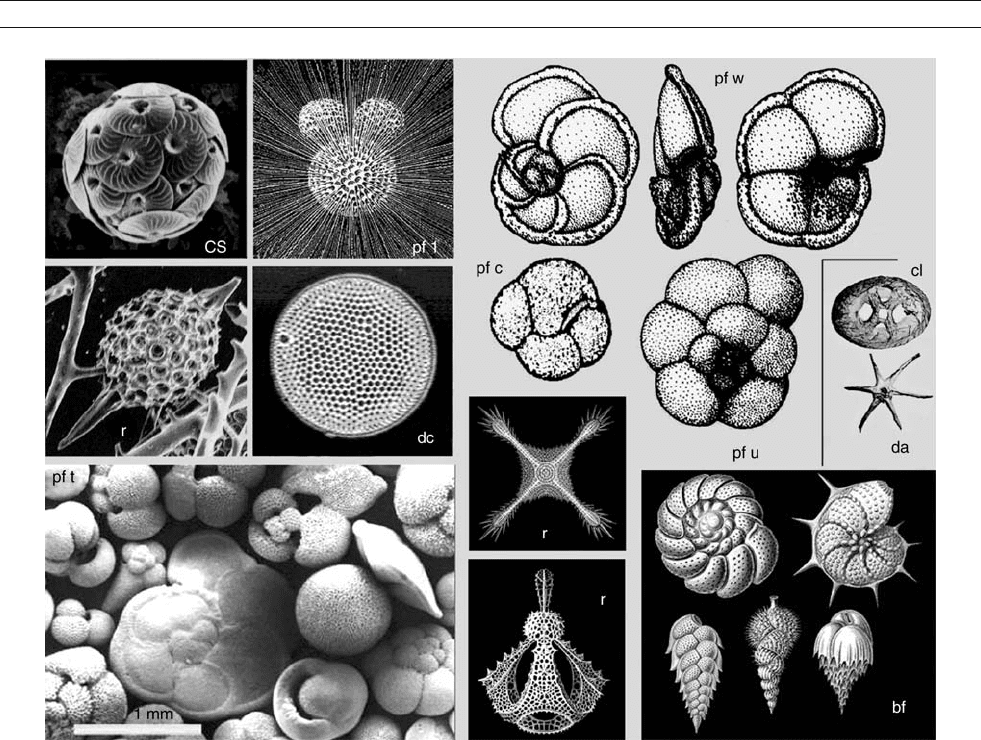
sunlight (Figure M1).
The key ingredients of biogenic sediments are therefore cal-
cium carbonate, opaline silica, and organic matter; the first two
of these ingredients are largely in the shape of microfossils on
the deep-sea floor (Funnell and Riedel, 1971; H. C. Jenkyns, in
Reading, 1986). Opaline fossils and organic matter tend to
occur together (but not invariably so) and are generally found
in high productivity regions. While carbonate is precipitated
in such regions, it tends to be dissolved because a high supply
of organic matter will increase carbon dioxide levels at the
water-sediment interface, which produces carbonic acid. This
circumstance was well understood by John Murray of the Chal-
lenger Expedition in the nineteenth century. Murray also pro-
vided the main subdivisions of deep-sea sediments and noted
that deep-sea carbonates tend to occur in the shallower half
of the deep-sea floor. The boundary is referred to as the “carbo-
nate compensation depth” or CCD. It is the largest of the bio-
genic sedimentary features on Earth and reflects a balance
between rate of supply (almost all from calcareous plankton)
and rates of dissolution (which increase with depth). The level
of the CCD responds to the carbon chemistry of deep waters,
and is quite different in the North Atlantic (deepest, below
5 km) and North Pacific (shallowest, above 4 km north of the
equator). Roughly, this level runs parallel to the “apparent oxy-
gen utilization”; that is, the amount of oxygen in deep water
that has been converted to carbon dioxide. Because of this rela-
tionship, fluctuations of the CCD through time are useful in the
reconstruction of the marine carbon cycle, and provide (some)
clues to changes in the sharing of carbon dioxide between
ocean and atmosphere. Quite generally, the deposition of bio-
genic sediments and the record contained therein are crucial
ingredients in defining the machinery of global biogeochemical
processes (e.g., Butcher et al., 1992).
Shallow-water carbonate deposits
Biogenic sediments in the sea consist of fossils or fragments of
fossils. Initially, it was the study of fossils (paleontology) that
dealt with their origin and applied this knowledge in biostrati-
graphy (the dating of sedimentary sequences and the tracing
of evolution) and the reconstruction of environments of the past
(paleoecology, paleoclimatology, paleoceanography). Geolo-
gists interested in these subjects studied modern shallow-water
environments, beginning in the nineteenth century, with empha-
sis on corals, mollusks, foraminifers and other organisms pro-
ducing hard parts of carbonate. Reefs provided an early focus
and attractor because fossil diversity tends to be high in reefs
(“bioherms”) preserved in the geologic record (for an overview,
see B. W. Sellwood, in Reading, 1986). From the 1950s, devel-
opments in scuba diving opened entirely new avenues for direct
observation and for experiments (Figure M2). Sampling sub-
merged coral now routinely provides information about past
conditions of growth, based on the measurement of growth
bands, supplemented by chemical analysis. The study of mod-
ern environments and of the record preserved in skeletal struc-
tures has provided tools to study ancient environments as well,
using fossils from the appropriate time. The information sought
includes depth of water, temperature, productivity, dynamic
interactions between organisms and environment and between
the organisms themselves, the role of disturbance, and seasonal
variation. Above all, fossils – whether large or small (macro- or
micro- or nanno-fossils) – record their environment of growth.
If they do not like the extant conditions, they may shut down
and record nothing (“biased reporting”). To gather information
about past climate conditions, therefore, one has to employ sev-
eral lines of evidence, using paleontology, sedimentology, geo-
chemistry, and physical principles in a best-guess approach to
reconstruction.
The largest biogenic structure on the planet is the Great
Barrier Reef (GBR) off the northeastern coast of Australia.
Drilling (by the drilling vessel JOIDES Resolution, in the
context of the international Ocean Drilling Program (ODP,
1985–2003)) has demonstrated that the bulk of the structure
is geologically young, less than one million years old. Presum-
ably, the origin of the great reef is tied to the large sea level
fluctuations that occurred after 800,000 years ago. Reefs are
rubble factories, and sea level fluctuations stimulate rubble
production. In particular, the periods of rapid rise during
the melting of large ice sheets would have favored survival
and expansion of rapidly growing species, such as those
belonging to the genus Acropora. In addition, sometime after
the Mid-Pleistocene Climate Shift (see below), the Western
Equatorial Warm Pool expanded southward to the region of the
GBR, presumably aided by the clogging of the warm-water exit
into the Indian Ocean and by the reef rubble produced around
Indonesian islands. The GBR is a highly irregular structure
(Figure M3). Its features and those of other reefs in the South
Pacific erode during low stands of sea level (especially chemical
erosion; Purdy, 1974), and build up during high stands favoring
shallow ground. Without sea level fluctuation and attendant ero-
sion, the product of reef growth is a carbonate platform.
Deep-sea carbonate deposits
Calcareous ooze rich in foraminifers was first discovered as a
widespread deposit on the deep-sea floor in the middle of the
nineteenth century. It was not clear, initially, whether the bio-
genic remains evident within the ooze originated on the sea
floor or in the water. John Murray showed, by comparing
plankton samples with sediment samples, that the bulk of the
sand-sized material consists of planktonic foraminifers (“Globi-
gerina ooze” ). He also realized that the preservation of these
fossils deteriorates with depth in the water, such that all carbo-
nate would be dissolved below some depth (now known as the
Figure M1 Key ingredients of the dominant biogenic sediments on Earth; that is, deep-sea calcareous and siliceous ooze. cs: Coccolithophorid
(ca. 20 mm; B. Donner, Bremen); pf l: living planktonic foraminifer within its halo of spines (E. Haeckel); r: (leftmost) radiolarian (C. Samtleben, Kiel);
dc: centric diatom (O. Romero, Bremen); pf t: tropical assemblage of planktonic foraminifers (M. Yasuda, SIO); pf w: warm-water planktonic
foraminifer (F. L. Parker, 1962); pf c: cold-water species; pf u: upwelling species; cl: coccolith; da: discoaster (both D. Bukry and M. N. Bramlette,
1969); r: radiolarians (E. Haeckel); bf: benthic foraminifers (E. Haeckel).
526 MARINE BIOGENIC SEDIMENTS
CCD), leaving only “Red Clay.” The CCD describes the nar-
row depth-dependent zone where carbonate-rich sediments give
way to red clay and other carbonate-poor deposits bathed by
undersaturated waters. A more subtle assessment of conditions
on the sea floor at the time of deposition is possible by noting
the state of preservation of calcareous fossils (Figure M4). A
narrow zone separating well-preserved from poorly preserved
fossils within the calcareous ooze defines the level of the “lyso-
cline.” The lysocline fluctuates through time as a result of
changes in deep circulation, which affects oxygen and carbon
dioxide content of deep waters. Quite generally, patterns of pre-
servation (taphonomy) hold a large amount of information
regarding the environmental conditions during deposition of
biogenic sediments.
The fact that rates of carbonate accumulation change consid-
erably in a given region of the deep-sea floor was discovered
during the Swedish Deep-Sea Expedition (1947–1948). It was
especially obvious in the eastern equatorial Pacific, where sedi-
ments show regular cycles of light and dark colors, associated
with high and low carbonate content. Both fluctuations in car-
bonate production and fluctuations in the intensity of carbonate
dissolution can produce such cycles. The sediment cycles were
linked to productivity fluctuations that were in turn ascribed to
changing trade wind intensities and equatorial upwelling, with
ice ages having the stronger winds and increased upwelling
(Arrhenius, 1952). In general, these concepts were supported
by later studies, although the light-dark cycles are largely a
result of variations in the intensity of carbonate dissolution.
Overall, calcareous nannofossils are the dominant compo-
nent of calcareous ooze, especially in the large regions of low
productivity below the central gyres. Thus, the typical biogenic
deposit on the planet is coccolith ooze. Study of the minute
coccoliths (platelets shed from coccolithophorids, Figure M1,
upper left) requires the use of powerful microscopes. The
invention and spread of scanning electron microscopes greatly
aided in producing inventories and detailed descriptions of
these fossils (Winter and Siesser, 1994). The pioneer work
was done using petrologic microscopes, and these instruments
still are the preferred tools for routine shipboard analysis, i.e.,
for the biostratigraphic dating of sediments during drilling
expeditions. The presence of easily recognized nannofossils
known as “discoasters” (Figure M1, far right) indicates an
age greater than Quaternary, for example. Discoasters died
out at the end of the Pliocene.
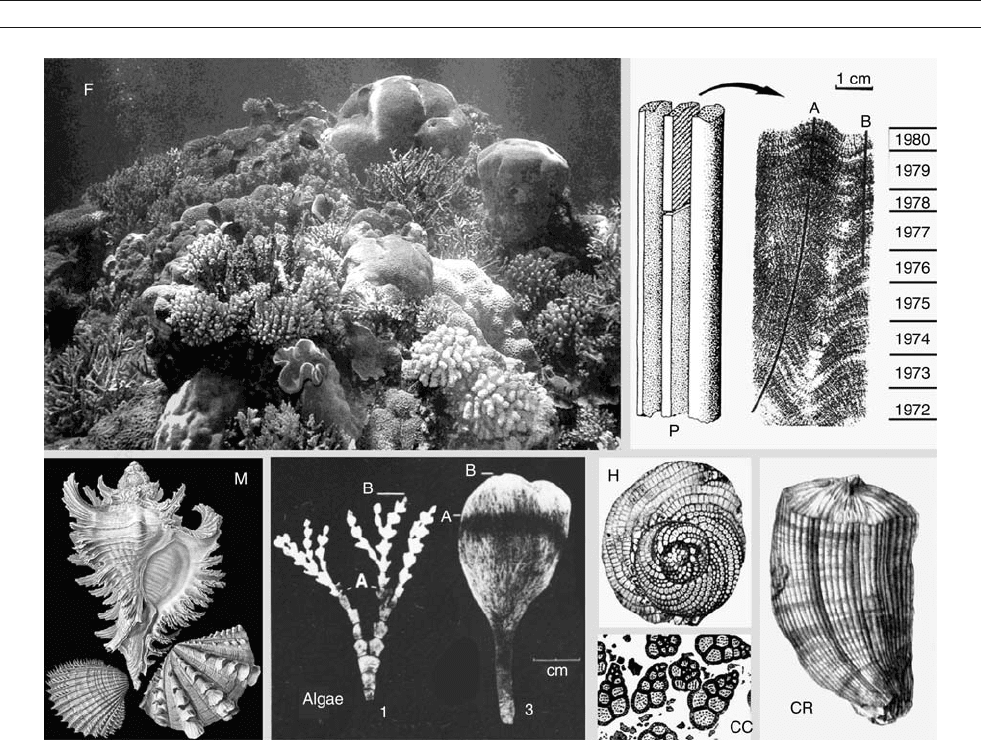
Figure M2 Shallow-water calcareous biogenic sediments originate from carbonate-secreting organisms such as corals, mollusks, algae, and
foraminifers. F: Tropical coral reef at Fanning Island (SIO photo); P: core sample from a specimen of Porites from the western tropical Pacific
(J. Pa
¨
tzold, Bremen); M: armored mollusks (E. Haeckel); Algae, in situ staining of calcareous algae in Bermuda (Halimeda, Penicillus) to determine
rate of growth (G. Wefer); H: Heterostegina, a large benthic foraminifer bearing photosynthesizing symbionts (A. Loeblich and H. Tappan); CC:
foraminifers in Cretaceous chalk (M. Neumayr); CR: Cretaceous mollusk, reef-forming in places (rudist pelecypod, M. Neumayr).
MARINE BIOGENIC SEDIMENTS 527
In places, especially on relatively shallow regions of the
Atlantic, calcareous ooze contains the shells of pelagic gastro-
pods, in varying proportions. Such shells are made of arago-
nite, a polymorph of calcium carbonate that is much more
soluble than calcite. The shells are typically 1 cm long; where
dominant (made so by bottom currents washing the sediment)
they constitute “pteropod ooze.”
The process of seafloor spreading slowly moves calcareous
sediments to greater depth, on a million-year time scale. Thus,
as a general rule, deep-sea sediments overlying basaltic base-
ment (generated at the spreading center) should be rich in car-
bonate, while sediments overlying these older deposits should
have less carbonate. That is, by the principles of “plate strati-
graphy,” sediments at the bottom of the stack were originally
deposited at shallower depths above the CCD near the spreading
center. As the plates moved apart and the ocean floor subsided,
older sediments fell below the CCD. Reality is more compli-
cated because of large fluctuations of the CCD through geo-
logic time. The largest such excursion was the enormous drop
of the CCD to deeper levels around 40 million years ago
(Figure M5). This drop (toward the end of the Eocene) repre-
sents a large shift in carbonate accumulation patterns, from shelf
to deep sea. It heralds the beginning of the great cooling that
dominated the Cenozoic and illustrates the importance of moun-
tain building (uplift on land removes shelf seas) in the course of
this cooling. The marked drop of the CCD in the Atlantic since
about 10 Ma marks the turning on of deepwater production there;
that is, a filling of the basin with more saturated waters (said to be
“young”). At the same time, opaline fossils on the sea floor dis-
solved more easily from that time onwards (young water bears
less silicate than old) and there was an overall shift of silica
deposition from the Atlantic to the Pacific.
The Auversian Facies Shift at 40 million years ago, when
carbonate deposits become widespread on the deep-sea floor,
is well expressed in the acoustic stratigraphy of deep-sea depo-
sits. The shift is recognized in the western tropical Pacific as a
marked change from highly reflective layers (interbedded lime-
stones and chert) to more or less transparent (echo-lacking)
chalk sequences. The fundamental reason for this development
is twofold: the switch of carbonate deposition from shelves to
the deep-sea floor, and the removal of opal into upwelling
regions by diatom deposition, including in the belt around
Antarctica. Upwelling is a function of winds, and winds are dri-
ven by temperature gradients, hence zonal winds that drive
year-round upwelling increase with polar cooling.
Ocean and climate history
The study of biogenic sediments, especially those recovered
from the deep-sea floor, provides the basis for reconstruction
of ocean and climate history for the last 100 million years or
so (paleoceanography). Information for periods before this time
is difficult to obtain because seafloor subduction removes the
evidence. The main tool in reconstruction is a detailed biostra-
tigraphy (Berggren et al., 1985; Bolli and Saunders, 1985),
greatly aided by coordination with the history of magnetic
reversals. The main clues for reconstruction are derived from
a combination of biogeography and stable isotopes, notable
oxygen and carbon isotopes (Vincent and Berger, 1981;
Kennett, 1985; Wefer and Berger, 1991), complemented by a
large number of additional proxies for environmental condi-
tions (Hay, 1988; Fischer and Wefer, 1999). The most detailed
reconstructions have centered on the last glacial maximum
(following the CLIMAP studies, 1976) and on the sequence
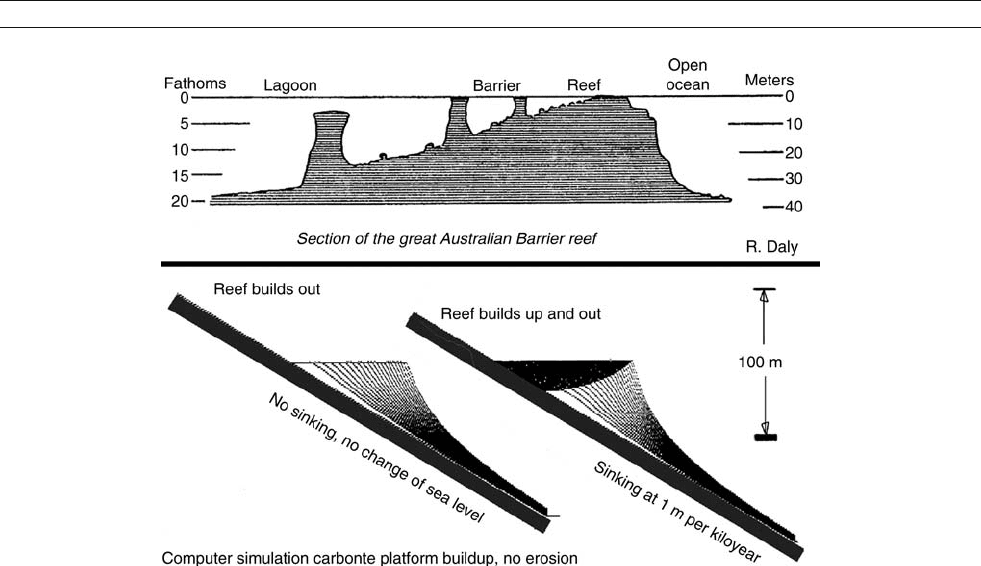
Figure M3 Nature of the Great Barrier Reef, as a product of differential buildup (during high sealevel stand) and erosion (during low stands). Upper:
Profile through Great Barrier Reef, drawn by R. Daly (1934). Lower: basic structure of a carbonate platform as expected for constant sea level
and slow sinking of the foundation (W.H.B., unpublished).
528 MARINE BIOGENIC SEDIMENTS