Patrick F. Dunn, Measurement, Data Analysis, and Sensor Fundamentals for Engineering and Science, 2nd Edition
Подождите немного. Документ загружается.


206 Measurement and Data Analysis for Engineering and Science
In other words, getting a χ
2
value of 30.16 with a batch sample of 10 instead of 20
gives us even more assurance that the criterion is a good one.
6.6.3 Comparing Observed and Expected Distributions
In some situations, a sample distribution should be compared with an ex-
pected distribution to determine whether or not the expected distribution
actually governs the underlying process. When comparing two distributions
using a χ
2
analysis,
χ
2
≈
K
X
j=1
(O
j
− E
j
)
2
E
j
, (6.36)
with O
j
and E
j
the number of observed and expected occurrences in the j -th
bin, respectively. The expected occurrence for the j -th bin is the product of
the total number of occurrences, N , and the probability of occurrence, P
j
.
The probability of occurrence is the difference of the probability distribution
function’s values at the j -th bin’s two end points. It also can be approxi-
mated by the product of the bin width and the probability density function
value at the bin’s mid-point value. Equation 6.36 follows from Equation 6.31
by noting that σ
2
∼ ν ∼ E. Strictly speaking, this expression is an approx-
imation for χ
2
and is subject to the additional constraint that E
j
≥ 5 [7].
The number of degrees of freedom, ν, are given by ν = K −(L + n), where
K is the number of bins, preferably using Scott’s formula for equal-width
intervals that was described in Section 5.4. Here, n = 2 because two values
are needed to compute the expected probabilities from the assumed distri-
bution (one for the mean and one for the variance). There is an additional
constraint (L = 1), because the number of expected values must be deter-
mined. Thus, whenever χ
2
analysis of this type is performed, ν = K − 3.
From this type of analysis, agreement between observed and expected
distributions can be ascertained with a certain confidence. The percent
probability that the expected distribution is the correct one is specified
by α. By convention, when α < 0.05, the disagreement between the sample
and expected distributions is significant or the agreement is unlikely. When
α < 0.01, the disagreement between the sample and expected distributions
is highly significant or the agreement is highly unlikely.
Example Problem 6.6
Statement: Consider a study conducted by a professor who wishes to determine
whether or not the 300 undergraduate engineering students in his department are
normal with respect to their heights. He determines this by comparing the distribution
of their heights to that expected for a normally distributed student population. His
height data are presented in Table 6.6. Are their heights normal?

Statistics 207
Bin
Heights
Observed
Expected
number k
in bin
number, O
k
number, E
k
1
less than X − 1.5σ
19
20.1
2
between X − 1.5σ and X −σ
25
27.5
3
between X − σ and X −0.5σ
44
45.0
4
between X − 0.5σ and X
59
57.5
5
between X and X + 0.5σ
60
57.5
6
between X + 0.5σ and X + σ
45
45.0
7
between X + σ and X + 1.5σ
30
27.5
8
above X + 1.5σ
18
20.1
TABLE 6.6
Observed and expected heights
Solution: For this case, ν = 8 − 3 = 5, where K = 8 was determined using Scott’s
formula (actually, K = 7.7, which is rounded up). The expected values are calcu-
lated for each bin by noting that E
k
= N P
k
where N = 300. For example, for bin 2
where −1.5σ ≤ x ≤ −σ, P
k
= P r(−1.5σ ≤ x ≤ −σ) = P r(z
1
= −1.5) − P r(z
1
=
−1) = 0.4332 − 0.3413 (using Table 6.2) = 0.0919. So, the expected number in bin 2 is
(0.0919)(300) = 27.5. The results for every bin are shown in Table 6.6.
Substitution of these results into Equation 6.36 yields χ
2
= 0.904. For the values of
χ
2
α
= 0.904 and ν = 5, from Table 6.5, α ' 0.97. That is, the probability of obtaining
this χ
2
value or less is ∼97 %, under the assumption that the expected distribution is
correct. Thus, agreement with the assumed normal distribution is significant.
6.7 *Pooling Samples
In some situations it may be necessary to combine the data gathered from M
replicate experiments, each comprised of N measurands. The measurands
can be pooled to form one set of M N measurands [18].
For the j-th experiment
¯x
j
=
1
N
N
X
i=1
x
ij
and S
2
x
j
=
1
N − 1
N
X
i=1
(x
ij
− ¯x
j
)
2
. (6.37)
From these expressions the following expressions can be developed. The
mean of all ¯x
j
’s, called the pooled mean of x, {¯x}, the mean of the means,
then becomes
¯
¯x = {¯x} =
1
M
M
X
j=1
¯x
j
=
1
MN
M
X
j=1
N
X
i=1
x
ij
. (6.38)
208 Measurement and Data Analysis for Engineering and Science
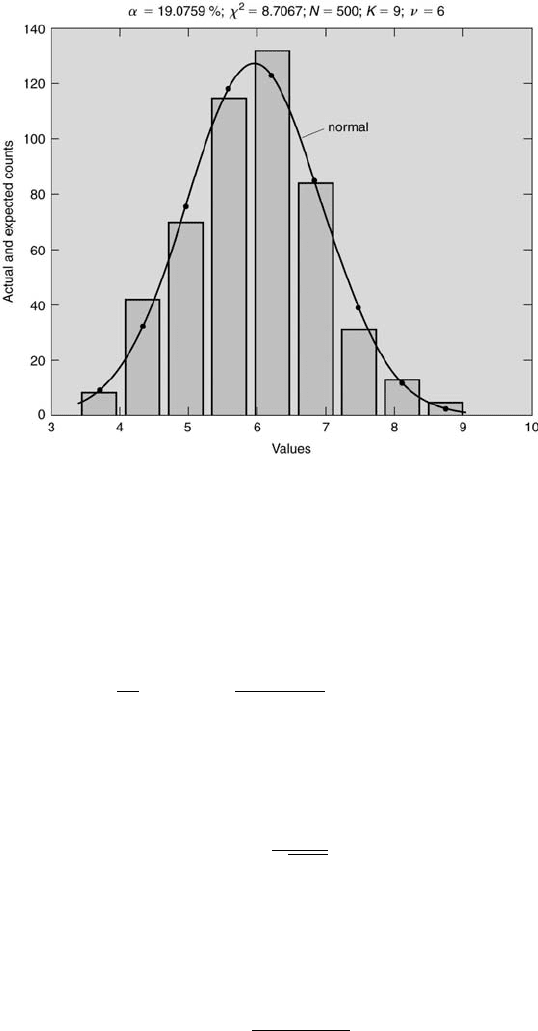
FIGURE 6.10
Analysis of 500 test scores using chinormchk.m.
The pooled variance of x, {S
2
x
}, is actually the average of the variances of
the M experiments where {S
2
x
} is treated as a random variable and is given
by
{S
2
x
} =
1
M
M
X
j=1
S
2
x
j
=
1
M(N − 1)
M
X
j=1
N
X
i=1
(x
ij
− ¯x
j
)
2
. (6.39)
The pooled standard deviation, {S
x
}, is the positive square root of the
pooled variance. The pooled standard deviation of the means, {S
¯x
},
is
{S
¯x
} =
{S
x
}
√
MN
. (6.40)
Now consider when the number of measurands varies in each experiment,
when N is not constant. There are N
j
measurands for the j-th experiment.
The resulting pooled statistical properties must be weighted by N
j
. The
pooled weighted mean, {¯x}
w
, is
{¯x}
w
=
P
M
j=1
N
j
¯x
j
P
M
j=1
N
j
. (6.41)

Statistics 209
accept H
0
reject H
0
H
0
true
correct (1-α)
type I error (α)
H
0
false
type II error (β)
correct (1-β)
TABLE 6.7
Null hypothesis decisions and their associated probabilities and errors.
The pooled weighted standard deviation, {S
x
}
w
, is
{S
x
}
w
=
r
ν
1
S
2
x
1
+ ν
2
S
2
x
2
+ ... + ν
M
S
2
x
M
ν
, (6.42)
where
ν =
M
X
j=1
ν
j
=
M
X
j=1
(N
j
− 1). (6.43)
The pooled weighted standard deviation of the means, {S
¯x
}
w
, is
{S
¯x
}
w
=
{S
x
}
w
h
P
M
j=1
N
j
i
1/2
. (6.44)
6.8 *Hypothesis Testing
Hypothesis testing [6] incorporates the tools of statistics into a decision-
making process. In the terminology of statistics, a null hypothesis is indi-
cated by H
0
and an alternative hypothesis by H
1
. The alternative hypothesis
is considered to be the complement of the null hypothesis. There is the possi-
bility that H
0
could be rejected, that is, considered false, when it is actually
true. This is called a Type I error. Conversely, H
0
could be accepted, that
is, considered true, when it is actually false. This is termed a Type II error.
Type II errors are of particular concern in engineering. Sound engineering
decisions should be based upon the assurance that Type II error is mini-
mal. For example, if H
0
states that a structure will not fail when its load
is less than a particular safety-limit load, then it is important to assess the
probability that the structure can fail below the safety-limit load. This can
be quantified by the power of the test, where the power is defined as 1 −
probability of Type II error. For a fixed level of significance (see Section
6.6), the power increases as the sample size increases. Large values of power
signify better precision. Null hypothesis decisions are summarized in Table
6.7.

210 Measurement and Data Analysis for Engineering and Science
Consider the rationale behind using statistical analysis to determine
whether or not the mean of a population, x
0
, will have a particular value,
x
o
. In an experiment, each measurand value will be subject to small, ran-
dom variations because of minor, uncontrolled variables. The null hypothesis
would be H
0
: x
0
= x
o
and the alternative hypothesis H
1
: x
0
6= x
o
. Because
the alternative hypothesis would be true if either x
0
< x
o
or x
0
> x
o
, the
appropriate hypothesis test would be a two-sided t-test. If the the null hy-
pothesis were either H
0
: x
0
≤ x
o
or H
0
: x
0
≥ x
o
, then the appropriate
hypothesis test would be a one-sided t-test. The modifier t implies that
Student’s t variable is used to assess the hypothesis. These tests implicitly
require that all measurand values are provided such that their sample mean
and sample standard deviation can be determined.
Decision of either hypothesis acceptance or rejection is made using Stu-
dent’s t distribution. For a one-sided t-test, if H
0
: x
0
≤ x
o
, then its associ-
ated probability, Pr[X ≤ t], must be determined. X represents the value of
a single sample that is drawn randomly from a t-distribution with ν = N −1
degrees of freedom. Likewise, if H
0
: x
0
≥ x
o
, then its associated probability,
Pr[X ≥ t] must be found. For a two-sided t-test, the sum of the probabilities
Pr[X ≤ t] and Pr[X ≥ t] must be determined. This sum equals 2Pr[X ≥ |t|]
because of the symmetry of Student’s t distribution. These probabilities are
determined through Student’s t value. For hypothesis testing, the particular
t value, termed the t-statistic, is based upon the sample standard deviation
of the means, where t = (¯x − x
o
)/(S
x
/
√
N).
A p-value, sometimes referred to as the observed level of significance, is
defined for the null hypothesis of a set of measurands as the probability of
obtaining the measurand set or a set having less agreement with the hypoth-
esis. The p-value is proportional to the plausibility of the null hypothesis.
The criteria for accepting or rejecting the null hypothesis are the following:
• p < 0.01 indicates non-credible H
0
, so reject H
0
and accept H
1
.
• 0.01 ≤ p ≤ 0.10 is inconclusive, so acquire more data.
• p > 0.10 indicates plausible H
0
, so accept H
0
and reject H
1
.
Sometimes, p = 0.05 is used as a decision value in order to avoid an in-
conclusive result, where p < 0.05 implies plausibility and p > 0.05 signifies
non-credibility. Keep in mind that only the plausibility, not the exact truth,
of a null hypothesis can be ascertained. Rejecting the null hypothesis of a
two-sided test means x
0
6= x
o
. Accepting the null hypothesis implies that x
o
is a plausible value of x
0
, but not necessarily that x
o
= x
0
. So, rejecting a
null hypothesis is more exact statistically than accepting a null hypothesis.
Rejecting the null hypothesis H
0
: x
0
≤ x
o
means x
0
≥ x
o
. Accepting the
null hypothesis indicates that, plausibly, x
0
≤ x
o
. Again, it is more exact
statistically to reject the null hypothesis or, conversely, to accept the alter-
native hypothesis. Hence, it is better to pose the null hypothesis such that
its alternative hypothesis most likely will be accepted.

Statistics 211
p-value
α = 0.01
α = 0.05
α = 0.10
p ≥ 0.10
accept
accept
accept
0.05 < p < 0.10
accept
accept
reject
0.01 < p < 0.05
accept
reject
reject
p < 0.01
reject
reject
reject
TABLE 6.8
Null hypothesis decisions and associated p and α values.
Stated differently, if x
0
is on the side of x
o
that favors the null hypothesis,
then the hypothesis should be accepted. If it is not, then the plausibility of
the hypothesis must be ascertained, based upon the aforementioned p-value
criteria. If the hypothesis test is one-sided, then x
0
≤ x
o
means t ≤ 0 and
p > 0.50, which indicates acceptance. Also, x
0
>> x
o
means t > 0 and
p ∼ 0, which implies rejection. Further, x
0
slightly greater than x
o
means t
is slightly greater than 0 and p is non-zero and finite, signifying plausibility.
If the hypothesis test is two-sided, the larger the value of |t|, the farther
away x
0
is from x
0
. The p-value is calculated with the probability that a
measurand set with x
0
= x
o
has a t-statistic with an absolute value greater
than |t|. Any measurand set with a t-statistic that is greater than |t| or
less than -|t| has less agreement with the null hypothesis. The acceptance or
rejection of the null hypothesis is based upon the the same aforementioned p-
value criteria. The following serves to illustrate how the p-values specifically
are determined for one-sided and two-sided hypothesis tests.
Consider the one-sided test where H
0
: x
0
≤ 10. For this example, ¯x =
12, S
x
= 3 and N = 20. Thus, the t-statistic value equals (12 − 10)/(3
√
20)
= 2.981. For ν = 19, the corresponding p-value equals 1 − Pr[t ≤ 2.981] = 1
− 0.9962 = 0.0038. Thus, the null hypothesis is rejected and the alternative
hypothesis, that x
0
is greater than 10, is accepted.
Next examine the two-sided test where H
0
: x
0
= 10. Using the same
statistical parameters as in the previous example, where the t-statistic value
is 2.981, the p-value equals 2Pr[t ≥ |2.981|] = (2)(0.0038) = 0.0076. Here the
absolute value of the t-statistic, 2.981, is greater than the p-value, 0.0076. So,
the measurand set with x
0
= 10 has less agreement with the null hypothesis.
In fact, because p < 0.01, the null hypothesis is not credible.
More specificity about accepting or rejecting a null hypothesis can be
obtained by associating this decision with a level of significance, α. Here,
the null hypothesis is accepted if the p-value is larger than α and rejected
if the p-value is less than α. The level of significance is the probability of
a Type I error. The relationships between null hypothesis acceptance or
rejection and their associated p and α values are presented in Table 6.8.

212 Measurement and Data Analysis for Engineering and Science
Set A
Set B
Test no.
δ
A
(mm)
δ
B
(mm)
δ
A
− δ
B
(mm)
1
3.0806
2.9820
0.0986
2
3.0232
2.9902
0.0330
3
2.9010
3.0728
-0.1718
4
3.1340
2.9107
0.2233
5
3.0290
2.9775
0.0514
6
3.1479
2.9348
0.2131
7
3.1138
2.9881
0.1257
8
2.9316
3.2303
-0.2987
9
2.8708
2.9090
-0.0382
10
2.9927
2.7979
0.1948
TABLE 6.9
Boundary-layer thickness measurements.
Example Problem 6.7
Statement: A test is conducted to assess the reliability of a transducer designed
to indicate when the pressure in a vessel is 120 psi. The vessel pressure is recorded
each time the sensor gives an indication. The test is repeated 20 times, resulting in a
mean pressure at detection of 121 psi with a standard deviation of 3 psi. Determine
the reliability of the transducer based upon a 5 % level of significance.
Solution: It is best statistically to test the null hypothesis that the transducer’s
detection level is 120 psi. The alternative hypothesis would be that the detection level
is either less than or greater than 120 psi. This appropriate test is a two-sided t-test.
For this case, the value of the t-statistic is
t =
¯x − x
o
S
x
/
√
N
=
121 − 120
3/
√
20
= 1.491.
For ν = 19, the corresponding p-value equals 2P [|t| ≥ 1.491] = (2)(0.0762) = 0.1524.
According to Table 6.8, the null hypothesis is acceptable. Thus, the transducer can
be considered reliable. At this level of significance, the p-value would have to be less
than 0.05 before the null hypothesis could be rejected and the transducer considered
unreliable.
This type of analysis also can be employed to test the hypothesis that
two measurand sets with paired samples (each having the same number of
samples) come from the same population. This is illustrated by the following
problem.
Example Problem 6.8
Statement: Ten thermal boundary-layer thickness measurements were made at a
specific location along the length of a heat-exchanger plate. Ten other thickness mea-
surements were made after the surface of the heat-exchanger plate was modified to
improve its heat transfer. The results are shown in Table 6.9. Determine the percent

Statistics 213
confidence that the plate surface modification has no effect on the thermal boundary-
layer thickness.
Solution: Assume that the thicknesses follow a t-distribution. This implies that the
differences of the thicknesses for each set, δ
A−B
= δ
A
−δ
B
, also follow a t-distribution.
The mean and the standard deviation of the differences can be computed from the
sample data. They are 0.043 mm and 0.171 mm, respectively. Now if both samples come
from the same population (here, this would imply that the surface modification had
no detectable effect on the boundary-layer thickness), then the difference of their true
mean values must be zero. Thus, the problem can be rephrased as follows. What is the
confidence that a parameter with a mean value of 0.043 mm,
¯
δ, and a standard deviation
of 0.171 mm, S
¯
δ
, determined from 10 samples, actually comes from a population whose
mean value is zero?
This involves a two-sided hypothesis test. The null hypothesis is that the mean
value of the differences is zero (that the surface modification has no detectable effect)
and the alternative hypothesis is that the mean value of the differences is not zero (that
the surface modification has a detectable effect). The t-statistic value for this case is
t =
√
N(
¯
δ − 0)
S
¯
δ
=
√
10(0.043)
0.171
= 0.795.
For ν = 9, the p-value equals 2P [t ≥ |0.795|] = (2)(0.2235) = 0.4470. Thus, there is
approximately a 45 % chance that the surface modification has a detectable effect and
a 55 % chance that it does not. So the present experiment gives an ambiguous result.
If the mean of the thickness difference was smaller, say 0.020 mm, given everything
else the same, then the p-value would be 0.7200, based upon t = 0.37. Now there
is more confidence in the hypothesis that the surface modification has no detectable
effect. However, this still is not significant enough. In fact, to have 95 % confidence
in the hypothesis, the mean of the thickness difference would have to be 0.004 mm,
given everything else is the same. This type of analysis can be extended further to
experiments involving unpaired samples with or without equal variances [6].
6.9 *Design of Experiments
Statistical tools can be used in experimental planning. The method of de-
sign of experiments (DOE) provides an assessment of an experiment’s
output sensitivity to its independent variables. In DOE terminology, this
method assesses the sensitivity of the result (the measurand or dependent
variable) to various factors (independent variables) that comprise the pro-
cess (experiment). The significance of DOE is that it can be carried out
before an experiment is conducted. DOE, for example, can be used to iden-
tify the variables that most significantly affect the output. In essence, DOE
provides an efficient way to plan and conduct experiments.
Methods of DOE have been known for many years. According to Hald
[14], fundamental work on DOE was carried out by R. A. Fisher and pub-
lished in 1935 [8]. DOE, and the related topic, Taguchi methods, have be-
come popular in recent years because of the quest through experimentation
for improved quality in consumer and industrial products (for example, see

214 Measurement and Data Analysis for Engineering and Science
low
high
A(mm)
5
10
B(ms)
20
50
TABLE 6.10
Factors and their levels for the detector experiment.
[10], [11], and [12]). These methods also can be applied to forensic science
[13].
The main objective of DOE is to determine how the factors influence
the result of a process. The approach is to determine this by running tri-
als (actual and/or computer trials), and measuring the process response
for planned, controlled changes in the factors. A feature of DOE is that it
provides a ranking of the sensitivity of the result to each factor; it ranks
the factors in terms of their effects. It provides the direction of the sensi-
tivity, whether a factor change increases or decreases the result. A major
and important feature of DOE is that it provides this information with a
minimum number of measurements or calculations. An additional advantage
of DOE is that knowledge of the statistical nature of the input is unnec-
essary. If statistical information is available, DOE can lead directly to an
analysis of variance (ANOVA) (for example, see [14]) and hypothesis tests
for the factors and their interactions. If the statistical nature of some or all
of the factors is unavailable, methods still exist to examine and rank the
sensitivity.
The basics of DOE can be illustrated readily. Consider a hypothetical
experiment with a result, y
j
, that depends on a number of factors desig-
nated by A, B, C, .... Trials of the experiment are conducted for different,
predetermined values of the factors, where the j -th run produces the j -th
value of the result. The primary function of DOE is to determine a quanti-
tative measure of the effect of each of the factor changes on the result. The
output must be quantitative or measurable. The factors can be quantitative.
They also can be attribute variables, such as hot or cold, fast or slow, and
so forth. In the coverage here, factors will be allowed to take on only two
values called a low level, indicated with a minus sign, and a high level, in-
dicated with a plus sign. The high and low levels of the factors are selected
by the experimenter to represent a practical range of values large enough to
have an influence, yet small enough to determine the local behavior of the
process. It is not uncommon to carry out one exploratory DOE to establish
ranges of variables, and then perform another DOE, based on the results
of the first, for a more refined analysis. In the case of attribute variables,
such as fast and slow, the choice of high and low can be purely arbitrary.
In the case of quantitative variables, the choice usually is intuitive, but it
still remains arbitrary because the signs of the results reverse if the levels
are reversed.

Statistics 215
A: low
A: high
B: low
40.9
47.8
B: high
42.4
50.2
TABLE 6.11
Percentage changes for four trials.
To illustrate the method of DOE, consider a hypothetical experiment
in which an experimentalist wishes to assess the sensitivity of a light-level
detector to two factors, the position of the detector from the surface of
an object (factor A) and the time response of the detector (factor B). The
percentage change in the amplitude of the detector’s output from a reference
amplitude is chosen as the result. Table 6.10 lists the factors and their levels.
Four trials are carried out. This provides a complete experiment, in which
all four possible combinations of factor type and level are considered. In one
trial, for example, the detector with the shortest time response, 20 ms (the
low value of B), is placed near the surface, at 5 mm (the low value of A). The
result for this case is an increase in the amplitude of 40.9 %, as displayed
in Table 6.11. Examination of all of the results reveals that the greatest
output is achieved by placing a 50-ms detector 10 mm from the surface of
the object. DOE can be extended readily to consider more than two factors.
To achieve a complete experiment, 2
k
trials are required, where k is the
number of factors, with two levels for each factor.
6.10 *Factorial Design
The method of DOE suggests a manner in which the contribution of each
factor on an experimental result can be assessed. This is the method of
factorial design. Because this method identifies the effect of each factor,
it can be used to organize and minimize the number of experimental trials.
When dealing with the effects of changes in two factors, two levels and
four runs, a measure of the effect, or main effect, ME, resulting from chang-
ing a factor from its low to high value can be estimated using the average
of the two observed changes in the response. So for factor A,
ME
A
=
1
2
[(y
2
− y
1
) + (y
4
− y
3
)] . (6.45)
Similarly, a measure of the effect of changing factor B from its low to high
level can be estimated by averaging two corresponding changes as
ME
B
=
1
2
[(y
3
− y
1
) + (y
4
− y
2
)] . (6.46)