Patrick F. Dunn, Measurement, Data Analysis, and Sensor Fundamentals for Engineering and Science, 2nd Edition
Подождите немного. Документ загружается.


246 Measurement and Data Analysis for Engineering and Science
This region remains attached to an airfoil upon decreasing its angle of
attack from the region of stall.
2. Linearity:
˜e
L
=
e
L,max
F SO
=
|y − y
L
|
max
F SO
. (7.29)
Linearity error is a measure of how linear is the best fit of the instru-
ment’s calibration data. It is defined in terms of its maximum deviation
distance, |y − y
L
|
max
.
3. Sensitivity:
˜e
K
=
e
K,max
F SO
=
|y − y
nom
|
max
F SO
. (7.30)
Sensitivity error is characterized by the greatest change in the slope
(static sensitivity) of the calibration fit.
4. Zero-shift:
˜e
Z
=
e
Z,max
F SO
=
|y
shift
− y
nom
|
max
F SO
. (7.31)
Zero-shift error refers to the greatest possible shift that can occur in the
intercept of the calibration fit.
5. Repeatability:
˜e
R
=
2S
x
F SO
. (7.32)
Repeatability error is related to the precision of the calibration. This is
determined by repeating the calibration many times for the same input
values. The quantity 2S
x
represents the precision interval of the data
for a particular value of x.
6. Stability:
˜e
S
=
e
S,max
· ∆t
F SO
. (7.33)
Stability error is related to e
S,max
, which is the greatest deviation in the
output value for a fixed input value that could occur during operation.
This deviation is expressed in units of F SO/∆t, with ∆t denoting the
time since instrument purchase or calibration. Stability error is a mea-
sure of how much the output can drift over a period of time for the same
input.
7. Thermal-drift:
˜e
T
=
e
T,max
F SO
. (7.34)
Thermal-drift error is characterized by the greatest deviation in the
output value for a fixed input value, e
T,max
, that could occur during
Uncertainty Analysis 247
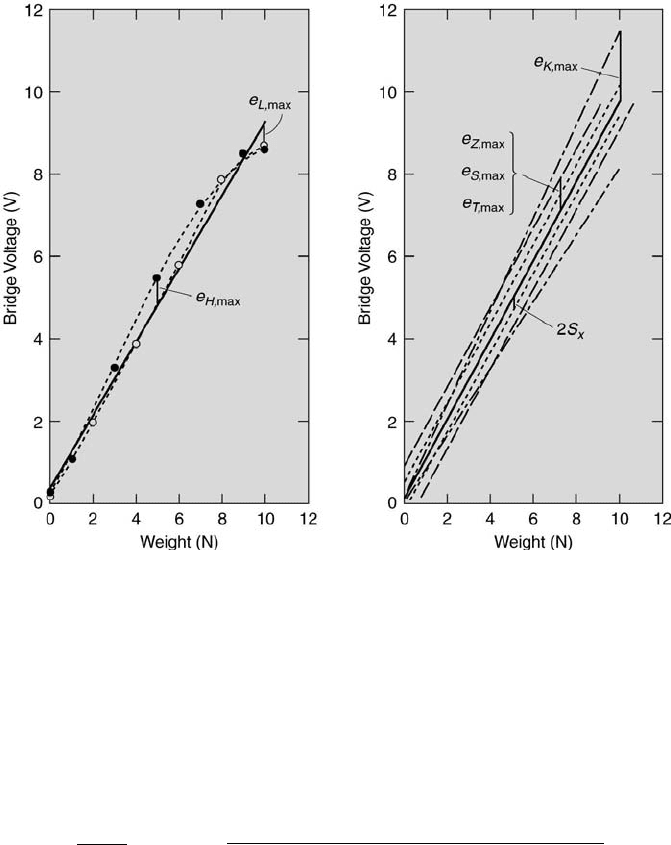
FIGURE 7.3
Elemental errors ascertained by calibration.
operation because of variations in the environmental temperature. Sta-
bility and thermal-drift errors are similar in behavior to the zero-shift
error.
The instrument uncertainty, u
I
, combines all the known instrument er-
rors,
u
I
=
q
X
e
2
i
= F SO·
q
˜e
2
H
+ ˜e
2
L
+ ˜e
2
K
+ ˜e
2
Z
+ ˜e
2
R
+ ˜e
2
S
+ ˜e
2
T
+ ˜e
2
other
, (7.35)
where ˜e
other
denotes any other instrument errors. All ˜e
i
’s expressed in Equa-
tion 7.35 are dimensionless.
How are these elemental errors actually assessed? Typically, hysteresis
and linearity errors are determined by performing a single up-scale, down-
scale calibration. The results of this type of calibration are displayed in the
left graph of Figure 7.3. In that graph, the up-scale results are plotted as
open circles and the down-scale results as solid circles. The dotted lines are
linear interpolations between the data. Hysteresis is evident in this example

248 Measurement and Data Analysis for Engineering and Science
by down-scale output values that are higher than their up-scale counterparts.
The best-fit curve of the data is indicated by a solid line. Both the hysteresis
and linearity errors are assessed with respect to the best-fit curve.
Sensitivity, repeatability, zero-shift, stability, and thermal-drift errors
are ascertained by performing a series of calibrations and then determining
each particular error by comparisons between the calibrations. The results
of a series of calibrations are shown in the right graph of Figure 7.3. The
solid curve represents the best-fit of the data from all the calibrations. The
dotted curves indicate the limits within which a calibration is repeatable
with 95 % confidence. The repeatability error is determined from the differ-
ence between either dotted curve and the best-fit curve. The dash-dot curves
identify the calibration curves that have the maximum and minimum slopes.
The sensitivity error is assessed in terms of the greatest difference between
minimum or maximum sensitivity curve and the best-fit curve. The dashed
curves denote shifts that can occur in the calibration because of zero-shift,
stability, and thermal-drift errors. Each error can have a different value and
is determined from the calibration curve having the greatest difference with
calibration data that occurs with each effect, with respect to the best-fit
curve.
The following two examples illustrate the effects of instrument errors on
measurement uncertainty.
Example Problem 7.5
Statement: A pressure transducer is connected to a digital panel meter. The panel
meter converts the pressure transducer’s output in volts back to pressure in psi. The
manufacturer provides the following information about the panel meter:
Resolution: 0.1 psi
Repeatability: 0.1 psi
Linearity: within 0.1 % of reading
Drift: less than 0.1 psi/6 months within the 32
◦
F to 90
◦
F range
The only information given about the pressure transducer is that it has “an accuracy
of within 0.5 % of its reading”.
Estimate the combined standard uncertainty in a measured pressure at a nominal
value of 100 psi at 70
◦
F. Assume that the transducer’s response is linear with an
output of 1 V for every psi of input.
Solution: The uncertainty in the measured pressure, (u
d
)
mp
, is the combination of
the uncertainties of the transducer, (u
d
)
t
, and the panel meter, (u
d
)
pm
. This can be
expressed as
(u
d
)
mp
=
q
[(u
d
)
t
]
2
+ [(u
d
)
pm
]
2
.
For the transducer,
(u
d
)
t
=
q
u
2
I
t
+ u
2
o
t
= u
I
t
= 0.005 × 100 psi = 0.50 psi.
For the panel meter,
(u
d
)
pm
=
q
u
2
I
pm
+ u
2
o
pm
.

Uncertainty Analysis 249
Now,
u
o
pm
= 0.5 resolution = 0.05 psi,
(7.36)
u
I
pm
=
q
e
2
1
+ e
2
2
+ e
2
3
,
where
e
1
(repeatability) = 0.1 psi
e
2
(linearity) = 0.1 % reading = 0.001 × 100V/(1V/psi) = 0.1 psi, and
e
3
(drift) = 0.1 psi/6 months × 6 months = 0.1 psi,
which implies that
u
I
pm
= 0.17 psi,
(u
d
)
pm
= 0.18 psi,
(u
d
)
mp
=
p
0.50
2
+ 0.18
2
= 0.53 psi.
Note that most of the combined standard uncertainty comes from the transducer. So,
to improve the accuracy of the measurement system, a more accurate transducer is
required.
Example Problem 7.6
Statement: An analog-to-digital (A/D) converter with the specifications listed be-
low (see Chapter 3 for terminology) is to be used in an environment in which the A/D
converter’s temperature may change by ±10
◦
C. Estimate the contributions of con-
version and quantization errors to the combined standard uncertainty in the digital
representation of an analog voltage by the converter.
E
F SR
0 V to 10 V
M 12 bits
Linearity ±3 bits/E
F SR
Temperature drift 1 bit/5
◦
C
Solution: The instrument uncertainty is the combination of uncertainty due to
quantization errors, e
Q
, and to conversion errors, e
c
,
(u
I
)
E
=
q
e
2
Q
+ e
2
I
.
The resolution of a 12-bit A/D converter with a full scale range of 0 V to 10 V is given
by (see Chapter 2)
Q =
E
F SR
2
12
=
10
4096
= 2.4 mV/bit.
The quantization error per bit is found to be
e
Q
= 0.5Q = 1.2 mV.
The conversion error is affected by two elements:

250 Measurement and Data Analysis for Engineering and Science
linearity error = e
1
= 3 bits× 2.4 mV/bit
= 7.2 mV.
temperature error = e
2
=
1bit
5
◦
C
× 10
◦
C × 2.4 mV/bit
= 4.8 mV.
Thus, an estimate of the conversion error is
e
I
=
q
e
2
1
+ e
2
2
=
q
(7.2 mV)
2
+ (4.8 mV)
2
= 8.6 mV.
The combined standard uncertainty in the digital representation of the analog value
due to the quantization and conversion errors becomes
(u
I
)
E
=
q
(1.2 mV)
2
+ (8.6 mV)
2
= 8.7 mV.
Here the conversion errors dominate the uncertainty. So, a higher resolution converter
is not necessary to reduce the uncertainty. A converter having smaller instrument errors
is required.
These two examples illustrate the process of design-stage uncertainty es-
timation. Once the components of the measurement system have been cho-
sen, uncertainty analysis can be extended to consider other types of errors
that can effect the measurement, such as temporal variations in the system’s
output under fixed conditions. This involves multiple measurements, which
are covered in Section 7.10.
7.9.2 Single-Measurement Result Experiment
The previous section considered estimating the uncertainties of a measurand.
But what about the uncertainty in a result? This uncertainty was introduced
beforehand and is given by Equation 7.21. From this equation, uncertainty
expressions can be developed for specific analytical relations [4]:
1. If r = Bx, where B is a constant, then
u
r
= |B|u
x
. (7.37)
If r is directly proportional to a measurand through a constant of pro-
portionality B, then the uncertainty in r is the product of the absolute
value of the proportionality constant and the measurand uncertainty.

Uncertainty Analysis 251
2. If r = x + ... + z − (u + ... + w), then
u
r
=
p
(u
x
)
2
+ ... + (u
z
)
2
+ (u
u
)
2
+ ... + (u
w
)
2
. (7.38)
If r is related directly to all of the measurands, then the uncertainty in
r is the combination in quadrature of the measurands’ uncertainties.
3. If r = (x...z)/(u...w), then
u
r
|r|
=
r
u
x
x
2
+ ... +
u
z
z
2
+
u
u
u
2
+ ... +
u
w
w
2
. (7.39)
The quantity u
r
/|r| is the fractional uncertainty of a result. If r
is related directly and/or inversely to all of the measurands, then the
fractional uncertainty in r is the combination in quadrature of the mea-
surands’ fractional uncertainties.
4. If r = x
n
, then
u
r
|r|
= |n|
u
x
|x|
. (7.40)
This equation follows directly from Equation 7.39.
Estimation of the uncertainty in a result is shown in the following ex-
ample.
Example Problem 7.7
Statement: The coefficient of restitution, e, of a ball can be determined by dropping
the ball from a known height, h
a
, onto a surface and then measuring its return height,
h
b
(as described in Chapter 11). For this experiment e =
p
h
b
/h
a
. If the uncertainty
in the height measurement, u
h
, is 1 mm, h
a
= 1.000 m and h
b
= 0.800 m, determine
the combined standard uncertainty in e.
Solution: Direct application of Equation 7.21 yields
u
e
=
s
∂e
∂h
b
u
h
b
2
+
∂e
∂h
a
u
h
a
2
.
Now,
∂e
∂h
b
=
1/h
a
2
√
h
b
/h
a
and
∂e
∂h
a
=
−h
b
/h
2
a
2
√
h
b
/h
a
. Substitution of the known values
into the above equation gives u
e
=
p
(5.59 × 10
−4
)
2
+ (4.47 × 10
−4
)
2
= 7.16 ×10
−4
=
0.0007.
Often there are experiments involving results that have angular depen-
dencies. The values of these results can vary significantly with angle because
of the presence of trigonometric functions in the denominators of their un-
certainty expressions. The following two problems illustrate this point.
Example Problem 7.8
Statement: A radar gun determines the speed of a directly oncoming automobile
within 4 %. However, if the gun is used off angle, another uncertainty arises. Determine
252 Measurement and Data Analysis for Engineering and Science
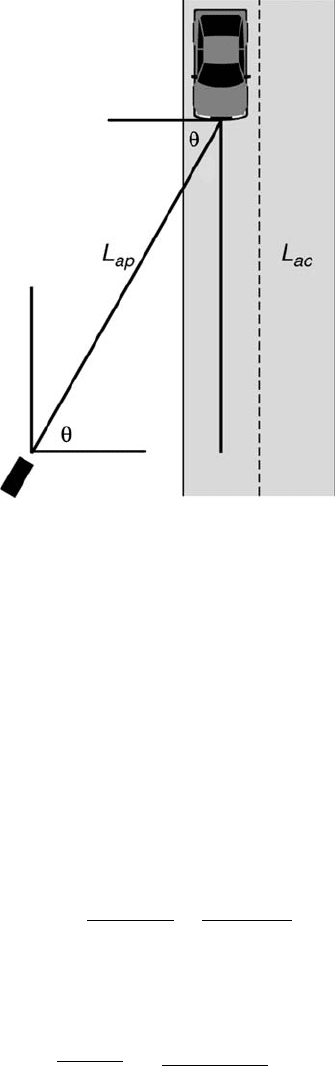
FIGURE 7.4
Radar detection of a car’s speed.
the gun’s off-angle uncertainty, u
oa
, as a function of the angle at which the car is viewed.
What is the combined uncertainty in the speed if the off-angle, θ
oa
, equals 70
◦
? Finally,
what is the overall uncertainty in the speed assuming 95 % confidence?
Solution: A schematic of this problem is shown in Figure 7.4. Assume that the
gun acquires a reading within a very short time period, ∆t. The actual speed, s
ac
, is
the ratio of the actual highway distance travelled, L
ac
, during the time period to ∆t.
Similarly, the apparent speed, s
ap
, equals L
ap
/∆t. From trigonometry,
L
ac
= L
ap
× sin(θ). (7.41)
Substitution of the speed definitions into this equation yields
s
ac
= s
ap
sin(θ). (7.42)
The off-angle uncertainty can be defined as
u
oa
=
| s
ac
− s
ap
|
s
ac
=
| sin(θ) − 1 |
sin(θ)
. (7.43)
Note that when θ = 90
◦
, sin(90
◦
) = 1, which yields u
oa
= 0. This is when the radar
gun is pointed directly along the highway at the car. When θ = 70
◦
, sin(70
◦
) = 0.940,
which yields u
oa
= (| 0.940 − 1 |)/0.940 = 0.064 or 6.4 %. This uncertainty must be
combined in quadrature with radar gun’s instrument uncertainty, u
I
= 0.04, to yield
the combined uncertainty, u
c
,
u
c
=
q
u
2
I
+ u
2
oa
=
p
0.04
2
+ 0.064
2
= 0.075. (7.44)
Uncertainty Analysis 253
FIGURE 7.5
A light refraction experiment based on Snell’s law.
So, the combined uncertainty is 7.5 % or almost twice the instrument uncertainty. This
uncertainty increases as the off-angle increases. Assuming 95 % confidence, the overall
uncertainty is approximately twice the combined uncertainty or 15 %. Thus, assuming
that the indicated speed is 70 mph, the actual speed could be as low as approximately
60 mph (70 − 0.15 × 70) or as high as approximately 80 mph (70 + 0.15 × 70).
Example Problem 7.9
Statement: This problem is adapted from one in [4]. An experiment is constructed
(see Figure 7.5) to determine the index of refraction of an unknown transparent glass.
Find the fractional uncertainty, ∆n/n, in the index of refraction, n, as determined
using Snell’s law, where n = sin θ
i
/ sin θ
r
. Assume that the measurements of the angles
are uncertain by ±1
◦
or 0.02 rad.
Solution: It follows that
∆n
n
=
s
∂ sin θ
i
sin θ
i
2
+
∂ sin θ
r
sin θ
r
2
.
Now,
∂ sin θ =
d sin θ
dθ
∂θ = |cos θ|∂θ (in rad).
So,
∂ sin θ
|sin θ|
= |cot θ|∂θ (in rad).
These considerations yield the following uncertainties:
θ
i
± 1
◦
θ
r
± 1
◦
sin θ
i
sin θ
r
n
∂ sin θ
i
| sin θ
i
|
∂ sin θ
r
| sin θ
r
|
∆n
n
20 13.0 0.342 0.225 1.52 5 % 8 % 9 %
40 23.5 0.643 0.399 1.61 2 % 4 % 5 %

254 Measurement and Data Analysis for Engineering and Science
Note that the percentage uncertainty in n decreases with increasing the angle of inci-
dence. In fact, as the angle of incidence approaches that of normal incidence (θ
i
= 0
◦
),
the uncertainty tends to infinity.
Many times, experimental uncertainty analysis involves a series of uncer-
tainty calculations that lead to the uncertainty of a desired result. In that
situation, usually it is best to perform the analysis in steps, identifying the
uncertainties in intermediate results. This not only helps to avoid mistakes
made in calculations but also aids in identifying the variables that contribute
significantly to the desired result’s uncertainty. The following two examples
illustrate this point.
Example Problem 7.10
Statement: Determine the combined standard uncertainty in the density of air,
assuming ρ = P/RT . Assume negligible uncertainty in R (R
air
= 287.04 J/kg·K). Let
T = 24
◦
C = 297 K and P = 760 mm Hg.
Solution: The uncertainty in the density of air (a result) becomes
u
ρ
=
s
∂ρ
∂T
u
T
2
+
∂ρ
∂P
u
P
2
=
s
−P
RT
2
u
T
2
+
1
RT
u
P
2
,
where
u
P
=
1
2
(1 mm Hg) =
1
2
1.01 × 10
5
Pa
760 mm Hg
× 1 mm Hg
=
1
2
(133 Pa) = 67 Pa,
and
u
T
= 0.5(1
◦
C) = 0.5(1 K) = 0.5 K.
Thus,
u
ρ
=
"
101325
(287.04)(297)
2
(0.5)
2
+
1
(287.04)(297)
(67)
2
#
1
2
= [4.00 × 10
−6
+ 0.62 × 10
−6
]
1
2
= 2.15 × 10
−3
kg/m
3
.
Finally,
ρ =
P
RT
=
101325
(287.04)(297)
= 1.19 kg/m
3
⇒
u
ρ
ρ
=
2.15 × 10
−3
1.19
= 0.19 %.
This is a typical value for the combined standard uncertainty in the density as de-
termined from pressure and temperature measurements in a contemporary laboratory.

Uncertainty Analysis 255
Example Problem 7.11
Statement: Consider an experiment in which the static pressure distribution around
the circumference of a cylinder in a cross flow in a wind tunnel is measured. Determine
the combined standard uncertainty in the pressure coefficient, C
p
, as defined by the
equation
C
p
≡
P − P
∞
1
2
ρV
2
∞
. (7.45)
Assume that the pressure difference P − P
∞
is measured as ∆p using an inclined
manometer with
u
∆p
= 0.06 in. H
2
O = 15 N/m
2
(∆P = 996 N/m
2
),
u
ρ
= 2.15 × 10
−3
kg/m
3
(ρ = 1.19 kg/m
3
), and
u
V
∞
= 0.31 m/s (V
∞
= 40.9 m/s).
Solution: Now, as is clear from Equation 7.45, the pressure coefficient is a result
and is a function of the density, the change in pressure, and the freestream velocity. In
short,
C
p
= f (∆p, ρ, V
∞
).
Therefore, applying Equation 7.21 yields
⇒ u
C
P
= [(
∂C
p
∂∆p
u
∆p
)
2
+ (
∂C
p
∂ρ
u
ρ
)
2
+ (
∂C
p
∂V
∞
u
V
∞
)
2
]
1
2
= [(
2
ρV
2
∞
u
∆p
)
2
+ (−
2∆p
ρ
2
V
2
∞
u
ρ
)
2
+ (−
4∆p
ρV
3
∞
u
V
∞
)
2
]
1
2
= [(
(2)(15)
(1.19)(40.9)
2
)
2
+ (
(2)(996)(2.15 × 10
−3
)
(1.19)
2
)(40.9)
2
)
2
+ (
(4)(996)(0.31)
(1.19)(40.9)
3
)
2
]
1
2
= [2.27 × 10
−4
+ 3.27 × 10
−6
+ 2.30 × 10
−4
]
1
2
= 0.021.
Alternatively, C
p
as the ratio of two transducer differential pressures,
C
p
≡
P − P
∞
1
2
ρV
2
∞
=
∆P
∆P
p−s
(∆p = 996 N/m
2
). (7.46)
Now, assume that u
∆p
= u
∆p
p−s
= 15 N/m
2
.
The equation for the uncertainty in C
p
when Equation 7.46 is used becomes
u
C
p
= [(
∂C
p
∂∆P
cyl
u
∆P
cyl
)
2
+ (
∂C
P
∂∆P
p−s
u
∆P
p−s
)
2
]
1
2
= [(
1
∆P
p−s
u
∆P
)
2
+ (−
∆P
cyl
∆P
2
p−s
u
∆P
p−s
)
2
]
1
2
= [2(
15
996
)
2
]
1
2
= 0.021.
The latter measurement approach is easier to determine C
p
than the former. When
designing an experimental procedure in which the pressure coefficient needs to be de-
termined, it is preferable to ratio the two transducer differential pressures.