Patrick F. Dunn, Measurement, Data Analysis, and Sensor Fundamentals for Engineering and Science, 2nd Edition
Подождите немного. Документ загружается.

316 Measurement and Data Analysis for Engineering and Science
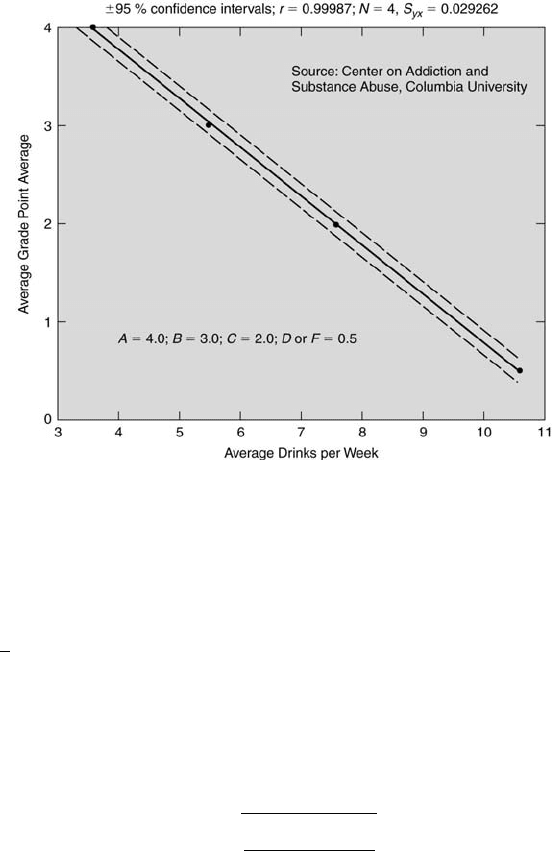
FIGURE 8.11
College student alcohol consumption.
When the correlation is perfect, there is no unexplained squared variation
(SSE = 0) and r = ±1. Further, when there is no fit, all the y
i
values
are the same because they are completely independent of x. That is, all
y
c
i
=
y and, by Equation 8.21, SSE = 0. Thus, r = 0. Values of |r| > 0.99
imply a very significant correlation; values of |r| > 0.95 imply a significant
correlation. On the other extreme, values of |r| < 0.05 imply an insignificant
correlation; values of |r| < 0.01 imply a very insignificant correlation.
Another expression for r can be obtained which relates it to the results of
a regression analysis fit. Substituting Equations 8.16 and 8.20 into Equation
8.42 yields
r =
v
u
u
t
P
N
i=1
(y
c
i
− ¯y)
2
P
N
i=1
(y
i
− ¯y)
2
. (8.43)
This equation relates r to the y
c
i
values obtained from regression analysis.
This is in contrast to Equation 8.40, which yields r directly from data. These
two equations help to underscore an important point. Correlation analysis
and regression analysis are separate and distinct statistical approaches. Each
is performed independently from the other. The results of a linear regression
analysis, however, can be used for correlation analysis.

Regression and Correlation 317
Caution should be exercised in interpreting various values of the linear
correlation coefficient. For example, a value of r ∼ 0 simply means that the
two variables are not linearly correlated. They could be highly correlated
nonlinearly. Further, a value of r ∼ ±1 implies that there is a strong linear
correlation. But the correlation could be casual, such as a correlation be-
tween the number of cars sold and pints of Guinness consumed in Ireland.
Both are related to Ireland’s population, but not directly to each other.
Also, even if the linear correlation coefficient value is close to unity, that
does not imply necessarily that the fit is the most appropriate. Although
the spring’s energy is related fundamentally to the square of its extension,
a linear correlation coefficient value of 0.979 results for Case 2 in section
8.9 when correlating a spring’s energy with its extension. This high value
implies a strong linear correlation between energy and extension, but it does
not imply that a linear relation is the most appropriate one.
Finally, when attempting to establish a correlation between two variables
it is important to recognize the possibility that two uncorrelated variables
can appear to be correlated simply by chance. This circumstance makes it
imperative to go one step more than simply calculating the value of r. One
must also determine the probability that N measurements of two uncorre-
lated variables will give a value of r equal to or larger than any particular
r
o
. This probability is determined by
P
N
(| r |≥| r
o
|) =
2Γ[(N − 1)/2]
√
πΓ[(N − 2)/2]
Z
1
|r
o
|
(1 − r
2
)
(N−4)/2
dr = f(N, r), (8.44)
where Γ denotes the gamma function. If P
N
(| r |≥| r
o
|) is small, then it is
unlikely that the variables are uncorrelated. That is, it is likely that they are
correlated. Thus, 1 − P
N
(| r |≥| r
o
|) is the probability that two variables
are correlated given | r |≥| r
o
|. If 1 − P
N
(| r |≥| r
o
|) > 0.95, then there
is a significant correlation, and if 1 − P
N
(| r |≥| r
o
|) > 0.99, then there
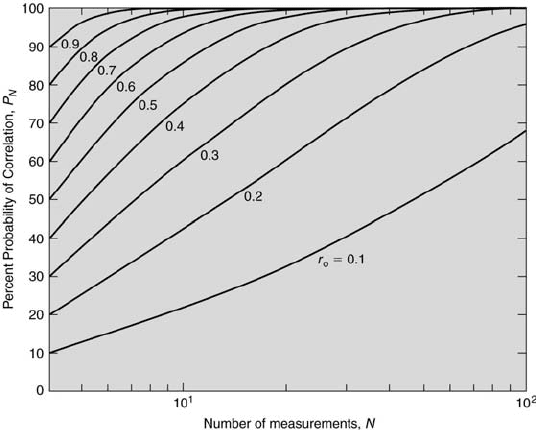
is a very significant correlation. Values of 1 − P
N
(| r |≥| r
o
|) versus the
number of measurements, N , are shown in Figure 8.12. For example, a value
of r
o
= 0.6 gives a 60 % chance of correlation for N = 4 and a 99.8 % chance
of correlation for N = 25. Thus, whenever citing a value of r it is imperative
to present the percent confidence of the correlation and the number of data
points upon which it is based. Reporting a value of r alone is ambiguous.
8.8 Uncertainty from Measurement Error
One of the major contributors to the differences between the measured and
calculated y values in a regression analysis is measurement error. This can
be understood best by examining the linear case.
318 Measurement and Data Analysis for Engineering and Science
FIGURE 8.12
Probability of correlation.
For an error-free experiment in which the data pairs [x
i
, y
i
] are linearly
related, the best-fit relation would be
y
0
i
= α + βx
0
i
, (8.45)
in which α and β are the true intercept and slope, respectively, and y
0
i
is the
true mean value of y
i
associated with the true mean value of x
i
, x
0
i
. For an
experiment in which measurement errors are present one can write
x
i
= x
0
i
+
x
(8.46)
and
y
i
= y
0
i
+
y
, (8.47)
where x
i
and y
i
denote the actual, measured values and
x
and
y
their
measurement errors. Here, it is assumed that the value of all of the x
i
errors
is the same and equal to
x
, and the value of all of the y
i
errors is the
same and equal to
y
. That is, the x
i
and y
i
errors are independent of
the particular data pair. This is true if each of the y
i
measurements results
from an independent measurement situation. Using Equations 8.46 and 8.47,
Equation 8.45 becomes
y
i
= α + βx
i
+ (
y
− β
x
) = y
c
i
+ E
y
. (8.48)

Regression and Correlation 319
The terms in parentheses represent the error term for y
i
, which is denoted
by E
y
. Thus, the value of y
c
i
will have an error of E
y
with respect to its
measured value, y
i
. This error results from possible measurement errors in
x and y or both.
This error is characterized best through its variance, σ
2
E
. A subtle yet
important point is that the variance of x
i
is the same as that of
x
and that
the variance of y
i
is the same as that of
y
. This is because both x
0
i
and y
0
i
have no error. Thus, the variance in x
i
is characterized by the variance in its
error. This also is true for y
i
. These variances are denoted by σ
2
x
and σ
2
y
. If
y
and β
x
are statistically independent, then the variance of the combined
errors, σ
E
y
, is given by [4]
σ
2
E
y
= σ
2
y
+ β
2
σ
2
x
. (8.49)
This equation is valid only when either
x
= 0 or x is controlled such that
its randomness is constrained. If either of these conditions are not met, then
σ
2
E
y
cannot be subdivided into these two components. Then, the individual
contributions of the
x
and
y
due to the difference between the measured
and calculated value of y cannot be ascertained.
So, measurement errors lead to variances in x and y. These variances
contribute to the combined variance, σ
E
y
. It is σ
E
y
that contributes to the
differences between the y
i
and y
c
i
values.
8.9 Determining the Appropriate Fit
Even determining the linear best fit for a set of data and its associated pre-
cision can be more involved than it appears. How to determine a linear best
fit of data already has been discussed. Here, implicitly it was assumed that
the measurement uncertainties in x were negligible with respect to those
in y and that the assumed mathematical expression was the most appro-
priate one to model the data. However, many common situations involving
regression usually are more complicated. Examine the various cases that can
occur when fitting data having uncertainty with a least-squares regression
analysis.
There are six cases to consider, as listed in Table 8.2. Each assumes a
level of measurement uncertainty in x, u
x
, and in y, u
y
, and whether or
not the order of the regression is correct. The term correct implies that the
underlying physical model that governs the relationship between x and y has
the same order as the fit. The last two cases (5 and 6), in which both x and
y have comparable uncertainties (u
x
∼ u
y
), are more difficult to analyze.
Often, only special situations of these two cases are considered [10]. Each of
the six cases is now discussed in more detail.

320 Measurement and Data Analysis for Engineering and Science
Case
u
x
u
y
Fit
1
0
0
correct
2
0
0
incorrect
3
0
6= 0
correct
4
0
6= 0
incorrect
5
6=0
6= 0
correct
6
6=0
6= 0
incorrect
TABLE 8.2
Cases involving uncertainties and the type of fit.
• Case 1: This corresponds to the ideal case in which there are no uncer-
tainties in x and y (u
x
= u
y
= 0) and the order of the fit is the same
as that of the underlying physical model (a correct fit). For example,
consider a vertically-oriented, linear spring with a weight, W, attached
to its end. The spring will extend downward from its unloaded equilib-
rium position a distance x proportional to W, as given by Hooke’s law,
W = −kx, where k is the spring constant and negative x corresponds
to positive displacement (extension). Assuming that the experiment is
performed without error, a first-order (linear) regression analysis would
yield a perfect fit of the data with an intercept equal to zero and a slope
equal to −k. Because there are no measurement errors in either x or y,
the values of the intercept and slope will be true values, even if the data
set is finite.
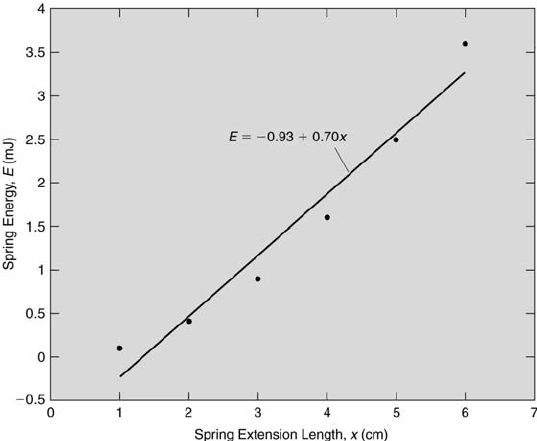
• Case 2: This case involves an error-free experiment in which the data
is fit with an incorrect order. For example, continuing with the spring-
weight example, the work done by the weight to extend the spring, W x,
could be plotted versus its displacement. This work equals the stored
energy of the spring, E, which equals 0.5kx
2
. A linear regression fit of
W x versus x would result in a fit that does not correspond to the correct
underlying physical model, as shown in Figure 8.13. A second-order fit
would be appropriate because E ∼ x
2
. The resulting differences between
the data and the linear fit come solely from the incorrect choice of the
fit. These differences, however, easily could be misinterpreted as the
result of errors in the experiment, as is the case for the data shown in
Figure 8.13. Obviously, it is important to have a good understanding
of the most appropriate order of the fit before the regression analysis is
performed.
• Case 3: For this case there is uncertainty in y but not in x and the
correct order of the fit is used. This is the type of situation encountered
when regression analysis first was considered. The resulting differences
between the measured and calculated y values result from the measure-
Regression and Correlation 321
FIGURE 8.13
Example of Case 2.
ment uncertainties in y. Consequently, a correct regression fit will agree
with the data to within its measurement uncertainty.
When the correct physical model is not known a priori, the standard
approach is to increase the order of the fit within reason until an accept-
able fit is obtained. What is acceptable is somewhat arbitrary. Ideally,
all data points inclusive of their uncertainties should agree with the fit
to within the confidence intervals specified by Equation 8.30. Although
an n-th order polynomial will fit n-1 data points exactly, this usually
does not correspond to a physically-realizable model. Very seldom does a
physical law involve more than a fourth power of a variable. In fact, high-
degree polynomial fits characteristically exhibit large excursions between
data points and have coefficients that require many significant figures
for repeatable accuracy [13]. So, caution should be exercised when using
higher-order fits. Whenever possible, the order of the fit should corre-
spond to the order of the physical model.
• Case 4: This case considers the situation in which there is uncertainty
in y but not in x and an incorrect order of the fit is used. Two un-
certainties in the calculated y values result in relation to the true fit.
One is from the measurement uncertainty in y and the other is from the
use of an incorrect model. Here it is difficult to determine directly the
contribution of each uncertainty to the overall uncertainty. A systematic
322 Measurement and Data Analysis for Engineering and Science
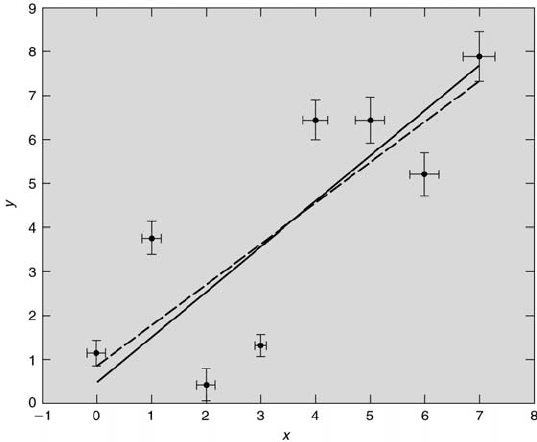
FIGURE 8.14
Two regression fits of the same data.
study involving either more accurate measurements of y or the use of a
different model would be necessary to determine this.
Finally, there are two other cases that arise in which there is uncertainty
in both x and y. The presence of both of these uncertainties leads to a best
fit that is different from that when there is only uncertainty in y. This is
illustrated in Figure 8.14 in which two regression fits are plotted for the same
data. The dashed line represents the fit that considers only the uncertainty
in y that was established using a linear least-squares regression analysis.
The solid line is the fit that considers uncertainty in both x and y that
was established using Deming’s method (see [9]), which is considered in the
following case. It is easy to see that when uncertainty is present in both x
and y, a fit established using the linear least-squares regression analysis that
does not consider the uncertainty in x will not yield the best fit.
Whenever u
x
∼ u
y
and no further constraints are placed on them, more
extensive regression techniques must be used to determine the best fit of
the data (for example, see [3]). This topic is beyond the scope of this text.
However, Mandel [10] has examined two special and practical situations
in which uncertainty is present in x and linear regression analysis can be
applied. These will now be examined.
• Case 5: The general situation for this case involves uncertainties in both
x and y and a correct order of the fit.

Regression and Correlation 323
For the first special situation in which the ratio of the variances of the
x and y errors, λ = σ
2
x
/σ
2
y
, is known a priori, a linear best-fit equation
can be determined using Deming’s method of minimizing the weighted
sum of squares of x and y. Further, estimates of the variances of the x
and y can be obtained.
The slope of the regression line calculated by this method is
b =
λS
yy
− S
xx
+
q
(S
xx
− λS
yy
)
2
+ 4λS
2
xy
2λS
xy
, (8.50)
and the intercept is given by the normal Equation 8.19.
The estimates for the variances of the x and y errors are, respectively,
e
S
2
x
= (
λ
1 + λb
2
)
S
yy
− 2bS
xy
+ b
2
S
xx
N − 2
(8.51)
and
e
S
2
y
= (
1
1 + λb
2
)
S
yy
− 2bS
xy
+ b
2
S
xx
N − 2
. (8.52)
Note that Equations 8.51 and 8.52 differ only by the factor λ. These
equations can be used to estimate the final uncertainties in x and y for
P percent confidence. These are the uncertainties in estimating x and y
from the fit (as opposed to the measurement uncertainties in x and y).
They are
u
x
final
= t
N−2,P
e
S
x
(8.53)
and
u
y
final
= t
N−2,P
e
S
y
. (8.54)
Using these equations, a regression fit can be plotted with data and its
error bars, as shown in Figure 8.15, in addition to determining values
of λ, u
x
final
and u
y
final
. These values are 0.25, ±4.0985, and ±2.0492,
respectively, for the data presented in the figure. The estimates for the
variances of x and y are
e
S
2
x
= 0.7014 and
e
S
2
y
= 2.8055. The estimates of
the final uncertainties in x and y appear relatively large at first sight.
This is the result of the relatively large scatter in the data. So, for a
specified value of x in this case, the value of y will be within ±4.0985
of its best-fit value 95 % of the time. Likewise, for a specified value of
y, the value of x will be within ±2.0492 of its best-fit value 95 % of the
time.
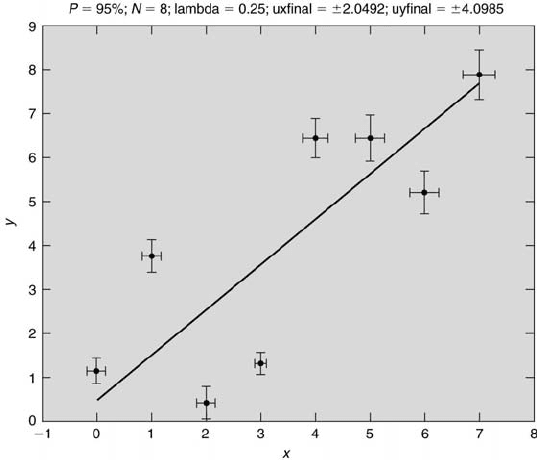
324 Measurement and Data Analysis for Engineering and Science
FIGURE 8.15
Example of Case 5 when λ is known.
The second special situation considers when x is a controlled variable.
This is known as the Berkson case, in which the value of x is set as close
as possible to its desired value, thereby constraining its randomness. This
corresponds, for example, to a static calibration in which there is some
uncertainty in x but the value of x is specified for each calibration point.
For this situation a standard linear least-squares regression fit of the
data is valid. Further, estimates can be made for all of the uncertainties
presented beforehand for Case 3. The interpretation of the uncertainties,
however, is somewhat different [10]. The uncertainty in y with respect
to the regression fit must be interpreted according to Equation 8.49.
• Case 6: This is the most complicated case in which there are uncertain-
ties in both x and y and an incorrect order of the fit is used. The same
analytical approaches can be taken here as were done for the special
situations in Case 5. However, the interpretation of the uncertainties is
confounded further as a result of the additional uncertainty introduced
by the incorrect order of the fit.

Regression and Correlation 325
8.10 *Signal Correlations in Time
Thus far, the application of correlation analysis to discrete information has
been considered. Correlation analysis also can be applied to information
that is continuous in time.
Consider two signals, x(t) and y(t), of two experimental variables. As-
sume that these signals are statistically stationary and ergodic. These terms
are defined in Chapter 9. For a stationary signal, the statistical properties
determined by ensemble averaging values for an arbitrary time from the be-
ginning of a number of the signal’s time history records are independent of
the time chosen. Further, if these average values are the same as those found
from the time-average over a single time history record, then the signal is
also ergodic. So, an ergodic signal is also a stationary signal. By examin-
ing how the amplitude of either signal’s time history record at some time
compares to its amplitude at another time, important information, such as
on the repeatability of the signal, can be gathered. This can be quantified
through the autocorrelation function of the signal, which literally correlates
the signal with itself (thus the prefix auto). The amplitudes of the signals
also can be compared to one another to examine the extent of their co-
relation. This is quantified through the cross-correlation function, in which
the cross product of the signals is examined.
8.10.1 *Autocorrelation
For an ergodic signal x(t), the autocorrelation function is the average value
of the product x(t) · x(t + τ), where τ is some time delay. Formally, the
autocorrelation function, R
x
(τ), is defined as
R
x
(τ) ≡ E[x(t) · x(t + τ)] = lim
T →∞
Z
T
0
x(t)x(t + τ )dt. (8.55)
Because the signal is stationary, R
x
(τ), its mean and its variance are inde-
pendent of time. So,
E[x(t)] = E[x(t + τ)] = x
0
(8.56)
and
σ
2
x(t)
= σ
2
x(t+τ)
= σ
2
x
= E[x
2
(t)] − x
02
. (8.57)
Analogous to Equation 8.33, the autocorrelation coefficient can be
defined as
ρ
xx
(τ) ≡
E[(x(t) − x
0
)(x(t + τ ) − x
0
)]
σ
2
x
. (8.58)