Patrick F. Dunn, Measurement, Data Analysis, and Sensor Fundamentals for Engineering and Science, 2nd Edition
Подождите немного. Документ загружается.

346 Measurement and Data Analysis for Engineering and Science
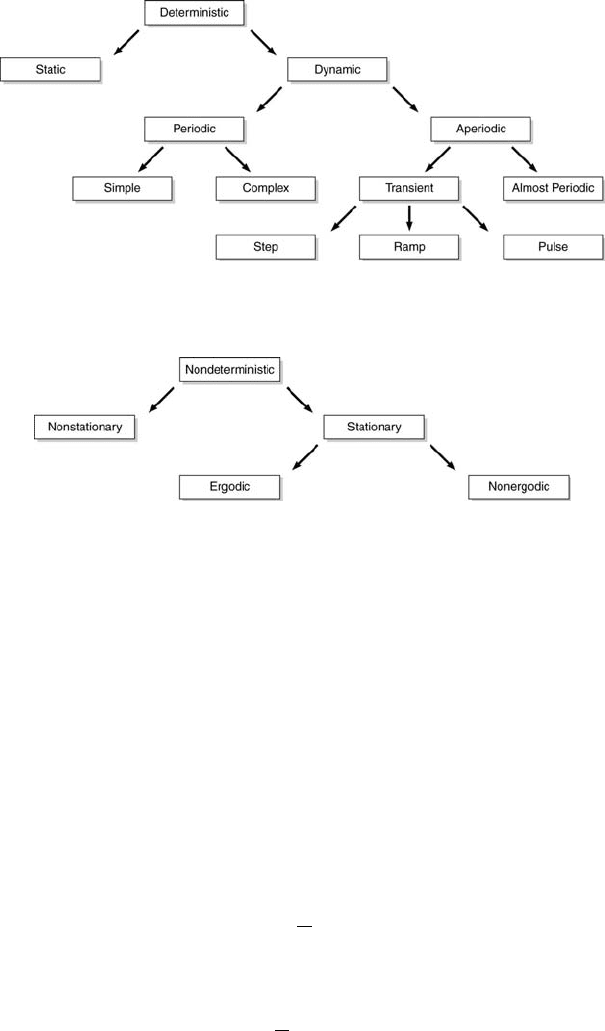
FIGURE 9.2
Deterministic signal subdivisions (adapted from [2]).
FIGURE 9.3
Nondeterministic signal subdivisions (adapted from [2]).
when only µ
x
(t
1
) = µ
x
and R
x
(t
1
, t
1
+ τ) = R
x
(τ), that is, when only the
signal’s ensemble mean and autocorrelation function are time invariant. In a
more restrictive sense, if all other ensemble higher-order moments and joint
moments (see Chapter 5 for more about moments) also are time invariant,
the signal is strongly stationary (stationary in the strict sense). So, the
term stationary means that each of a signal’s ensemble-averaged statistical
properties are constant with respect to t
1
. It does not mean that the am-
plitude of the signal is constant over time. In fact, a random signal is never
completely stationary in time!
For a single time history, the temporal mean value, µ
x
, and the temporal
autocorrelation coefficient, R
x
(τ), are
µ
x
= lim
T →∞
1
T
Z
T
0
x(t)dt (9.4)
and
R
x
(τ) = lim
T →∞
1
T
Z
T
0
x(t)x(t + τ )dt. (9.5)
For most stationary data, the ensemble averages at an arbitrary time, t
1
,
Signal Characteristics 347
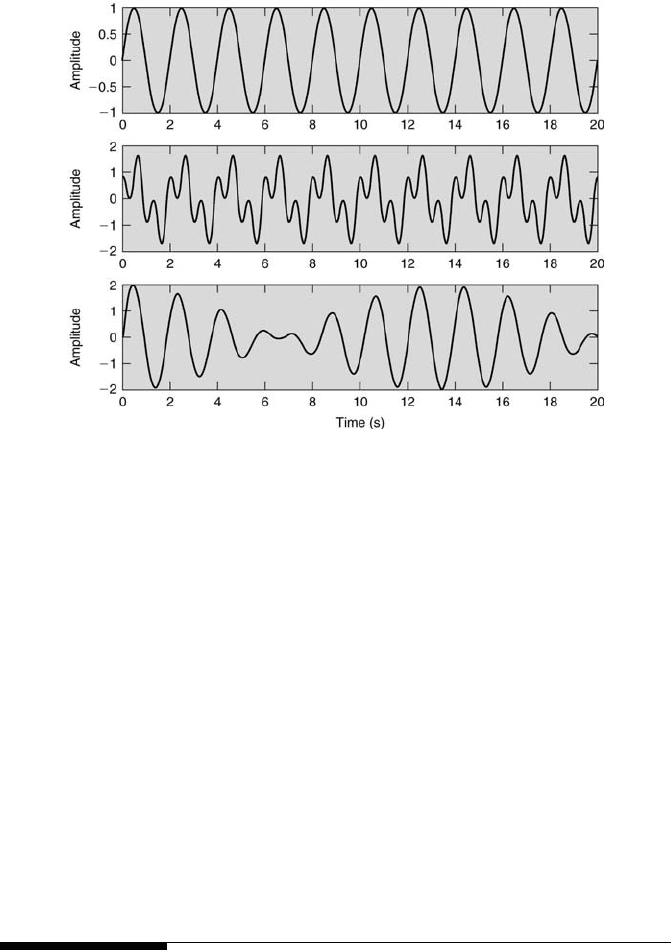
FIGURE 9.4
Various signals comprised of sines and cosines.
will equal their corresponding temporal averages computed for an arbitrary
single time history in the ensemble. When this is true, the signal is ergodic.
If the signal is periodic, then the limits in Equations 9.4 and 9.5 do not ex-
ist because averaging over one time period is sufficient. Ergodic signals are
important because all of their properties can be determined by perform-
ing time averages over a single time history record. This greatly simplifies
data acquisition and reduction. Most random signals representing stationary
physical phenomena are ergodic.
A finite record of data of an ergodic random process can be used in
conjunction with probabilistic methods to quantify the statistical properties
of an underlying process. For example, it can be used to determine a random
variable’s true mean value within a certain confidence limit. These methods
also can be applied to deterministic signals, which are considered next.
9.3 Signal Variables
Most waveforms can be written in terms of sums of sines and cosines, as will
be shown later in Section 9.5. Before examining more complex waveform
expressions, the variables involved in simple waveform expressions must be

348 Measurement and Data Analysis for Engineering and Science
defined. This can be done by examining the following expression for a simple,
periodic sine function,
y(t) = C sin(nωt + φ) = C sin(2πnft + φ), (9.6)
in which the argument of the sine is in units of radians. The variables and
their units (given in brackets) are as follows:
• C: amplitude [units of y(t)]
• n: number of cycles [dimensionless]
• ω: circular frequency [rad/s]
• f : cyclic frequency [cycles/s = Hz]
• t: time [s]
• T : period (= 2π/ω = 1/f) [s/cycle]
• φ: phase [rad] where φ = 2π(t/T ) = 2π(θ
◦
/360
◦
)
Also note that 2π rad = 1 cycle = 360
◦
and sin(ωt+π/2) = cos(ωt). The top
plot in Figure 9.4 displays the signal y(t) = sin(πt). Its period equals 2π/π
= 2 s, as seen in the plot. The above definitions can be applied readily to
determine the frequencies of a periodic signal, as in the following example.
Example Problem 9.1
Statement: Determine the circular and cyclic frequencies for the signal y(t) =
10 sin(628t).
Solution: Using the above definitions,
circular frequency, ω = 628 rad/s (assuming n = 1 cycle), and
cyclic frequency, f = ω/2π = 628/2π = 100 cycles/s= 100 Hz.
When various sine and cosine waveforms are combined by addition, more
complex waveforms result. Such waveforms occur in many practical situ-
ations. For example, the differential equations describing the behavior of
many systems have sine and cosine solutions of the form
y(t) = A cos(ωt) + B sin(ωt). (9.7)
By introducing the phase angle, φ, y(t) can be expressed as either a cosine
function,
y(t) = C cos(ωt − φ), (9.8)

Signal Characteristics 349
or a sine function,
y(t) = C sin(ωt − φ + π/2) = C sin(ωt + φ
∗
), (9.9)
where C, φ, and φ
∗
are given by
C =
p
A
2
+ B
2
, (9.10)
φ = tan
−1
(B/A), (9.11)
and
φ
∗
= tan
−1
(A/B), (9.12)
noting that φ
∗
= (π/2) − φ. Reducing the waveform in Equation 9.7 to
either Equation 9.8 or Equation 9.9 often is useful in interpreting results.
The middle plot in Figure 9.4 shows the signal y(t) = sin(πt) + 0.8 cos(3πt).
This signal is complex and has two frequencies, ω
1
= π and ω
2
= 3π rad/s.
This leads to two periods, T
1
= 2 s and T
2
= 2/3 s. Because T
1
= 3T
2
, the
period T
1
will contain one cycle of sin(ω
1
t) and three periods of 0.8 cos(ω
2
t).
So, T
2
= 2 s is the fundamental period of this complex signal. In general, the
fundamental period of a complex signal will be the least common multiple
of the contributory periods.
An interesting situation arises when two waves of equal amplitude and
nearly equal frequencies are added. The resulting wave exhibits a relatively
slow beat with a frequency called the beat frequency. In general, the sum
of two sine waves of frequencies, f and f + ∆f, combines trigonometrically
to yield a signal whose amplitude is modulated as the cos(∆f /2). The fre-
quency ∆f/2 is defined conventionally as the beat frequency. An example of
the resultant beating for the signal y(t) = sin(πt) + sin(1.15πt) is displayed
in the bottom plot of Figure 9.4. As can be seen, the signal repeats itself ev-
ery 13.33 s. This corresponds to a cyclic frequency of 0.075 Hz, which equals
∆f/2 (0.15/2). The phenomenon of producing a signal (wave) having a new
frequency from the mixing of two signals (waves) is called heterodyning
and is used in tuning musical instruments and in laser-Doppler velocimeters.
9.4 Signal Statistical Parameters
Signals can be either continuous in time or discrete. Discrete signals usually
arise from the digitization of a continuous signal, to be discussed in Chap-
ter 10, and from sample-to-sample experiments, which were considered in
Chapter 7. A large number of statistical parameters can be determined from
either continuous or discrete signal information. The parameters most fre-
quently of interest are the signal’s mean, variance, standard deviation, and
rms. For continuous signals, these parameters are computed from integrals

350 Measurement and Data Analysis for Engineering and Science
Quantity
Continuous
Discrete
Mean
¯x =
1
T
R
T
0
x(t)dt
¯x =
1
N
P
N
i=1
x
i
Variance
S
2
x
=
1
T
R
T
0
[x(t) − ¯x]
2
dt
S
2
x
=
1
N−1
P
N
i=1
[x
i
− ¯x]
2
Standard
S
x
=
q
1
T
R
T
0
[x(t) − ¯x]
2
dt
S
x
=
q
1
N−1
P
N
i=1
[x
i
− ¯x]
2
Deviation
rms
x
rms
=
q
1
T
R
T
0
x(t)
2
dt
x
rms
=
q
1
N
P
N
i=1
x
2
i
TABLE 9.1
Statistical parameters for continuous and discrete signals.
of the signal over time. For discrete signals, these parameters are deter-
mined from summations over the number of samples. The expressions for
these properties are presented in Table 9.1. Note that as T → ∞ or N → ∞,
the statistical parameter values approach the true values of the underlying
process.
The choice of a time period that is used to determine the statistical pa-
rameters of a signal, called the signal sample period, depends upon the
type of waveform. When the waveform is periodic, either simple or complex,
the signal sample period should be the fundamental period. When the wave-
form is almost periodic or nondeterministic, no single signal sample period
will produce exact results. For this situation, it is best to keep increasing
the signal’s sample period until the statistical parameter values of interest
become constant to within acceptable limits.
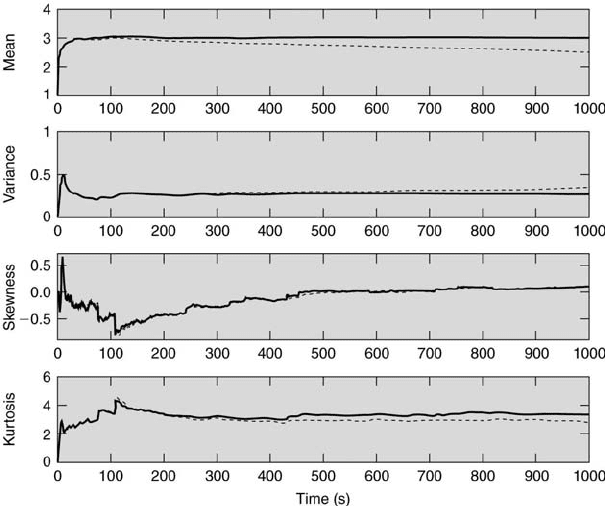
Determining an appropriate sample period is not always straightforward.
The values of the running mean, variance, skewness, and kurtosis of two data
samples are shown in Figure 9.5. The adjective running implies that the
value of a statistical moment is averaged over the time period from an initial
time to each time of interest. The first sample, indicated by solid curves,
was drawn randomly from a normal population having a mean value of 3.0
and a standard deviation of 0.5. The second sample, indicated by dotted
curves, was the same as the first but with an additional amplitude decrease
in time equal to 0.001/s. The mean of the first sample reaches its final value
at approximately 100 s. The mean of the second sample exhibits a decrease
in time, which is linear after approximately 100 s. The variance, skewness,
Signal Characteristics 351
FIGURE 9.5
Statistical properties versus sample time.
and kurtosis values of both samples vary with respect to sample time and
between samples during most of the entire sample time. The variances of the
two samples agree up to approximately 300 s. Then, they deviate from one
another because of the second sample’s mean value decrease in time. This
example illustrates the complexity in determining an appropriate sample
time, especially if the signal being sampled has a gradual change in time
over the sample period in addition to short-time fluctuations.
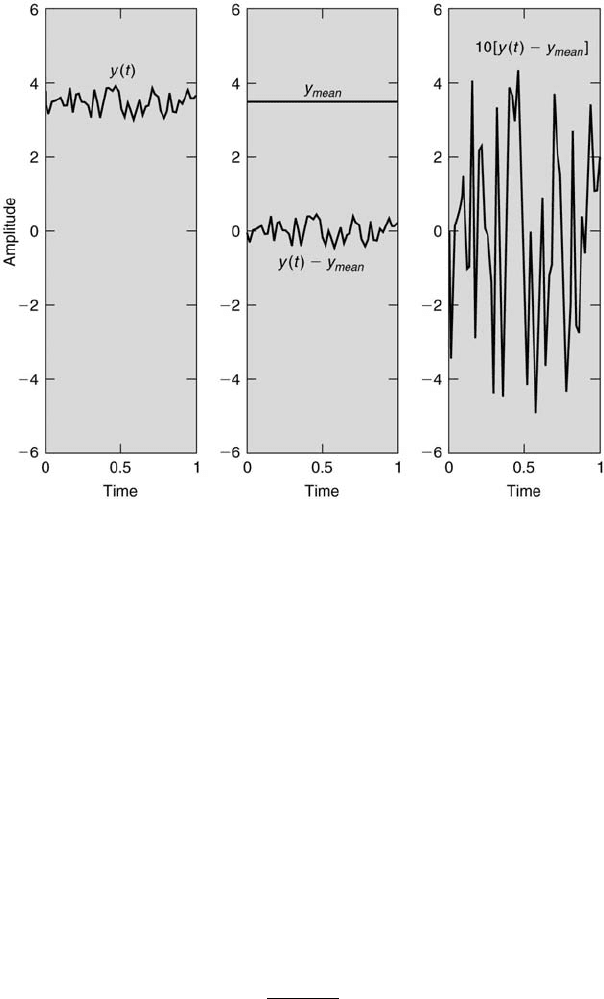
Sometimes it is important to examine the fluctuating component of a
signal. The average value of a signal (its DC component) can be subtracted
from the original signal to reveal more clearly the signal’s fluctuating be-
havior (its AC component). This is shown in Figure 9.6, in which the left
plot is the complete signal (DC plus AC components), the middle plot is
the DC component and the AC component, each shown separately, and the
right plot is the AC component amplified 10 times.
The concepts of the mean, variance, and standard deviation were pre-
sented in Chapter 5. The root mean square (rms) is another important
statistical parameter. It is defined as the positive square root of the mean of
the squares. Its continuous and discrete representations are presented in Ta-
ble 9.1. The rms characterizes the dynamic portion (AC component) of the
352 Measurement and Data Analysis for Engineering and Science
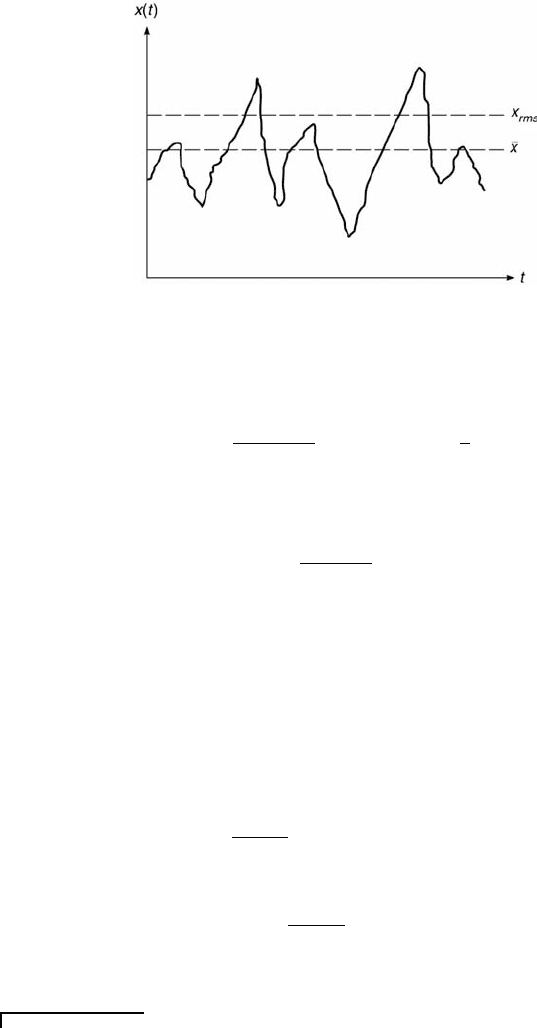
FIGURE 9.6
Subtraction of the mean value from a signal.
signal and the mean characterizes its static portion (DC component). The
magnitudes of these components for a typical signal are shown in Figure 9.7.
When no fluctuation is present in the signal, x(t) is constant and equal to
its mean value, ¯x. So, x
rms
≥ ¯x always. x
2
rms
is the temporal average of the
square of the amplitude of x.
The following two applications of the rms concept show its utility:
1. The total energy dissipated over a period of time by a resistor in a circuit
is
E
T
=
Z
t
2
t
1
P (t)dt = R
Z
t
2
t
1
[I(t)]
2
dt = R(t
2
− t
1
)I
2
rms
, (9.13)
where
I
2
rms
=
1
(t
2
− t
1
)
Z
t
2
t
1
[I(t)]
2
dt. (9.14)
2. The temporal-averaged kinetic energy per unit volume in a fluid at a
point in a flow is
Signal Characteristics 353
FIGURE 9.7
A signal showing its mean and rms values.
¯
E =
ρ
2(t
2
− t
1
)
Z
t
2
t
1
[U(t)]
2
dt =
1
2
ρU
2
rms
, (9.15)
where
U
2
rms
=
1
(t
2
− t
1
)
Z
t
2
t
1
[U(t)]
2
dt. (9.16)
Sometimes, the term rms refers to the rms of the fluctuating component
of the signal and not to the rms of the signal itself. For example, the fluc-
tuating component of a fluid velocity, u(t), can be written as the difference
between a total velocity, U(t), and a mean velocity,
¯
U(t), as
u(t) = U (t) −
¯
U(t). (9.17)
So, the rms of the fluctuating component is
u
rms
=
1
t
2
− t
1
Z
t
2
t
1
{U(t) −
¯
U(t)}
2
dt
1/2
, (9.18)
where
¯
U(t) =
1
t
2
− t
1
Z
t
2
t
1
U(t)dt. (9.19)
By comparing Equations 9.16 and 9.18, it is evident that U
rms
6= u
rms
.
Example Problem 9.2
Statement: Determine the rms of the ramp function y(t) = A(t/T ) in which A is
the amplitude and T is the period.

354 Measurement and Data Analysis for Engineering and Science
Solution: Because y(t) is a deterministic periodic function, the rms needs to be
computed for only one period, from t = 0 to t = T . Application of the rms equation
from Table 9.1 for y(t), which is a continuous signal, yields
y
rms
= [
A
2
T
2
(t
2
− t
1
)
Z
t
2
t
1
t
2
dt]
1/2
=
A
2
(t
3
2
− t
3
1
)
3T
2
(t
2
− t
1
)
.
For t
1
= 0 and t
2
= T , the rms becomes
y
rms
=
A
√
3
.
What is ¯y(t)? (Answer: A/2) What is the rms of a sine wave of amplitude A? (Answer:
A/
√
2)
9.5 Fourier Series of a Periodic Signal
Before considering the Fourier series, the definition of orthogonality must
be examined. The inner product (dot product), (x, y), of two real-valued
functions x(t) and y(t) over the interval a ≤ t ≤ b is defined as
(x, y) =
Z
b
a
x(t)y(t)dt. (9.20)
If (x, y) = 0 over that interval, then the functions x and y are orthogonal
in the interval. If each distinct pair of functions in a set of functions is
orthogonal, then the set of functions is mutually orthogonal.
For example, the set of functions sin(2πmt/T ) and cos(2πmt/T ), m =
1, 2, ..., form one distinct pair and are mutually orthogonal because
Z
T/2
−T/2
sin(2πmt/T ) cos(2πnt/T )dt = 0 for all m, n. (9.21)
Also, these functions satisfy the other orthogonality relations
y(t) =
Z
T/2
−T/2
cos(2πmt/T ) cos(2πnt/T )dt =
0 m 6= n
T m = n
(9.22)
and
y(t) =
Z
T/2
−T/2
sin(2πmt/T ) sin(2πnt/T )dt =
0 m 6= n
T m = n.
(9.23)
Knowing these facts is useful when performing certain integrals, such as
those that occur when determining the Fourier coefficients.

Signal Characteristics 355
Fourier analysis and synthesis, named after Jean-Baptiste-Joseph Fourier
(1768-1830), a French mathematician, now can be examined. Fourier showed
that the temperature distribution through a body could be represented by
a series of harmonically related sinusoids. The mathematical theory for this,
however, actually was developed by others [3]. Fourier methods allow com-
plex signals to be approximated in terms of a series of sines and cosines.
This is called the trigonometric Fourier series. The Fourier trigonometric
series that represents a signal of period T can be expressed as
y(t) =
A
0
2
+
∞
X
n=1
A
n
cos
2πnt
T
+ B
n
sin
2πnt
T
, (9.24)
where
A
0
=
2
T
Z
T/2
−T/2
y(t)dt, (9.25)
A
n
=
2
T
Z
T/2
−T/2
y(t) cos
2πnt
T
dt n = 1, 2, ..., (9.26)
and
B
n
=
2
T
Z
T/2
−T/2
y(t) sin
2πnt
T
dt n = 1, 2, ... . (9.27)
The frequencies associated with the sines and cosines are integer multi-
ples (n-th harmonics) of the fundamental frequency. The fundamental
or primary frequency, the first harmonic, is denoted by n = 1, the sec-
ond harmonic by n = 2, the third harmonic by n = 3, and so on. A
0
is
twice the average of y(t) over one period. A
n
and B
n
are called the Fourier
coefficients of the Fourier amplitudes. The expression for A
n
can be deter-
mined by multiplying both sides of the original series expression for y(t) by
cos(2πnt/T ), then integrating over one period from t = −T /2 to t = T/2.
The expression for B
n
is found similarly, but instead, by multiplying by
sin(2πnt/T ). This is called Fourier’s trick.
The procedure by which the Fourier amplitudes for any specified y(t) are
found is called Fourier analysis. Fourier analysis is the analog of a prism
that separates white light (a complex signal) into colors (simple periodic
sine functions). Fourier synthesis is the reverse procedure by which y(t)
is constructed from a series of appropriately weighted sines and cosines. The
Fourier synthesis of a signal is useful because the amplitude and frequency
components of the signal can be identified.
A Fourier series representation of y(t) exists if y(t) satisfies the following
Dirichlet conditions:
1. y(t) has a finite number of discontinuities within the period T (it is
piece-wise differentiable).