Short T.A. Electric Power Distribution Handbook
Подождите немного. Документ загружается.

Reliability
447
mission-caused interruptions). Both are done for the same reasons as storm
exclusions: neither scheduled interruptions nor transmission-caused inter-
ruptions reflect the normal operating performance of the distribution system.
The IEEE working group appears to favor a statistical approach to classi-
fying major events (Christie, 2002). An argument against this approach is
that major substation or transmission outages can be “major events” and get
excluded from indices. From the customer point of view, major event or no
major event, an interruption is still a loss of production or a spoiled inventory
or a loss of productivity or a missed football game. For this reason, some
regulators hesitate to allow exclusions.
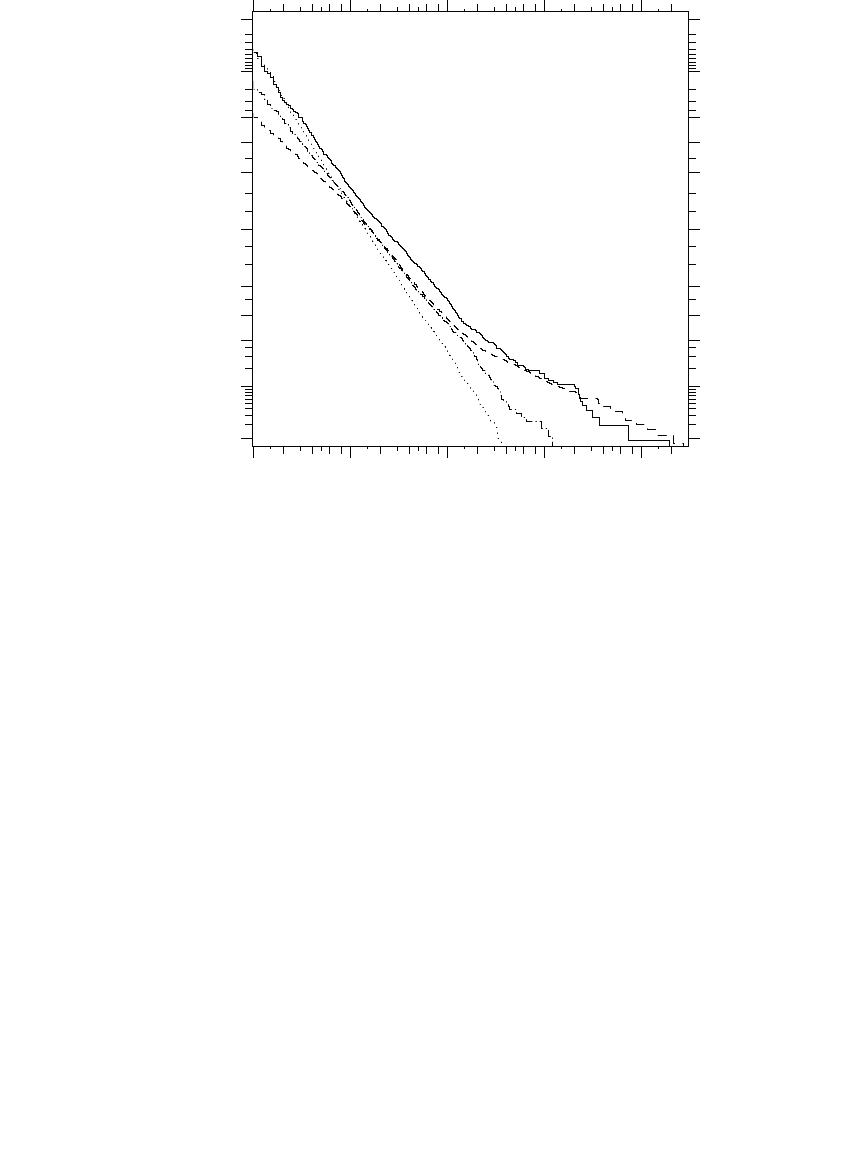
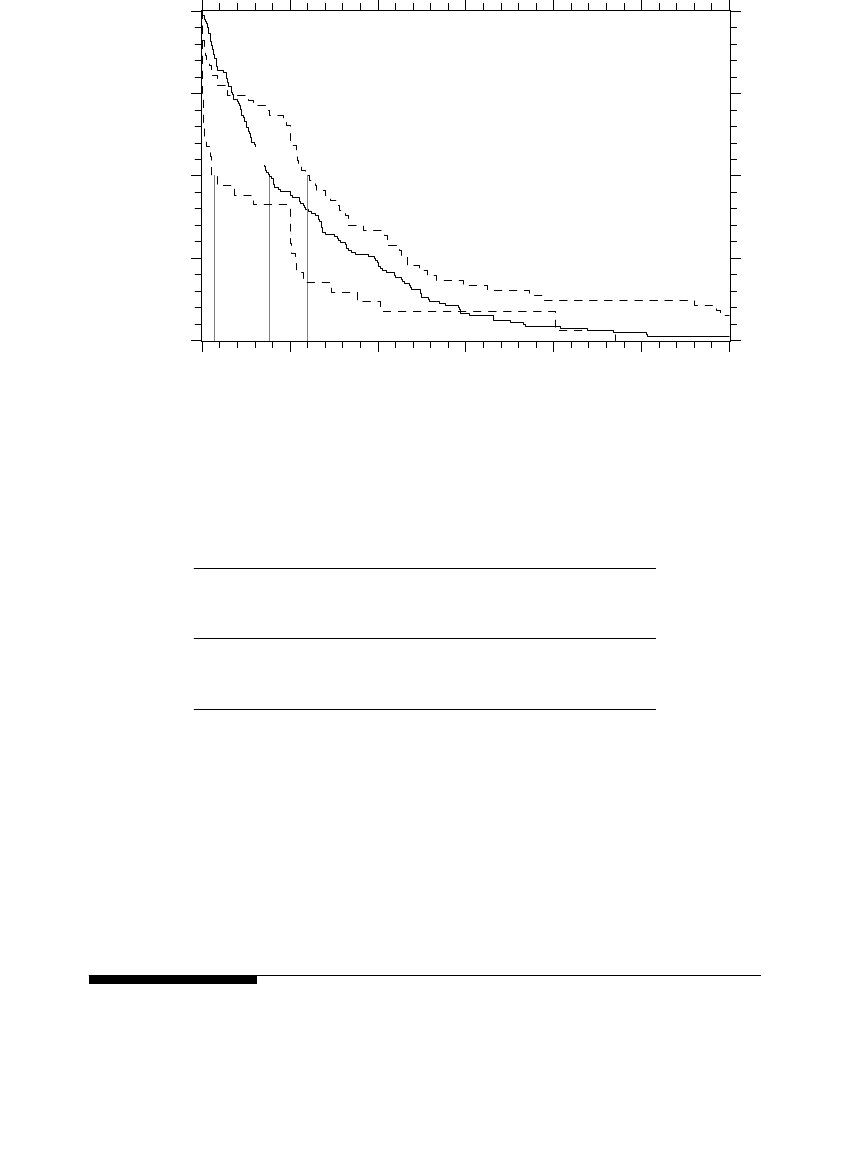
During storm days, the interruption durations increase exponentially. Fig-
ure 9.5 shows probability distributions of the daily SAIDI based on data
from four utilities. The plot is on a log-normal scale: the x-axis shows SAIDI
for each day on a log scale, and the y-axis shows the probability on a normal-
distribution scale. On this plot, data with a log-normal distribution comes
out as a straight line. Most of the utility data fits a log-normal distribution.
But, two of the utilities are even more skewed than a log-normal distribution
indicates — at these utilities, storm days have even more customer-minutes
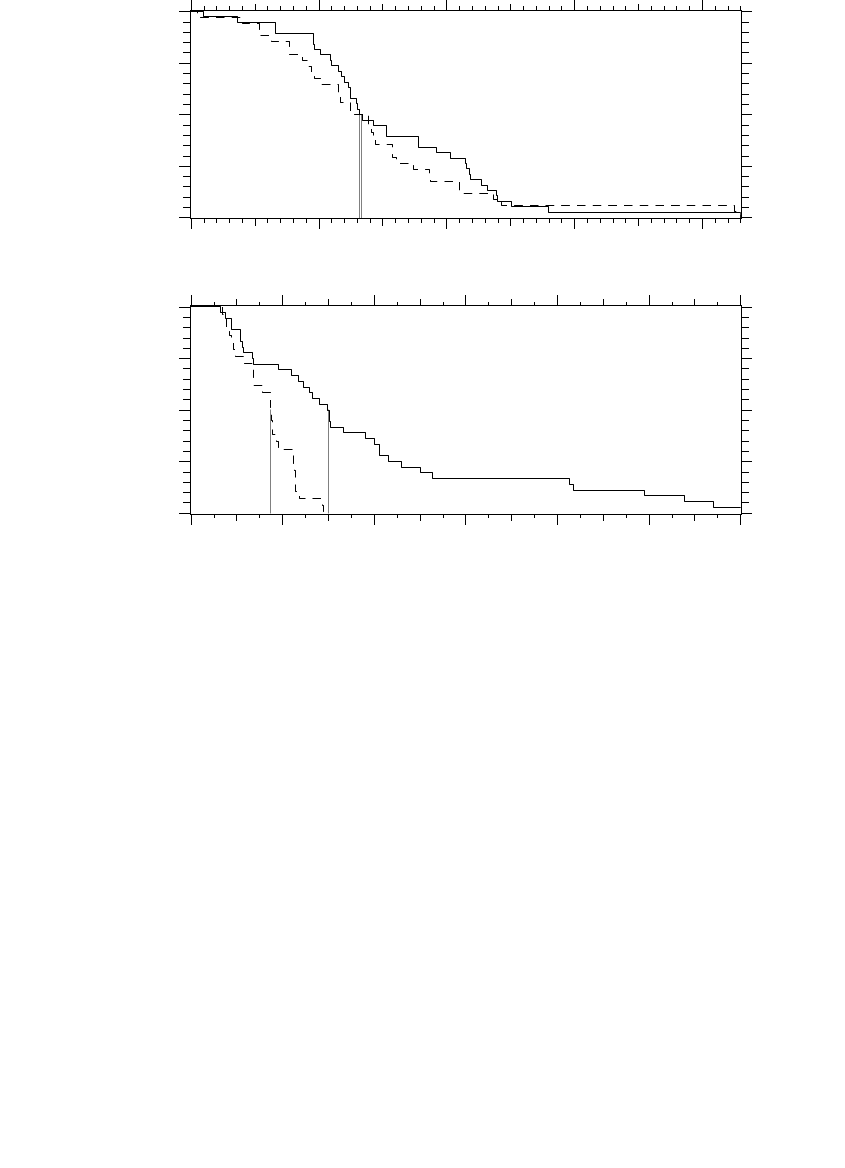
FIGURE 9.4
Distribution of utility indices with and without excluding storms. (Data from [EEI, 1999].)
storms
excluded
storms
included
0 1 2 3 4
storms
excluded
storms
included
0 2 4 6 8 10 12
0
25
50
75
100
0
25
50
75
100
SAIFI, events/year
Percent of utility indices
exceeding the x-axis value
0
25
50
75
100
0
25
50
75
100
SAIDI, hours/year
Percent of utility indices
exceeding the x-axis value
1791_book.fm Page 447 Monday, August 4, 2003 3:20 PM
(C) 2004 by CRC Press LLC
448
Electric Power Distribution Handbook
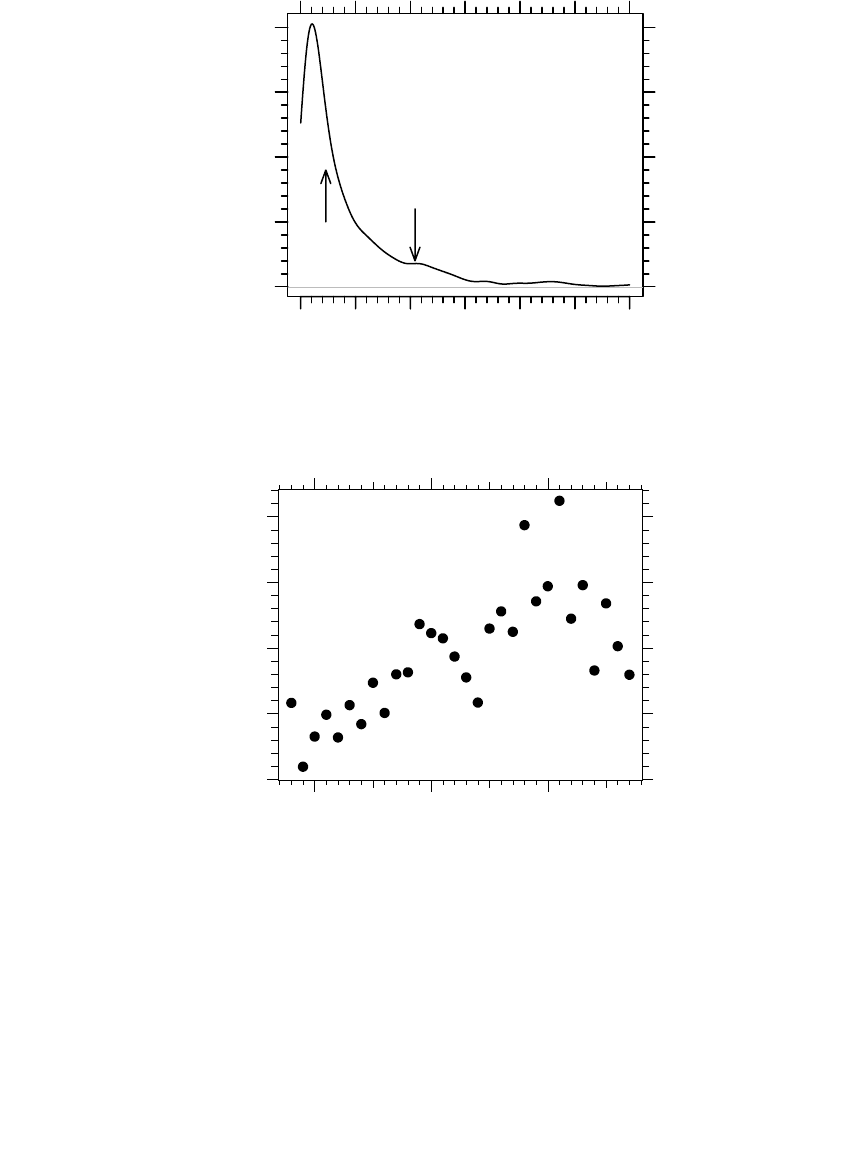
interrupted. At one of these utilities, 0.2% of the days contributed 40% of
the SAIDI index (over a 7-year period). During the worst year at this utility,
70% of SAIDI for that year happened because of three storms (impacting 5
days total). If we have one day with a SAIDI of over 100 min (the value for
a whole year at some utilities), it is going to be a long year. Figure 9.6 again
emphasizes how skewed the probability distribution of reliability data is.
The average is much higher than the median, and the extreme days heavily
influence the average.
Weather, even if it does not reach the level of “major event,” plays a major
role in reliability. Weather varies considerably from year to year — these
weather variations directly affect reliability indices. Bad lightning years or
excessively hot years worsen the indices.
Monitoring by Ontario Hydro Technologies in Ontario, Canada, gives
some insight into storm durations and failure rates (CEA 160 D 597, 1998).
In a mild to moderate lightning area, 20% of the interruptions occurred
during storm periods and 15% in the 24 h following a storm. The study area
had an average of 25 storm days per year and 73 storm hours per year.
Therefore, about 35% of outages occur in 7% of the time in a year (and 20%
in 0.8% of the time). The study found an interruption rate during storms of
10 to 20 times the non-storm rate.
FIGURE 9.5
SAIDI per day probability distributions for four utilities.
0.01 0.1 1.0 10.0 100.0
0.1
1.0
5.0
10.0
20.0
50.0
80.0
90.0
95.0
99.0
99.9
0.1
1.0
5.0
10.0
20.0
50.0
80.0
90.0
95.0
99.0
99.9
0.1
1.0
5.0
10.0
20.0
50.0
80.0
90.0
95.0
99.0
99.9
0.1
1.0
5.0
10.0
20.0
50.0
80.0
90.0
95.0
99.0
99.9
SAIDI/day, minutes
Percent of days
exceeding the x-axis value
1791_book.fm Page 448 Monday, August 4, 2003 3:20 PM
(C) 2004 by CRC Press LLC
Reliability
449
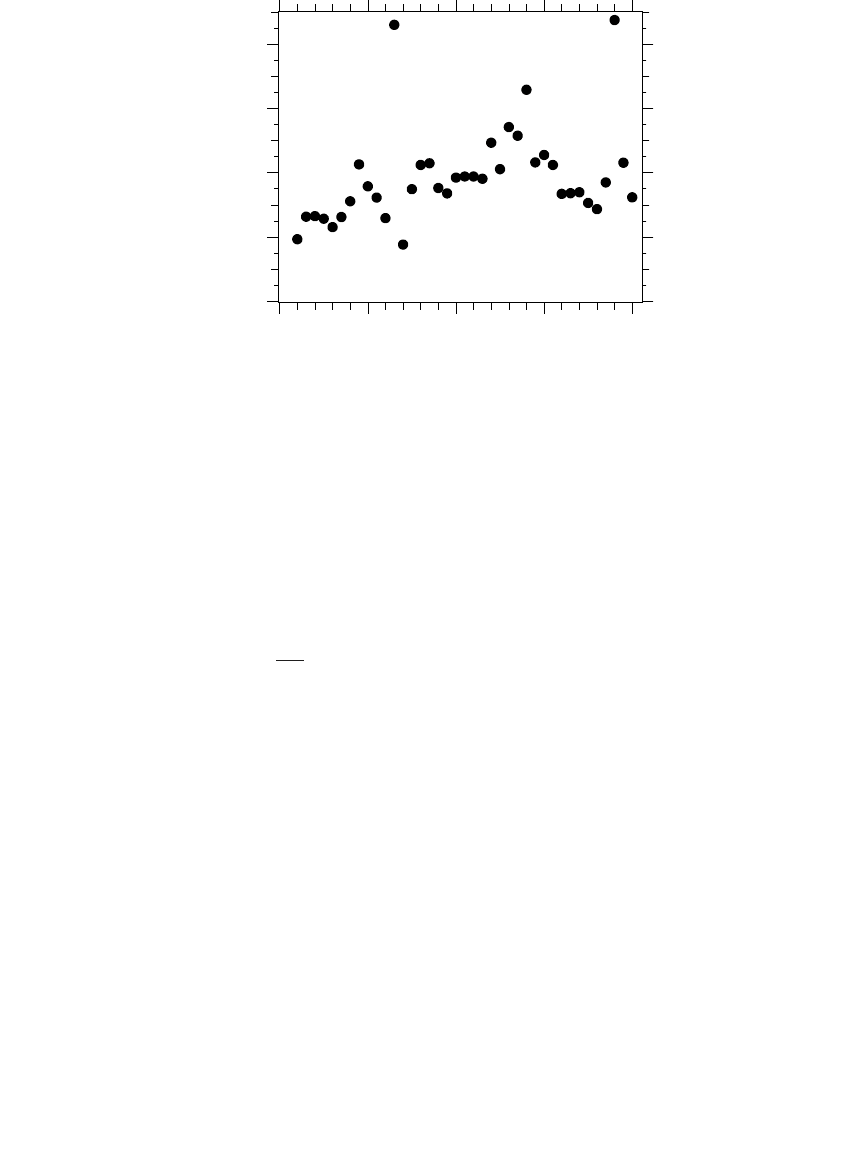
Faults and interruptions have significant year-to-year variation because
weather conditions vary significantly. Just as severe storm patterns vary,
normal storm frequencies and durations vary. Consider the thunderstorm
duration plot in Figure 9.7. Over this 30-year period in Tampa, FL (a very
high lightning area), some years had less than 80 h of storms, and a couple
of years had more than 240 h. These are not “severe events,” just variations
in the normal weather patterns. These storm variations translate into varia-
tions in the number of faults and in the reliability indices. Even in areas with
FIGURE 9.6
SAIDI per day probability density at one utility.
FIGURE 9.7
Thunderstorm duration by year for Tampa, Florida. (Data from [MacGorman et al., 1984].)
0.0 0.5 1.0 1.5 2.0 2.5 3.0
0.0 0.5 1.0 1.5 2.0
SAIDI per day in minutes
Density
median
mean
0.0 0.5 1.0 1.5 2.0 2.5 3.0
0.0 0.5 1.0 1.5 2.0
1950 1960 1970
50
100
150
200
250
Total storm hours in the given year
1791_book.fm Page 449 Monday, August 4, 2003 3:20 PM
(C) 2004 by CRC Press LLC

450
Electric Power Distribution Handbook
lower storm activity, significant variation is possible. Consider these varia-
tions if reliability “baselines” are going to be set for performance-based rates.
Wind, icing, and temperature extremes all have significant year-to-year vari-
ations that directly impact reliability indices. Watch out for a few years of
consistent weather; if the data from 1950–1955 of Figure 9.7 were used for
performance-based rates, we would be in trouble in following years.
The first step in quantifying the effect of weather on interruptions is to
track weather statistics along with interruption statistics. Lightning, wind,
temperature, and other important weather statistics are available from
national weather services as well as private groups, and many statistics
have long historical records. Correlations between weather statistics and
interruptions can help quantify the variations. Brown et al. (1997) show an
example for a feeder in Washington state where wind-dependent failures
were analyzed. For this case, they found 0.0065 failures/mi/year/mph of
wind speed.
After correlating interruptions with weather data, we can extrapolate how
much reliability indices could vary using historical weather data. One could
even use weather statistics to come up with a normalized interruption index
that tried to smooth out the weather variations.
9.3 Variables Affecting Reliability Indices
9.3.1 Circuit Exposure and Load Density
Longer circuits lead to more interruptions. This is difficult to avoid on
normal radial circuits, even though we can somewhat compensate by add-
ing reclosers, fuses, extra switching points, or automation. Most of the
change is in SAIFI; the interruption duration (CAIDI) is less dependent on
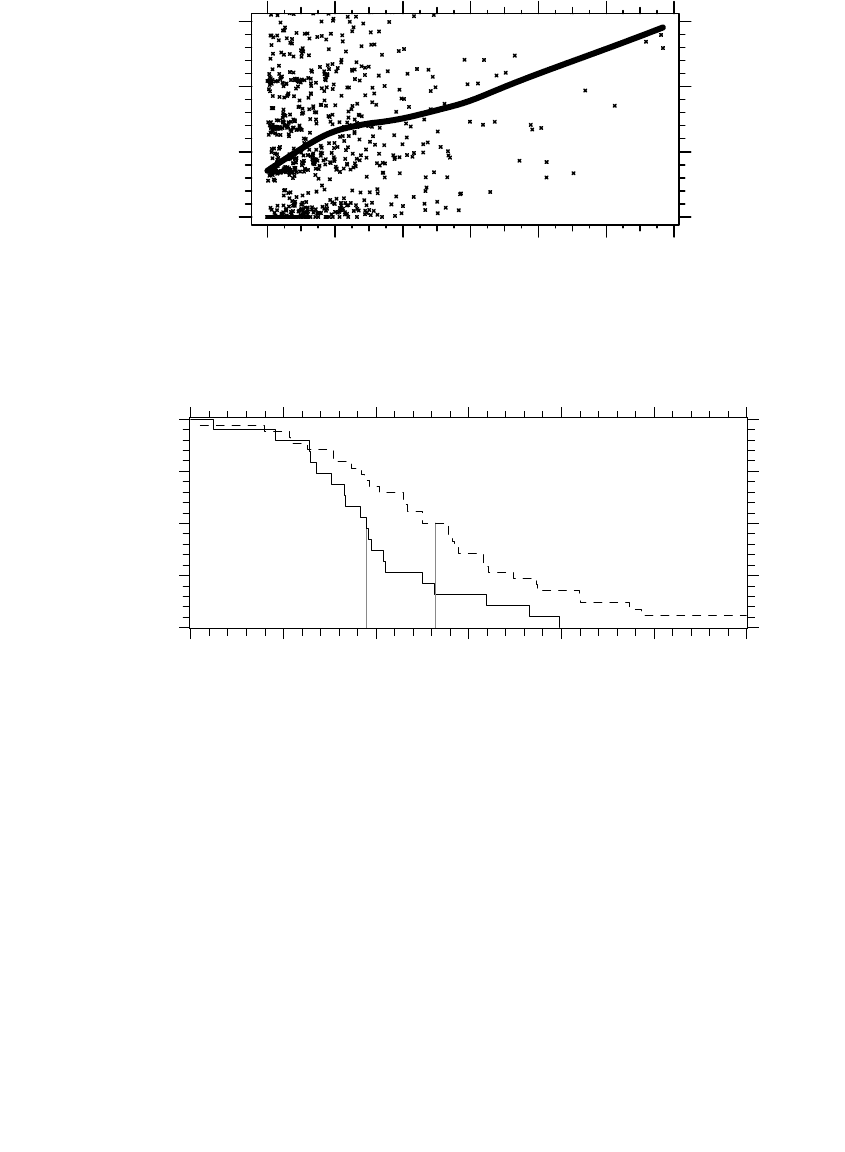
load circuit lengths. Figure 9.8 shows the effect on SAIFI at one utility in
the southwest U.S.
It is easier to provide higher reliability in urban areas: circuit lengths are
shorter, and more reliable distribution systems (such as a grid network) are
more economical. The Indianapolis Power and Light survey results shown
in Figure 9.9 only included performance of utilities in large cities. As
expected, the urban results are better than other general utility surveys.
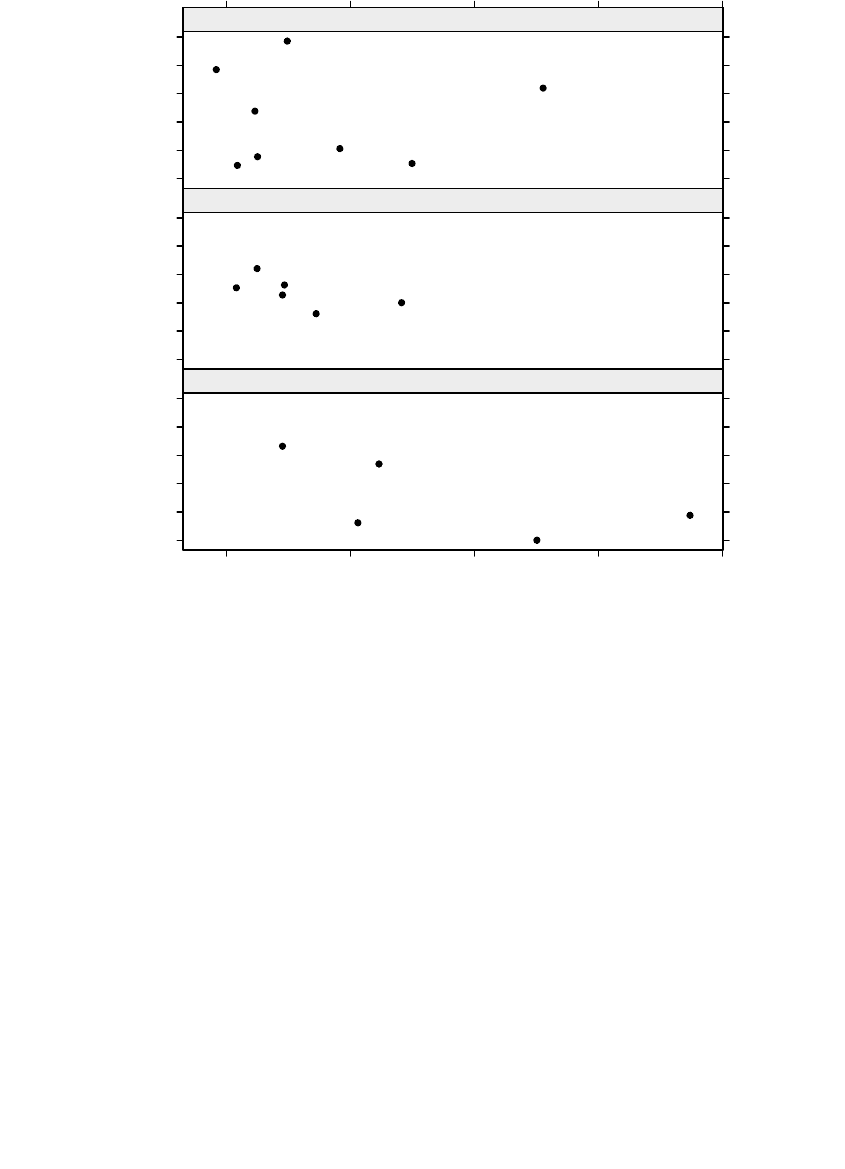
Another comparison is shown in Figure 9.10 — in all states, utilities with
higher load densities tend to have better SAIFIs.
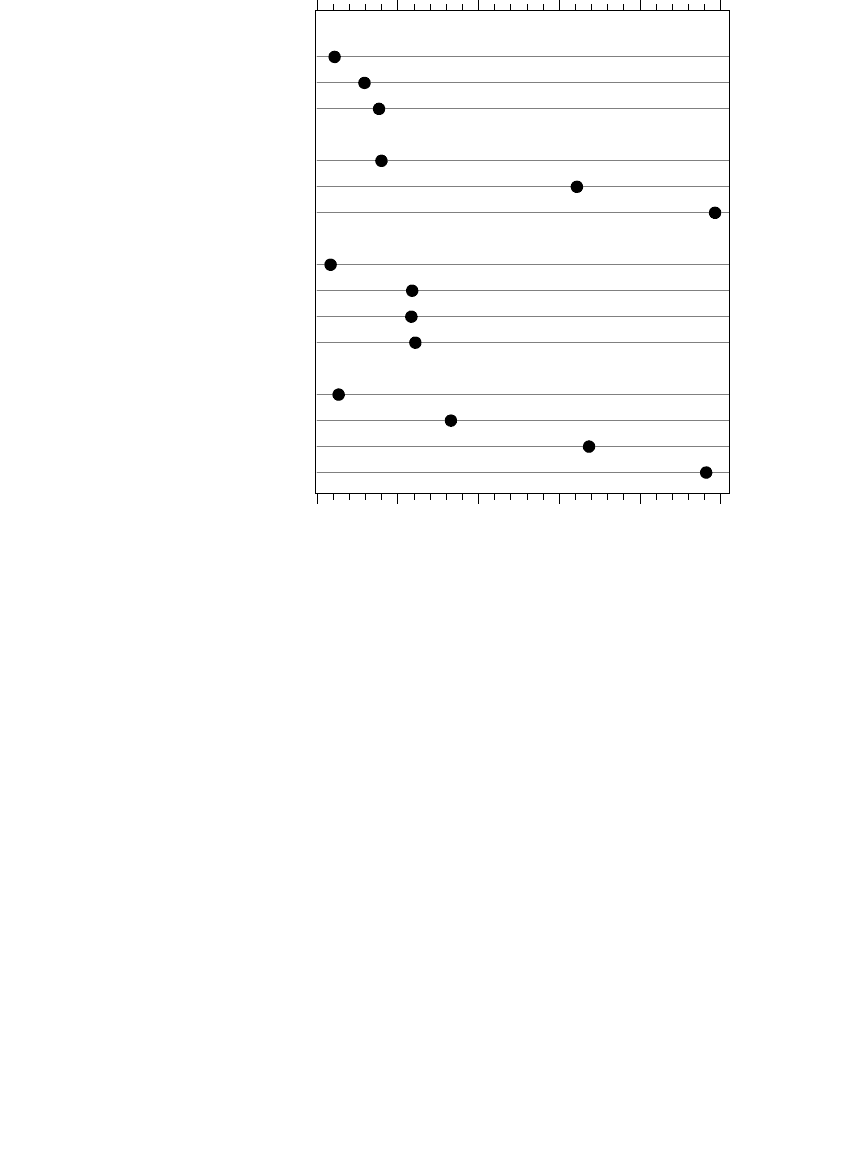
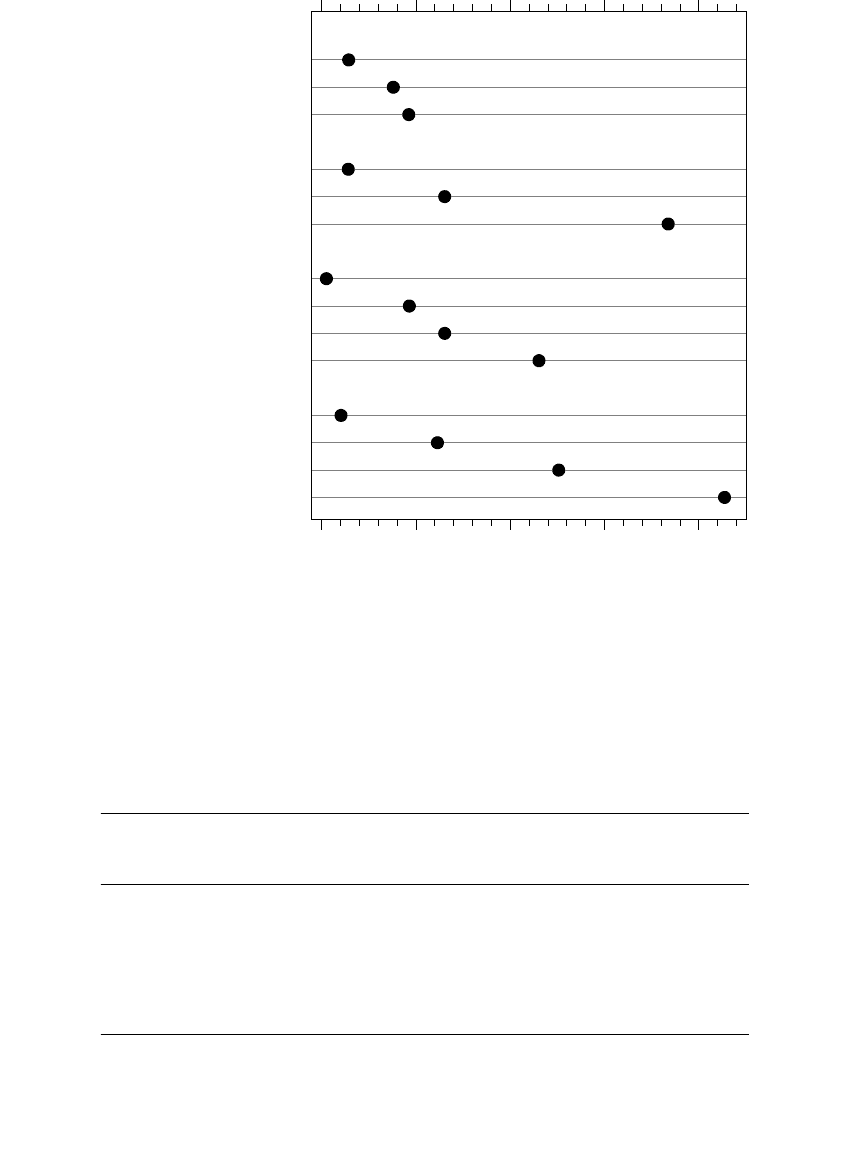
Figure 9.11 and Figure 9.12 show reliability for different distribution ser-
vices in several Commonwealth countries. The delineations used for this
comparison for Victoria are
• Central business district: used map boundaries
• Urban: greater than 0.48 MVA/mi (0.3 MVA/km)
1791_book.fm Page 450 Monday, August 4, 2003 3:20 PM
(C) 2004 by CRC Press LLC
Reliability
451
• Short rural: less than 124 mi (200 km)
• Long rural: greater than 124 mi (200 km)
9.3.2 Supply Configuration
The distribution supply greatly impacts reliability. Long radial circuits pro-
vide the poorest service; grid networks provide exceptionally reliable service.
Table 9.2 gives estimates of the reliability of several common distribution
supply types developed by New York City’s Consolidated Edison. Massive
redundancy for grid and spot networks leads to fantastic reliability — 50
plus years between interruptions. Note that the interruption duration
FIGURE 9.8
Effect of circuit length on SAIFI for one utility in the southwest U.S.
FIGURE 9.9
Comparison of the Indianapolis Power & Light Large City Survey of SAIFI to the general EEI
survey results (with storms excluded). (Data from [Indianapolis Power & Light, 2000].)
020406080100 120
0.0 0.5 1.0 1.5
Total circuit exposure, miles
SAIFI
020406080100 120
0.0 0.5 1.0 1.5
EEI survey
Large city
survey
0.0 0.5 1.0 1.5 2.0 2.5 3.0
0
25
50
75
100
0
25
50
75
100
SAIFI, events/year
Percent of utility indices
exceeding the x-axis value
1791_book.fm Page 451 Monday, August 4, 2003 3:20 PM
(C) 2004 by CRC Press LLC
452
Electric Power Distribution Handbook
(CAIDI) increases for the more urban configurations. Being underground
and dealing with traffic increase the time for repairs.
9.3.3 Voltage
Higher primary voltages tend to be more unreliable, mainly because of
longer lines. Figure 9.13 shows an example for one utility that is typical of
many utilities: higher voltage circuits have more interruptions.
On higher-voltage primary circuits, we need to make more of an effort to
achieve the same reliability as for lower voltage circuits: more reclosers, more
sectionalizing switches, more tree trimming, and so forth. With the ability
to build much longer lines and serve more customers, it is difficult to over-
come the increased exposure. Keeping reliability in mind when planning
higher-voltage systems helps. On higher-voltage circuits, wider is better than
longer. Burke’s analysis (1994) of the service length and width for a gener-
alized feeder shows that for the best reliability, higher-voltage circuits should
FIGURE 9.10
Effect of customer density on SAIFI.
Average customers per mile of distribution line
SAIFI
0.5
1
1.5
2
2.5
3
20 40 60 80 100
California (ten-year average)
0.5
1
1.5
2
2.5
3
Illinois (three-year average)
0.5
1
1.5
2
2.5
3
Texas (three-year average)
1791_book.fm Page 452 Monday, August 4, 2003 3:20 PM
(C) 2004 by CRC Press LLC
Reliability
453
be longer and wider, not just longer (see Table 9.3). Usually, higher-voltage
circuits are just made longer, which leads to poor reliability. Having a long
skinny main feeder with short taps off of the mainline results in poor reli-
ability performance.
9.3.4 Long-Term Reliability Trends
Utilities rarely have very long-term data covering decades. The Canadian
Electrical Association has tracked reliability data for many years. Figure
9.14 shows SAIDI over a 40-year period for Canada. Significant variation
exists from year to year. Part of this is due to the changing nature of the
survey (the utility base was not consistent for the whole time period). Much
of the variation is due to weather, even though the survey covers a huge
geographic area (we expect more variations for smaller geographic areas).
The data includes storms. Extreme years stand out. The worst year was
1998, which was dominated by the ice storm that hit Ontario and Quebec.
Over 1.6 million customers lost power; Hydro Quebec’s SAIDI for the year
was almost 42 h when it is normally less than 4 h.
FIGURE 9.11
Comparison of SAIFI by load density for several former British Empire colonies. (Data from
[Coulter, 1999].)
0 1 2 3 4 5
Central Business District
Urban
Short Rural
Central Business District
Urban
Short Rural
Central Business District
Urban
Short Rural
Long Rural
Central Business District
Urban
Short Rural
Long Rural
United Kingdom
New Zealand
South Australia
Victoria, Australia
SAIFI, Average interruptions per year
1791_book.fm Page 453 Monday, August 4, 2003 3:20 PM
(C) 2004 by CRC Press LLC
454
Electric Power Distribution Handbook
FIGURE 9.12
Comparison of SAIDI by load density for several former British Empire colonies. (Data from
[Coulter, 1999].)
TABLE 9.2
Comparison of the Reliability of Different Distribution Configurations
SAIFI
Interruptions/Year
CAIDI
min/Interruption
MAIFI
Momentary
Interruptions/Year
Simple radial 0.3 to 1.3 90 5 to 10
Primary auto-loop 0.4 to 0.7 65 10 to 15
Underground residential 0.4 to 0.7 60 4 to 8
Primary selective 0.1 to 0.5 180 4 to 8
Secondary selective 0.1 to 0.5 180 2 to 4
Spot network 0.02 to 0.1 180 0 to 1
Grid network 0.005 to 0.02 135 0
Source:
Settembrini, R. C., Fisher, J. R., and Hudak, N. E., “Reliability and Quality Compar-
isons of Electric Power Distribution Systems,” IEEE Power Engineering Society Transmission
and Distribution Conference, 1991. With permission. ©1991 IEEE.
0 100 200 300 400
Central Business District
Urban
Short Rural
Central Business District
Urban
Short Rural
Central Business District
Urban
Short Rural
Long Rural
Central Business District
Urban
Short Rural
Long Rural
United Kingdom
New Zealand
South Australia
Victoria, Australia
SAIDI, Average interruption duration per year, minutes
1791_book.fm Page 454 Monday, August 4, 2003 3:20 PM
(C) 2004 by CRC Press LLC
Reliability
455
Overall, the reliability trend is somewhat worsening. The main factor is
probably the gradual move to higher-voltage distribution circuits and sub-
urbanization. These trends lead to longer circuits and more exposure.
Although, better record keeping (outage management systems) may be mak-
ing SAIDI appear worse relative to earlier approaches because interruptions
are recorded more accurately.
9.4 Modeling Radial Distribution Circuits
On purely radial circuits, the customers at the ends of the circuits unavoid-
ably have the poorest reliability. On radial circuits, we can analyze the
FIGURE 9.13
Effect of circuit voltage on SAIFI for one utility in the southern U.S.
TABLE 9.3
Mainline Lengths and Lateral Lengths for Optimal
Reliability (Assuming a Constant Load Density)
Voltage,
kV
Main Feeder
Length, mi
Lateral Length,
mi
Ratio of Main
Feeder to Lateral
Tap Length
13.8 1.51 0.95 1.59
23 1.81 1.32 1.37
34.5 2.09 1.71 1.22
Source:
Burke, J. J.,
Power Distribution Engineering: Fundamentals
and Applications
, Marcel Dekker, New York, 1994.
15 kV
25 kV
5 kV
0.0 0.5 1.0 1.5 2.0 2.5 3.0
0
25
50
75
100
0
25
50
75
100
0
25
50
75
100
SAIFI, interruptions/year
Weighted percent of feeders
exceeding the x-axis value
1791_book.fm Page 455 Monday, August 4, 2003 3:20 PM
(C) 2004 by CRC Press LLC
456
Electric Power Distribution Handbook
reliability using series combinations of individual elements. If any series
component between the station and the customer fails, the customer loses
power.
Series elements can be combined as
where
l
= failure rate, normally in interruptions per year
U
= unavailability (total interruption time), normally in per unit, %, or h
or min per year
r
= average repair time per failure normally in per unit/year, %/year, or
h or min
The subscript
S
is the total of the series combination, and the subscripts
1, 2, …
n
indicate the parameters of the individual elements.
The failure rate
l
is analogous to SAIFI,
U
is analogous to SAIDI, and
r
is
analogous to CAIDI.
We can use these basic reliability predictions to estimate reliability indices
for radial circuits. Calculations quickly become complex if we try to account
for sectionalizing or have circuits with parallel elements or backfeeds. Reli-
ability analysis programs are available to model circuits with inputs similar
to a load-flow program, except that switch characteristics are included as
FIGURE 9.14
Yearly SAIDI for Canada. (Data from [Billinton, 1981, 2002; CEA, 2001].)
1960 1970 1980 1990 2000
0
2
4
6
8
SAIDI, hours
lll l
ll l
l
Sn
Sn nn
S
S
S
UUU U r r r
r
U
=+++
=+++=+++
=
12
12 1122
L
LL
1791_book.fm Page 456 Monday, August 4, 2003 3:20 PM
(C) 2004 by CRC Press LLC