Short T.A. Electric Power Distribution Handbook
Подождите немного. Документ загружается.

Voltage Sags and Momentary Interruptions
487
The voltage sags deeper for faults electrically closer to the bus (smaller
Z
f
). Also, as the available fault current decreases (larger
Z
s
), the sag becomes
deeper. The source impedance includes the transformer impedance plus the
subtransmission source impedance (often, subtransmission impedance is
small enough to be ignored). The impedances used in the equation depend
on the type of fault it is. For a three-phase fault (giving the most severe
voltage sag), use the positive-sequence impedance (
Z
f
= Z
f1
). For a line-to-
ground fault (the least severe voltage sag), use the loop impedance, which
is
Z
f
= (2Z
f1
+ Z
f0
)/3
. A good approximation is one ohm for the substation
transformer (which represents a 7 to 8-kA bus fault current) and 1
W
/mi (0.6
W
/km) of overhead line for ground faults. For accuracy, use complex division
since the impedances are complex, but for back-of-the-envelope, first-
approximation calculations, use the impedance magnitude.
Another way to approximate the voltage divider equation is to use the
available short-circuit current at the substation bus and the available short-
circuit current at the fault location:
where
V
bus
= per unit voltage at the substation
I
f
= the available fault current on the feeder at the fault location
I
s
= the available fault current at the substation bus
Note that this can be used for any type of fault as long as the appropriate
fault values are used in the equation. If the angles are ignored, the equation
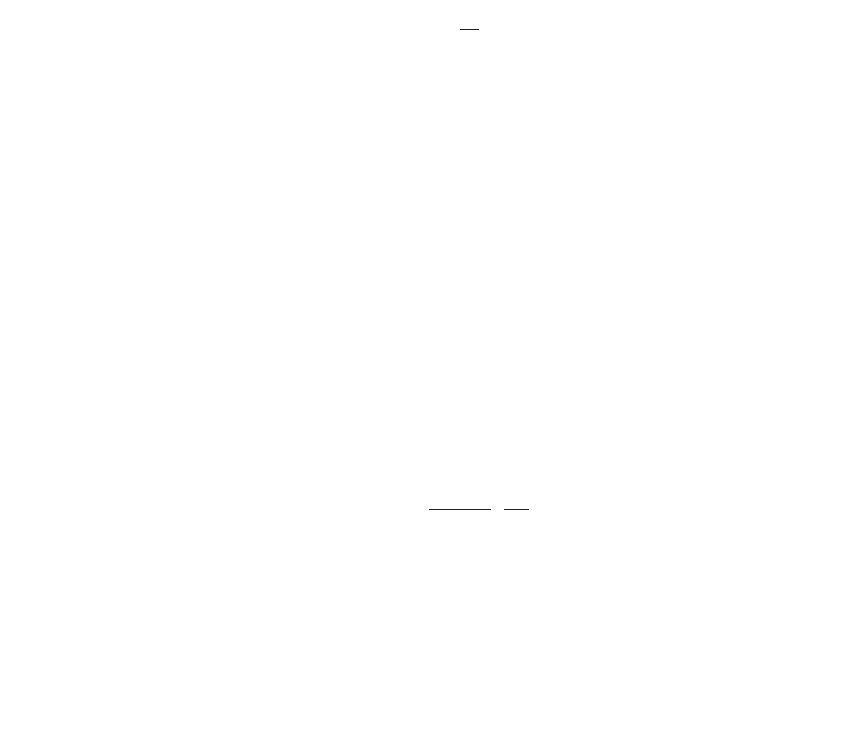
is an approximation (which is usually acceptable). Figure 10.6 shows a profile
of the substation bus voltage for faults at the given distance along the line
for 12.47, 24.94, and 34.5 kV. The higher-voltage systems have more severe
voltage sags for faults at a given distance. The graph also shows that three-
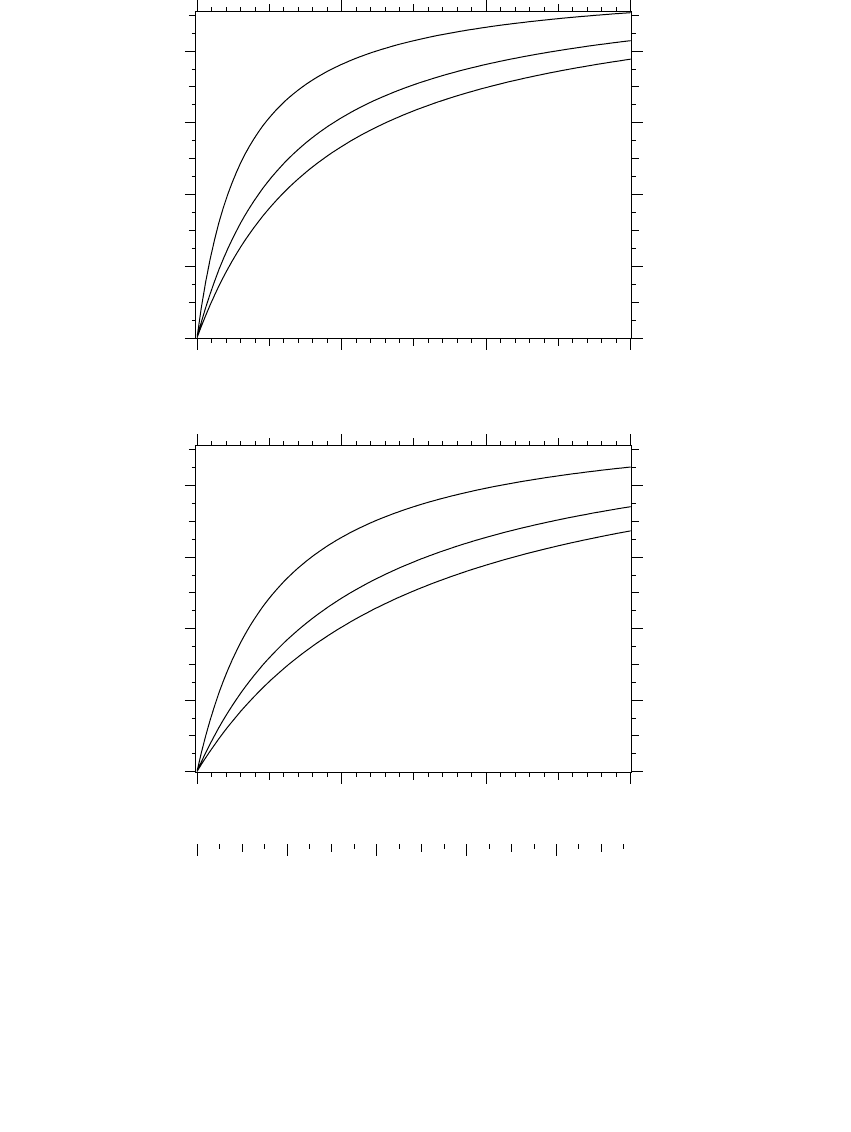
phase faults cause more severe sags. Figure 10.7 compares sags on under-
ground and overhead systems.
The effect of feeder faults on voltage sags at the substation bus can be
estimated with the following equation:
where
S
= annual number of sags per year where the voltage sags below
V
sag
V
sag
= per unit voltage sag level of interest (in the range of 0 to 1, e.g., 0.7)
n
f
= number of feeders off of the bus
V
I
I
bus
f
s
=-1
SV n
V
V
Z
Z
sag
f
sag
sag
s
f
()=
-
Ê
Ë
Á
ˆ
¯
˜
l
1
1791_book.fm Page 487 Monday, August 4, 2003 3:20 PM
(C) 2004 by CRC Press LLC
488
Electric Power Distribution Handbook
FIGURE 10.6
Substation voltage profile for faults at the given distance (single-phase and three-phase faults
are shown for each voltage — the circuit parameters for the 500-kcmil circuit are the same as
those in Figure 7.11).
12.5kV
25kV
34.5kV
Ground fault
0 2 4 6
0.0
0.2
0.4
0.6
0.8
12.5kV
25kV
34.5kV
Three-phase fault
0 2 4 6
0.0
0.2
0.4
0.6
0.8
0 2 4 6 8
Per unit line-to-ground voltage
Distance from the substation, miles
Per unit line-to-ground voltage
Distance from the substation, miles
km
1791_book.fm Page 488 Monday, August 4, 2003 3:20 PM
(C) 2004 by CRC Press LLC
Voltage Sags and Momentary Interruptions
489
l
= feeder mains fault rate per mile (or other unit of distance) per phase
including faults on laterals and including both temporary and per-
manent faults
Z
f
= feeder impedance,
W
/mi (or other unit of distance); usually use
Z
f
=
(2
Z
1
+
Z
0
)/3 for ground faults
Z
s
= source impedance,
W
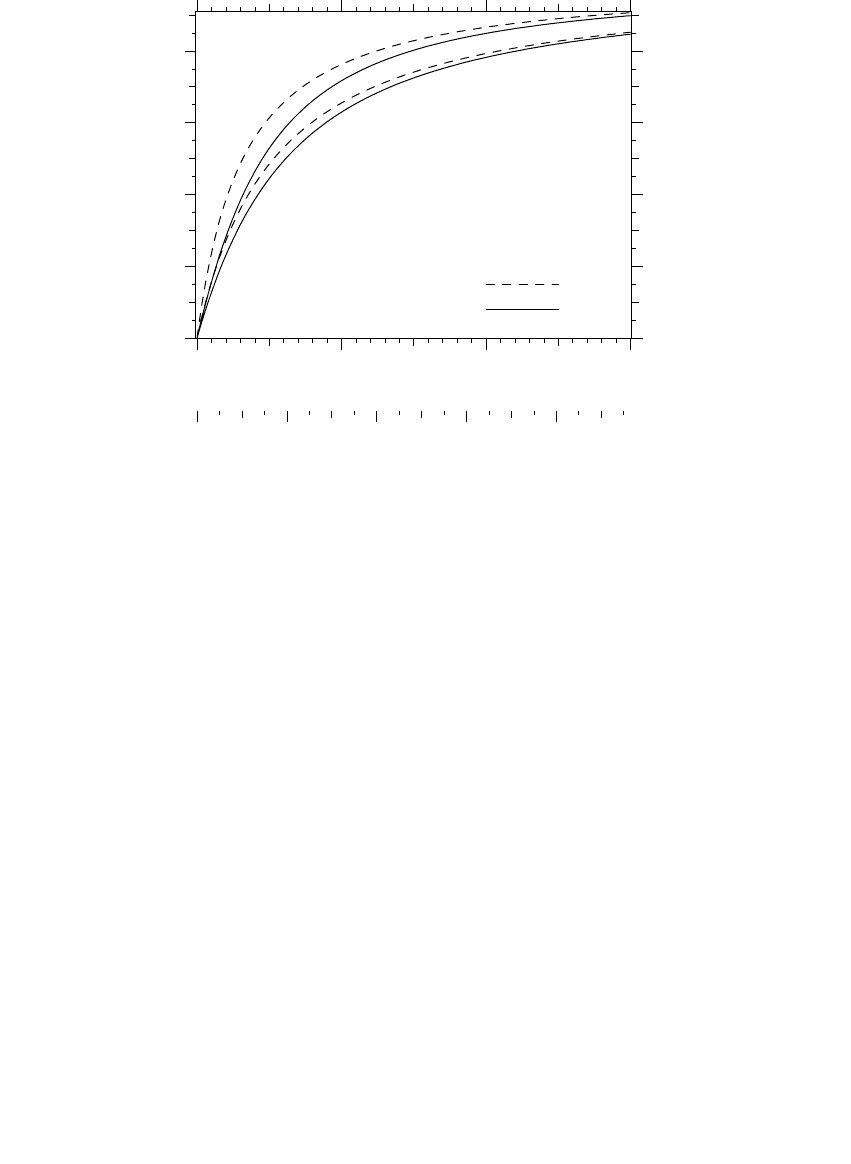
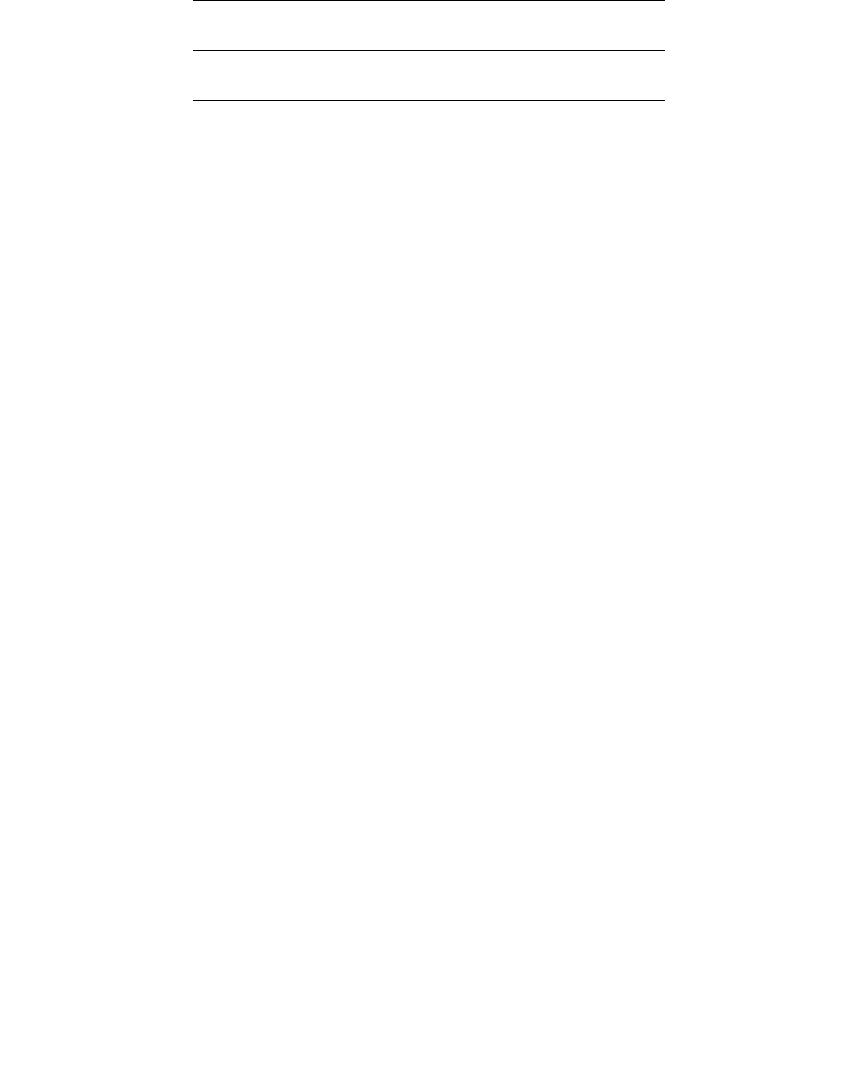
The distribution of voltage sags based on this equation is shown in Figure
10.8 for some common parameters. Several points are noted from this anal-
ysis on voltage sags:
•
Exposure
— For 15-kV circuits, we can ignore exposure beyond the
first 2 or 3 mi (4 or 5 km) for sags to the bus voltage. The first mile
or two is most important as far as circuit improvement, maintenance,
or application of current-limiting fuses.
•
System voltage
— Sags are more severe on higher voltage distribution
systems (especially at 34.5 kV). A fault 4 mi from the substation sags
the voltage much more on a 25-kV system than on a 12-kV system
because the substation transformer is a higher impedance relative
to the line impedance at higher system voltages. For 24.94 kV, expo-
sure as far as 5 mi from the station is significant.
FIGURE 10.7
Comparison of substation voltage for faults on overhead circuits and cable circuits at the given
distance (single-phase and three-phase faults are shown; the circuit parameters are the same
as those in Figure 7.11 and Figure 7.12).
Overhead circuit
Cable circuit
Three-phase fault
Single-phase fault
0 2 4 6
0.0
0.2
0.4
0.6
0.8
0 2 4 6 8
Distance from the substation, miles
Per unit line-to-ground voltage
km
1791_book.fm Page 489 Monday, August 4, 2003 3:20 PM
(C) 2004 by CRC Press LLC
490
Electric Power Distribution Handbook
•
Single vs. three-phase faults
— Three-phase faults cause more severe
sags than single-line-to-ground faults. Three-phase faults farther
away can pull the voltage down.
•
Underground vs. overhead
— All-underground circuits have more
exposure to sags because cables have lower impedance than over-
head lines.
•
Number of feeders
— The number of sags on the station bus is directly
proportional to the number of feeders off the bus.
•
Transformer impedance
— A lower station transformer impedance (a
bigger transformer or lower percent impedance) improves voltage sags.
•
Bus tie
— It does not matter whether a substation bus tie is open or
closed. If it is open, a fault only affects half of the feeders. A fault
that does occur forces a deeper sag because of a higher effective
source impedance. These two effects tend to cancel each other.
•
Voltage regulation
— Raising the nominal voltage improves the volt-
age seen by customers during a fault. Say that a fault drops the
voltage to 0.8 per unit, and the prefault voltage was 1.0 per unit. If
the prefault voltage were 1.1 per unit, the voltage during the sag is
0.88 per unit. This is not a big difference, but for equipment sensitive
FIGURE 10.8
Cumulative distribution of substation bus voltage sags per year for the given (25-MVA, 10%
transformer, 500-kcmil feeder, n = 2 or 4 feeders off of the bus,
l
= 1 faults/phase/mile of
mains/year, assumes line-to-ground faults only). Copyright © 2003. Electric Power Research
Institute. 1001665.
Power Quality Improvement Methodology for Wires Companies.
Reprinted with
permission.
25kV
12kV
n=4
n=2
0.0 0.2 0.4 0.6 0.8
0
5
10
15
Per-unit voltage magnitude
Annual number of sags below the x-axis value
1791_book.fm Page 490 Monday, August 4, 2003 3:20 PM
(C) 2004 by CRC Press LLC
Voltage Sags and Momentary Interruptions
491
to sags to 0.7 to 0.85 per unit, higher voltages appreciably reduce
the number of tripouts.
Customers at the end of a circuit have more severe voltage sags because
almost all faults upstream appear as little or no voltage (most actually fit
the power quality definition of an interruption, a voltage to below 10%).
10.3.1 Effect of Phases
Three-phase loads are often controlled by single-phase devices (the controls
are often the most sensitive element). The effect on three-phase customers
depends on how loads are connected and depends on the transformer con-
nection as shown in Table 10.3. In general, if the transformer causes more
phases to be affected, the voltage drop is less severe. One situation is not
always better than the other. Severity depends on which phases the sensitive
devices are located. The type and design of the device and its controls are
also factors.
For facility equipment connected
line-to-line
, the wye – wye transformer
connection provides the best performance. For facility equipment connected
line-to-ground
, the delta – wye facility transformer is best.
Single-phase sags on distribution systems are more common than two- or
three-phase sags. This is expected since most faults on distribution systems
are single phase. For example, in EPRI’s Distribution Power Quality Study
(EPRI TR-106294-V2, 1996), about 64% of voltage sags to below 70% were
single phase, while three-phase sags made up 25%, and two-phase sags, 10%.
For severe sags below 30% voltage, three-phase events are more common;
more than half are three-phase events (see Figure 10.9). This includes
momentary interruptions, most of which are three-phase.
10.3.2 Load Response
During a voltage sag, rotating machinery supports the voltage by feeding
current back into the system. Synchronous motors and generators provide
the largest boost. Induction motors also provide benefit, but the support
decays quickly.
TABLE 10.3
Line-to-Ground and Line-to-Line Voltages on the
Low-Voltage Side of a Transformer with One Phase on the
High-Voltage Side Sagged to Zero
Voltages Primary Voltages
Voltages Downstream of a
Delta–Wye Transformer
Line-ground 0.00 1.00 1.00 0.58 0.58 1.00
Line-line 0.58 0.58 1.00 0.33 0.88 0.88
1791_book.fm Page 491 Monday, August 4, 2003 3:20 PM
(C) 2004 by CRC Press LLC
492
Electric Power Distribution Handbook
Increasing a motor’s inertia is one way to increase the ride through of the
motor, which also increases the support to other loads in the facility.
Following a sag, however, the response of loads — particularly motors —
may further disturb the voltage. During a sag, motors slow down. After the
sag, the motors draw inrush current to speed up. If motors are a large enough
portion of the load, this inrush pulls the voltage down, delaying the recovery
of voltage. Motors with small slip and those with large inertia draw the most
inrush following a sag. These effects are more severe for customers or areas
with a large percentage of motor loads and for longer fault clearing times
(Bollen, 2000; IEEE Std. 493-1997).
An extreme case of motor inrush sometimes happens with air conditioners.
Single-phase air conditioner compressors are prone to stall during voltage
sags; during which, the compressor draws locked rotor current, about five
or six times normal. Tests by Williams et al. (1992) found that voltages below
60% of nominal for five cycles stalled single-phase air conditioners. Longer-
duration sags also stall compressors for less severe sags (in the range of 60
to 70% of nominal). The compressor stays stalled long after the system
voltage has returned to normal. It keeps drawing current until thermal
overload devices trip the unit, which can take one half of a second. On the
distribution system, this extra current may trip breakers or blow fuses in
addition to aggravating the voltage sag.
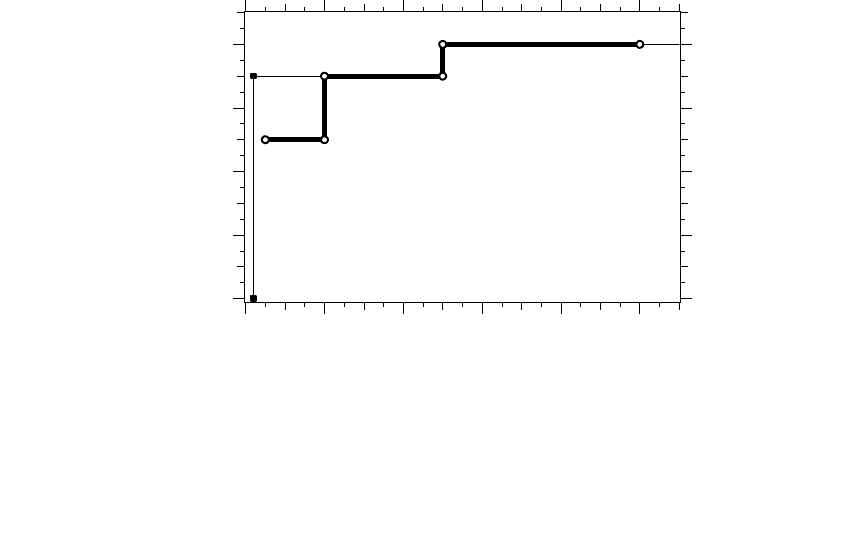
FIGURE 10.9
Rate of number of phases with a voltage drop in the EPRI DPQ study. (Copyright © 1996.
Electric Power Research Institute. TR-106294-V2.
An Assessment of Distribution System Power
Quality: Volume 2: Statistical Summary Report.
Reprinted with permission.
0
5
10
15
20
25
30
35
0
5
10
15
20
25
30
35
40
45
50
55
60
65
70
75
80
85
90
Voltage (%)
Yearly Rate of 60-Second Aggregate Events at a Given
Voltage Level
One Phase
Two Phases
Three Phases
Number of Phases with a Voltage Drop
Yearly Rate for Different Phases
1791_book.fm Page 492 Monday, August 4, 2003 3:20 PM
(C) 2004 by CRC Press LLC

Voltage Sags and Momentary Interruptions 493
Adjustable-speed drives and other loads with capacitors (mainly rectifiers)
also draw inrush following a voltage sag. During the sag, rectifiers stop
drawing current until the dc voltage on the rectifier drops to the sagged
voltage. After the sag, the rectifier draws inrush to charge the capacitor. This
spikes to several times normal, but the duration is short relative to motor
inrush. The inrush may blow fuses or damage sensitive electronics in the
rectifier. For severe sags, much of the rectifier-based load trips off, which
reduces the inrush.
Normally, we neglect the load response for voltage sag evaluations, but
occasionally, we must consider the response of the load, either for its direct
impact on voltage sags, or for the impact of the inrush.
10.3.3 Analysis of Voltage Sags
The calculation of the voltage magnitude at various points on a system
during a fault at a given location is easily done with any short-circuit pro-
gram. We make the fairly accurate assumption that the fault impedance is
zero. The engineer or computer program finds the duration of the sag using
the time-current characteristics of the protective device that should operate
along with the fault current through it.
Based on a short-circuit program, the fault positions method repeatedly
applies faults at various locations and tallies the voltages at specified loca-
tions during the faults. The procedures, which may apply thousands of fault
locations, result in predictions of the number of voltage sags below a given
magnitude at the specified locations. This procedure is well documented in
the Gold Book (IEEE Std. 493-1997) [see also (Conrad et al., 1991)].
The faults are applied along each line in a system. The end results are
scaled by the fault rate on the line, which can be based on historical results
or typical values for the voltage and construction.
We need considerable detail for the fault-positions analysis, especially a
complete system model including proper zero-sequence impedances and
transformer connections (these are left out of many transmission system
load-flow models).
Another simpler method for voltage sags is the method of critical distances
(Bollen, 2000). The approach is to find the farthest distance, the critical dis-
tance, to a fault that causes a sag of a given magnitude. Pick a sag voltage
of interest, 0.7 per unit for example. Find the critical distance for the chosen
voltage. Using a feeder map, add up the circuit lengths within the critical
distance. Multiply the total exposed length by the fault rate — this is the
number of events expected. This method is not as accurate as the fault
positions method, but is much simpler: we can calculate the results by hand,
and the process of doing the calculations provides insight on the portions
of distribution and transmission system that can cause sags to the given
customer. We can also target this area of vulnerability for inspection or addi-
tional maintenance or apply faster protection schemes covering those circuits
(to clear faults and sags more quickly).
1791_book.fm Page 493 Monday, August 4, 2003 3:20 PM
(C) 2004 by CRC Press LLC
494
Electric Power Distribution Handbook
10.4 Characterizing Sags and Momentaries
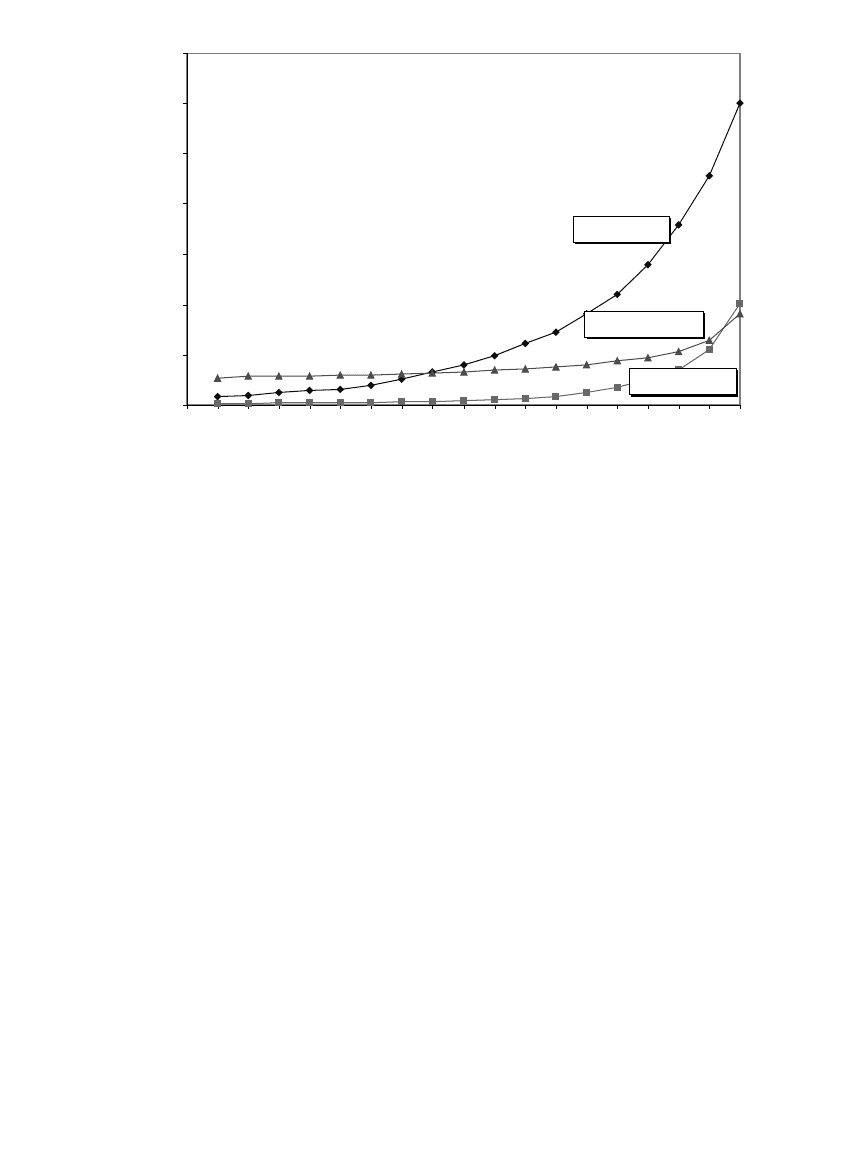
10.4.1 Industry Standards
The most commonly cited industry standard for ride through was developed
by the Information Technology Industry Council (ITI) (Figure 10.10). The ITI
curve updates the CBEMA curve (Computer Business Equipment Manufac-
turers’ Association, which became ITI) and is often referred to as the new
CBEMA curve. The ITI curve is not an actual tested standard — computers
do not have to be certified to pass some test. The ITI curve is used as a
FIGURE 10.10
ITI curve that shows the
typical
voltage sensitivity of information technology equipment. (From
[Information Technology Industry Council (ITI), 2000]. With permission.)
0
100
200
300
400
500
0
.000001
0
.00001
0.0001
0.001
0
.01
0
.1
1
10
100
D
uration in Cycles (c) an d Seconds (s)
Percent of Nominal Voltage (RMS or Peak Equivalent)
20 ms
3 ms
1 ms
0
.5 s
10 s
Steady
State
1 c
10 c
100 c
0.01 c
1 us
.
001 c
1
20
1
40
110
9
0
80
70
40
Applicable to Single-Phase
120-Volt Equipment
V
oltage Tolerance Envelope
Prohibited Region
No Damage Region
N
o Interruption In Function Region
1791_C10.fm Page 494 Wednesday, August 6, 2003 11:03 AM
(C) 2004 by CRC Press LLC
Voltage Sags and Momentary Interruptions 495
benchmark indicator for comparison of power quality between sites and to
track performance over time. Because the ITI curve somewhat represents the
ride through of computers, we can single out events below the ITI curve as
“suspects,” which may trip sensitive equipment.
Another major equipment standard has been produced by the semicon-
ductor industry (SEMI F47-0200, 1999). The major advance of the SEMI set
of standards is that there is an actual test standard for the equipment. To
meet the SEMI standard, equipment must pass a series of voltage sag tests
(SEMI F42-0600, 1999). The standard defines many factors, including sag
generator and other test apparatus requirements, sampling specimens, test
procedure, and reporting of test results. The SEMI standard is only for single-
phase sags; for three-phase equipment with a neutral, six tests are done: each
phase-to-neutral voltage is “sagged,” and each phase-to-phase voltage is
sagged in turn. For three-phase equipment without a neutral, each phase-
to-phase voltage is tested with a sag generator.
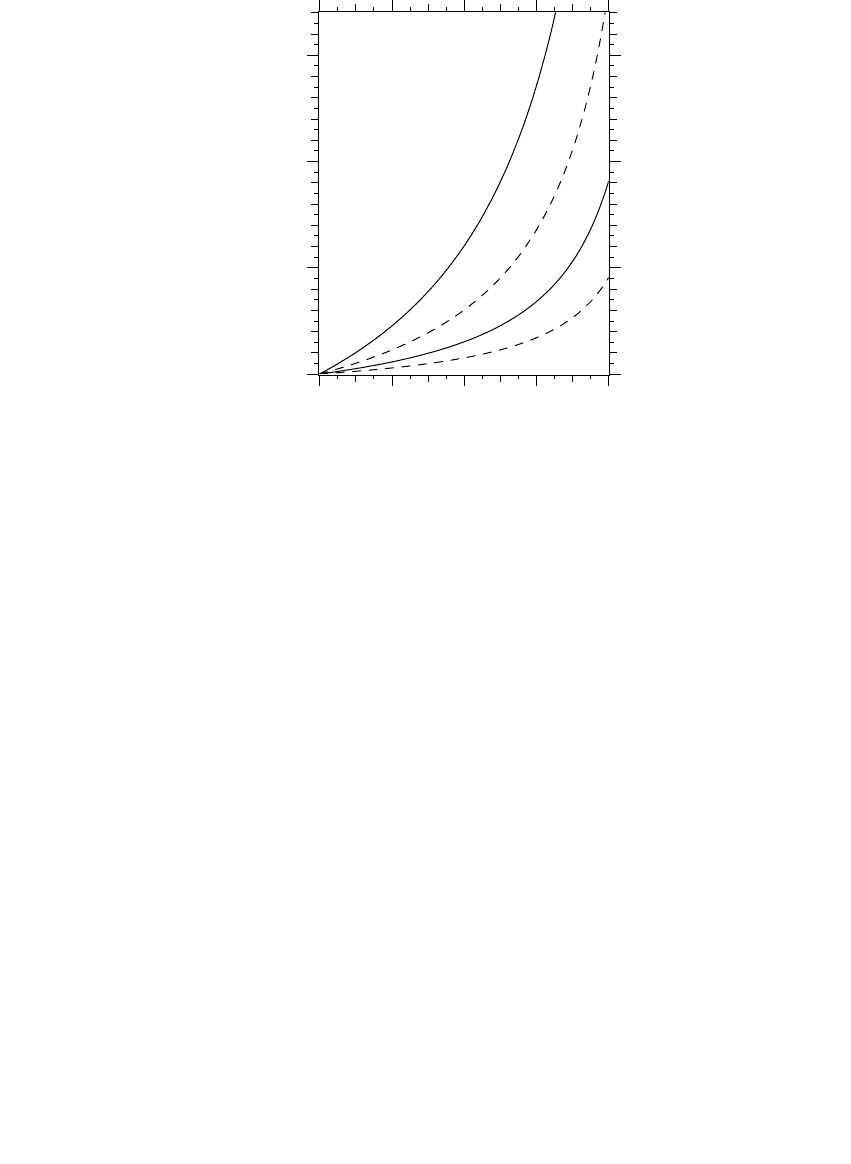
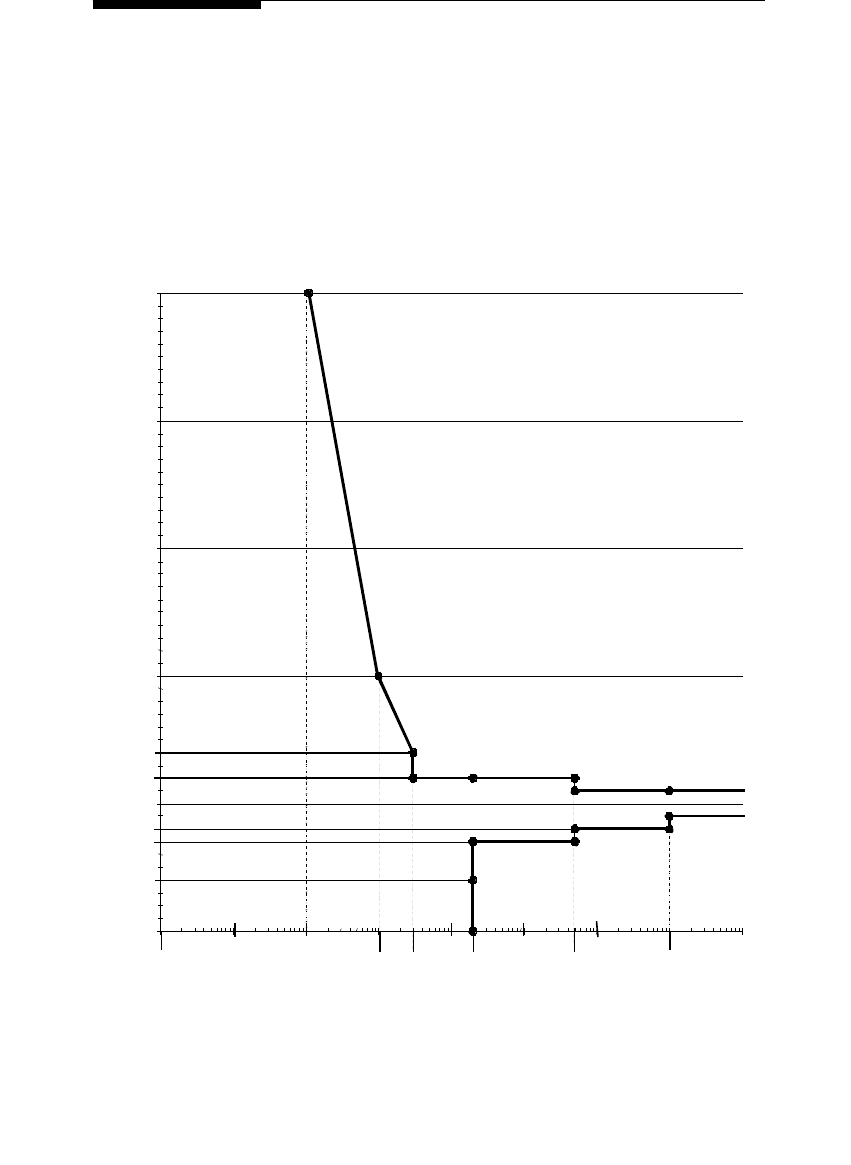
The SEMI curve focuses exclusively on voltage sags. In some cases, the
SEMI curve is more strict than the ITI curve, and it appears that way when
the two curves are graphed together as in Figure 10.11. The SEMI curve
has a deeper voltage sag characteristic. The most severe point on the SEMI
curve is the 0.2-sec sag for a voltage to 50% of nominal. However, some
equipment could meet the SEMI requirement but not pass the ITI curve
points. The main types of equipment that fall into this category are relays
and contactors. The ITI curve has a 0.02-sec interruption that is enough to
disengage many relays and contactors that may survive a 0.2-sec sag to
50% of nominal voltage.
FIGURE 10.11
SEMI voltage sag ride-through requirement compared against the ITI curve. (SEMI curve from
[SEMI F47-0200, 1999].)
ITI
SEMI
0.0 0.2 0.4 0.6 0.8 1.0
0
20
40
60
80
Time, seconds
Voltage magnitude, percent
1791_book.fm Page 495 Monday, August 4, 2003 3:20 PM
(C) 2004 by CRC Press LLC
496 Electric Power Distribution Handbook
Several power quality indices have been introduced that are similar to the
reliability indices (EPRI TP-113781, 1999). Utilities can use these for some of
the same purposes as reliability indices: targeting areas for maintenance and
circuit upgrades, tracking the performance of regions, and documenting
performance to regulators. The most widely used index is SARFI (EPRI TP-
113781, 1999; Sabin et al., 1999) defined as
SARFI
X
, System Average RMS (Variation) Frequency Index: SARFI
X
rep-
resents the average number of specified rms variation measurement
events that occurred over the assessment period per customer served,
where the specified disturbances are those with a magnitude less than X
for sags or a magnitude greater than X for swells.
where
X = rms voltage threshold; possible values — 140, 120, 110, 90, 80, 70, 50,
and 10
N
i
= number of customers experiencing short-duration voltage deviations
with magnitudes above X% for X > 100 or below X% for X < 100 due
to measurement event i
N
T
= number of customers served from the section of the system to be
assessed
The breakpoints were not chosen arbitrarily. The 90, 80, and 70% thresholds
are boundaries of the ITI curve, the 50% threshold is a typical breakpoint
for motor contactors, and 10% is the dividing line between a sag and an
interruption. Two special variations of SARFI have also been defined.
SARFI
ITIC
is the number of events below the lower ITI curve. In similar
fashion, SARFI
SEMI
is the number of events below the SEMI curve. SARFI
can be applied for one monitor (and one customer) or for several monitored
locations. It is difficult to extend this concept to make SARFI a system-wide
performance indicator like SAIFI — what is straightforward for reliability
indices becomes much more complicated for sags because a fault causes
different voltages at different locations on the distribution system. It is dif-
ficult to find a system-wide average without a vast number of monitors.
Approximations must be used to estimate the effects at different customers
based on a small number of monitored points.
10.4.2 Characterization Details
Several disturbances often occur within a short time of each other. Com-
monly, a breaker or recloser goes through several reclosing attempts. The
customer sees a sequence of voltage sags. If one of these events causes an
SARFI
X
i
T
N
N
=
Â
1791_book.fm Page 496 Monday, August 4, 2003 3:20 PM
(C) 2004 by CRC Press LLC