Short T.A. Electric Power Distribution Handbook
Подождите немного. Документ загружается.


Voltage Sags and Momentary Interruptions 497
end-use disruption, from their point of view, it does not matter if additional
events follow within the next few minutes, as the customer is already dis-
turbed. To account for this, we can aggregate events within a rolling time
window. Commonly, time windows are 1 and 5 min for calculating SARFI
X
or other power quality benchmarks.
Since voltage sags can have different impacts on each phase, how do we
account for the differences between a three-phase sag and a single-phase
sag? We can tabulate sags in two different ways:
• Per phase — Each phase is tracked independently. A three-phase sag
counts three times that of a single-phase sag. Single-phase recorders
automatically calculate the number of sags per phase.
• Minimum phase — A sag event is recorded as the lowest of the three
phase voltages. A three-phase sag counts the same as a single-phase
sag. SARFI
X
uses this approach.
Both approaches are useful depending on the customer and load charac-
teristics. The per-phase method is better for single-phase customers and for
customers with three-phase load that is more sensitive to multiple-phase
sags. The minimum-phase method is better for facilities where sags on any
of the three phases could trip a process. At a three-phase location, the min-
imum-phase method gives higher numbers of voltage sags.
The line-to-ground and line-to-line voltages may be significantly different
during a voltage sag. Ideally, we want to record and benchmark what the
critical load sees, but sometimes that is unknown (and, some facilities may
have critical loads connected line to line and line to ground). Normally,
SARFI is tracked based on however the recorders are connected.
Most voltage sags have a simple shape — the voltage drops in magnitude
and stays at a constant value until the fault clears. After that, the voltage
returns to its pre-sag value. The rms change is approximately a rectangular
wave. The rectangular shape makes classification easy — only a magnitude
and a duration are needed. Sometimes, sags do not follow the rectangular
shape. If the fault current is not constant, the voltage will not be constant.
If the fault evolves from a single line-to-ground fault into a multiple-phase
fault, the voltage will change. These types of events are hard to classify, but
most of the time, we can ignore them for the purposes of monitoring and
collecting statistics at a site. For analysis of specific events that disrupted
equipment, review of the rms shape may provide additional meaning
beyond just having a magnitude and a duration.
10.5 Occurrences of Voltage Sags
Several power quality monitoring studies have characterized the frequency
of voltage sags. The two most widely quoted studies are EPRI’s Distribu-
1791_book.fm Page 497 Monday, August 4, 2003 3:20 PM
(C) 2004 by CRC Press LLC
498 Electric Power Distribution Handbook
tion Power Quality (DPQ) study and the National Power Laboratory’s end-
use study.
NPL’s end-use study recorded power quality at the point of use at resi-
dential, commercial, and industrial customers. At 130 sites within the con-
tinental U.S. and Canada, single-phase line-to-neutral monitors were
connected at standard wall receptacles (Dorr, 1995). The survey resulted in
a total of 1200-monitor months of data. Table 10.4 shows the average number
of voltage sags that dropped below the given magnitude for longer than the
given duration.
EPRI’s Distribution Power Quality (DPQ) project recorded power quality
in distribution substations and on distribution feeders, measured on the
primary at voltages from 4.16 to 34.5 kV (EPRI TR-106294-V2, 1996; EPRI
TR-106294-V3, 1996). It was seen that 277 sites resulted in 5691 monitor-
months of data. In most cases three monitors were installed for each ran-
domly selected feeder, one at the substation and two at randomly selected
places along the feeder. Table 10.5 shows average numbers of voltage sags
for a given magnitude and duration for the DPQ data.
TABLE 10.4
Average Annual Number of Voltage Sags below the Given Magnitude for
Longer than the Given Duration from the NPL Data with a Five-Minute Filter
Magnitude
Duration
1 Cycle 6 Cycles 10 Cycles 20 Cycles 0.5 sec 1 sec 2 sec 10 sec
87% 126.4 56.8 36.4 27.0 23.0 18.1 14.5 5.2
80% 44.8 23.7 17.0 13.9 12.2 10.0 8.0 4.3
70% 23.1 17.3 14.5 12.8 11.5 9.7 7.9 4.3
50% 15.9 14.1 12.9 11.8 10.6 9.4 7.8 4.3
10% 12.2 12.0 11.7 11.0 10.2 9.0 7.5 4.2
Source: Dorr, D. S., Hughes, M. B., Gruzs, T. M., Juewicz, R. E., and McClaine, J. L.,
“Interpreting Recent Power Quality Surveys to Define the Electrical Environment,” IEEE
Transactions on Industry Applications, vol. 33, no. 6, pp. 1480–7, November 1997.
TABLE 10.5
Average Annual Number of Voltage Sags Below the Given Magnitude
for Longer than the Given Duration from the EPRI Feeder Data with a
Five-Minute Filter
Magnitude
Duration
1 Cycle 6 Cycles 10 Cycles 20 Cycles 0.5 sec 1 sec 2 sec 10 sec
90% 77.7 31.2 19.7 13.5 10.7 7.4 5.4 1.8
80% 36.3 17.4 12.4 9.3 7.9 6.4 4.9 1.7
70% 23.9 13.1 10.3 8.3 7.2 6.2 4.8 1.7
50% 14.6 9.5 8.4 7.5 6.6 5.9 4.6 1.7
10% 8.1 6.5 6.4 6.2 5.6 5.1 4.0 1.7
Source: Dorr, D. S., Hughes, M. B., Gruzs, T. M., Juewicz, R. E., and McClaine, J. L.,
“Interpreting Recent Power Quality Surveys to Define the Electrical Environment,” IEEE
Transactions on Industry Applications, vol. 33, no. 6, pp. 1480–7, November 1997.
1791_book.fm Page 498 Monday, August 4, 2003 3:20 PM
(C) 2004 by CRC Press LLC

Voltage Sags and Momentary Interruptions 499
As expected, the number of voltage sags is higher for the end-use NPL
study than for the primary-level DPQ study. At the point of use, the
nominal voltage is lower, which picks up more voltage sags, especially
minor sags. End-use monitoring also picks up events caused internally,
mainly voltage sags.
Table 10.6 shows cumulative numbers of voltage sags measured at sites
during the DPQ study. Table 10.4 and Table 10.5 presented results based on
averages — Table 10.6 shows the data based on the median, upper, and lower
quartiles. One use of it is to estimate the number of times a year disturbances
will affect a device — for example, if a device is sensitive to any event below
a voltage of 50% of nominal for longer than 0.1 sec, then Table 10.6 predicts
that at half of the sites in the U.S. distribution system, the device misoperates
more than 5.9 times per year.
As an indicator, the average misrepresents the typical site power quality.
The median represents site data better; here, by definition, 50% of sites have
values higher than the median, and 50% have values lower. With balanced
distributions such as the normal distribution, the average equals the median.
In a skewed distribution, the average is higher than the median. Additionally,
poor sites and anomalies such as a severe storm skew the average upward.
In the DPQ data, the average is 31 to 115% higher than the median depending
on the quality indicator as shown in Table 10.7.
10.5.1 Site Power Quality Variations
EPRI’s Distribution Power Quality (DPQ) project allows us the opportunity
to explore how power quality varies at different sites. Completed in 1995,
the DPQ project collected data from 24 utility systems at a total of 277
locations on 100 distribution system feeders over a 27-month period. Site
and circuit descriptors help us analyze the causes for site variations. Some
TABLE 10.6
Annual Number of Power Quality Events (Upper Quartile, Median, and Lower
Quartile) for the EPRI DPQ Feeder Sites with a One-Minute Filter
Note: A B C represent the lower quartile A, the median B, and the upper quartile C of the total
number of events below the given magnitude and longer than the given duration (up
to 1 min).
Duration, seconds
Vo ltage 0 0.02 0.05 0.1 0.2 0.5 1
0.9
32.8
57.5
104.830.8
49.0
95.124.4
35.3
65.613.6
22.7
38.77.6
13.2
24.03.3
7.3
14.21.4
3.2
8.9
0.8
16.4
31.6
54.114.8
26.0
50.112.1
20.9
37.98.1
15.0
25.14.9
9.6
16.92.4
5.3
11.00.9
2.7
7.5
0.7
10.1
20.5
33.88.6
18.8
32.78.1
15.3
27.65.8
11.3
18.84.0
7.8
13.51.8
4.5
9.30.9
2.5
7.0
0.5
4.7
9.7
19.24.5
9.0
17.44.2
7.7
14.33.5
5.9
11.22.3
5.0
9.61.4
3.3
7.70.8
2.2
5.7
0.3
2.1
4.8
12.81.8
4.5
11.01.6
4.2
9.51.4
3.6
8.61.1
3.5
8.30.8
2.8
6.60.5
1.6
5.1
0.1
0.9
3.2
8.30.9
2.9
7.80.8
2.8
7.80.8
2.7
7.80.7
2.7
7.80.5
2.2
6.10.3
1.6
4.9
1791_book.fm Page 499 Monday, August 4, 2003 3:20 PM
(C) 2004 by CRC Press LLC

500 Electric Power Distribution Handbook
notable details about the DPQ measurements and our analysis (Short et
al., 2002):
• All measurements were on the distribution primary. Of course, most
customers connect to the distribution secondary. Normally, this
means that a customer’s equipment sees more events below a given
threshold. Also note that for three-phase customers, a delta – wye
transformer distorts the secondary voltages relative to the primary
voltages.
• All data was measured at three-phase points on the distribution
circuit (single-phase locations were not monitored).
•We present all data based on the worst of the three phases, which
is conservative because most faults are single phase. Single-phase
customers see fewer sags. In addition, some three-phase equipment
is less sensitive to single-phase sags than to three-phase sags.
• Most of the measurements are from phase to ground (the monitors
on the ungrounded circuits show phase-to-phase measurements).
•We only used sites with at least 200 days of monitoring.
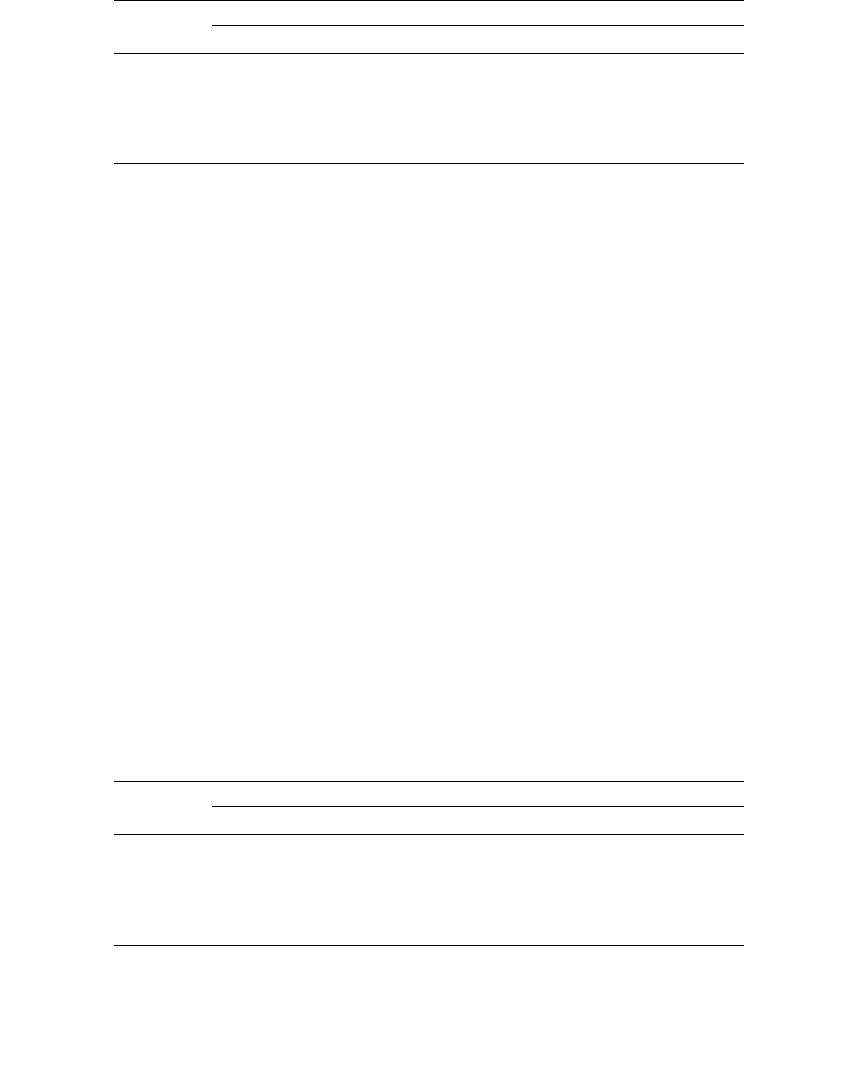
Power quality varies widely by site. Figure 10.12 shows cumulative dis-
tributions of different power quality indices along with statistics and a fit to
a log-normal distribution. The left column (SARFI 70, 50, and 10) gives the
average annual number of voltage sags below 70, 50, and 10%, which are
most applicable for relays, contactors, and other devices that drop out
quickly. SARFI
X
considers only short-duration rms events, defined as 1/2
cycle to one minute (IEEE Std. 1159-1995). The right column of Figure 10.12
shows data similar to the left column but for criteria that disregards very
short events. The ITI curve (Information Technology Industry Council, 2000)
disregards sags less than 0.02 sec, and the SEMI curve (SEMI F47-0200, 1999)
disregards sags less than 0.05 sec. The indices that exclude short events are
more appropriate for computer power supplies and other devices that ride
through short-duration events. SARFI
10
(>0.4sec)
is for momentary interruptions
greater than 0.4 sec, which differentiates between deep sags and total loss
of voltage due to operation of a breaker or recloser.
TABLE 10.7
Ratio of Median and Average for DPQ Site
Statistics at Feeder Sites
Median Average
Ratio of Average
to Median
SARFI
ITIC
21.27 27.86 131%
SARFI
SEMI
15.28 18.92 124%
SARFI
10
2.52 5.42 215%
1791_book.fm Page 500 Monday, August 4, 2003 3:20 PM
(C) 2004 by CRC Press LLC
Voltage Sags and Momentary Interruptions 501
FIGURE 10.12
Cumulative distributions of DPQ feeder data along with statistics for various indices. SARFI
70, 50, and 10 gives the number of voltage sags below 70, 50, and 10%. SARFI
ITIC
and SARFI
SEMI
are events below the ITI curve and the SEMI curve, respectively. The dotted line fits a log-
normal distribution.
P(75)=10.07
P(50)=20.50
P(25)=33.77
Mean=25.84
Log-normal fit
M=16.75
b= 1.10
0 20 40 60
P(75)= 4.66
P(50)= 9.69
P(25)=19.20
Mean=13.86
Log-normal fit
M= 8.15
b= 1.20
0 10 20 30
P(75)= 0.91
P(50)= 3.23
P(25)= 8.35
Mean= 6.52
Log-normal fit
M= 2.99
b= 1.32
0 5 10 15 20
P(75)=11.66
P(50)=21.26
P(25)=35.51
Mean=27.88
Log-normal fit
M=19.55
b= 0.94
0 20 40 60
P(75)= 8.42
P(50)=15.28
P(25)=24.11
Mean=18.75
Log-normal fit
M=13.02
b= 0.96
0 10 20 30 40
P(75)= 0.65
P(50)= 2.52
P(25)= 6.95
Mean= 5.33
Log-normal fit
M= 2.40
b= 1.31
0 5 10 15
0
25
50
75
100
Sarfi
70
0
25
50
75
100
Sarfi
50
0
25
50
75
100
Sarfi
10
0
25
50
75
100
Sarfi
ITIC
0
25
50
75
100
Sarfi
SEMI
0
25
50
75
100
Sarfi
10 (>0.4s)
Percent of locations
exceeding the x-axis value
Percent of locations
exceeding the x-axis value
Percent of locations
exceeding the x-axis value
1791_book.fm Page 501 Monday, August 4, 2003 3:20 PM
(C) 2004 by CRC Press LLC
502 Electric Power Distribution Handbook
The site data is not normally distributed. The site indices are nonnegative,
and the distribution skews upward; therefore, we need another distribution,
the log-normal, the Gamma, or the Weibull. Figure 10.12 includes fits to log-
normal distributions. The median (M) of the log-normal distribution equals
the mean of the natural log of the values (x
i
) raised to e: . The
log standard deviation is b = sd[ln(x
i
)].
10.5.2 Transmission-Level Power Quality
Large industrial customers, utility’s prize customers, are primarily fed with
transmission-level service and expect high-quality power. Several semicon-
ductor manufacturing sites provided a basis for developing the SEMI F47
standard for semiconductor tools (Stephens et al., 1999). These sites were
primarily served from transmission lines; not all were direct transmission
services, but distribution exposure was minimal. While not as extensive as
the DPQ study, the monitoring provides good data on the number of events
that are primarily from the transmission exposure. Table 10.8 shows sum-
mary statistics from the SEMI dataset of 16 sites with 30 total monitor-years
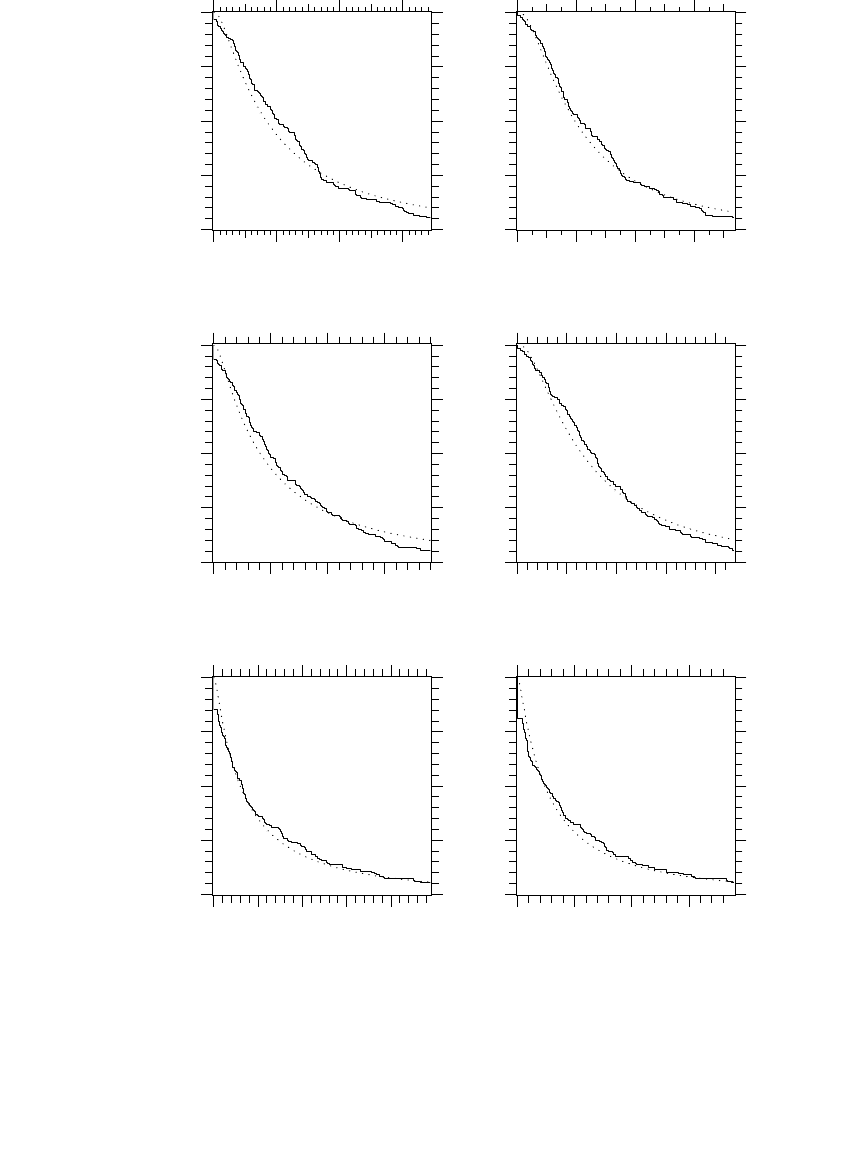
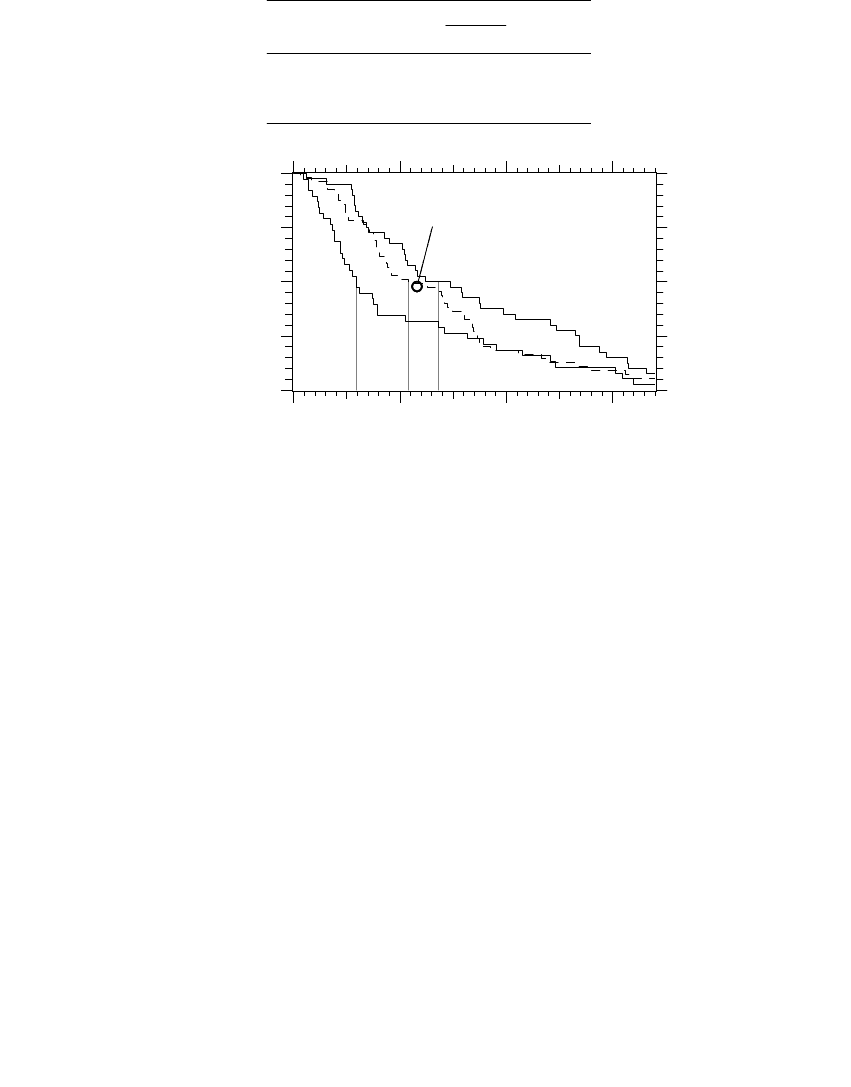
of data. Figure 10.13 compares distributions of SEMI data with the DPQ
substation data. As expected, the semiconductor manufacturing sites expe-
rience fewer events compared to the typical DPQ site. This comparison
provides some guidance on the portion of distribution events that are caused
on the transmission system. Use caution though since these are two inde-
pendent data sets.
10.6 Correlations of Sags and Momentaries
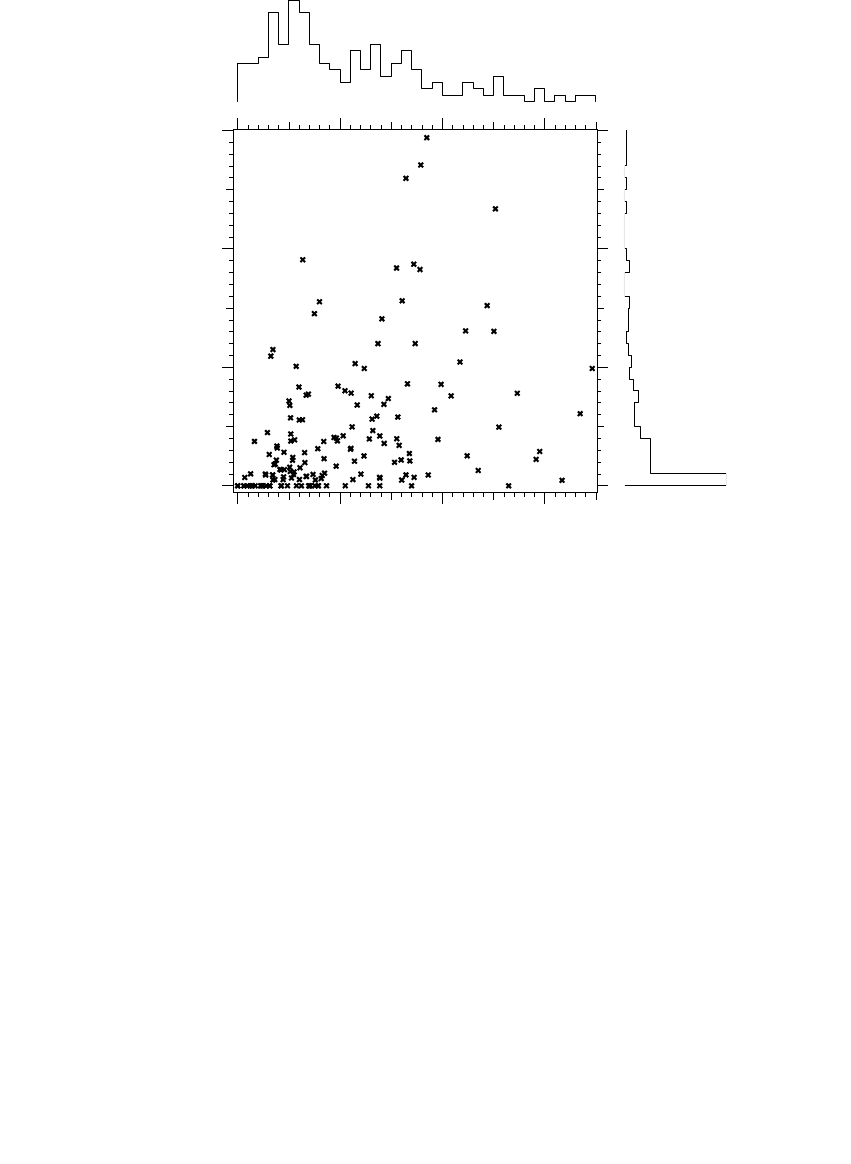
Figure 10.14 shows the number of momentary interruptions at a site plotted
against the number of voltage sags. We see that sites with high numbers of
TABLE 10.8
Statistics for Power Quality from the SEMI Monitoring
Study, Which Are Primarily Transmission Service
Average
Median
P(75%) P(50%) P(25%)
SARFI
ITIC
4.60 2.05 3.80 5.10
SARFI
SEMI
2.05 0.00 1.90 3.64
SARFI
70
4.40 2.05 3.50 5.10
SARFI
50
0.97 0.00 0.69 1.20
SARFI
10
0.24 0.00 0.00 0.23
Source: Stephens, M., Johnson, D., Soward, J., and Ammenheuser,
J., Guide for the Design of Semiconductor Equipment to Meet Voltage
Sag Immunity Standards, International SEMATECH, 1999. Tech-
nology Transfer #99063760B-TR, available at http://www.semat-
ech.org/public/docubase/document/3760btr.pdf.
Me
x
i
=
mean(ln( ))
1791_book.fm Page 502 Monday, August 4, 2003 3:20 PM
(C) 2004 by CRC Press LLC

Voltage Sags and Momentary Interruptions 503
momentary interruptions probably also have high numbers of voltage sags.
Sites with low numbers of momentary interruptions may have high or low
numbers of voltage sags. The correlation coefficient between sags and
momentaries for the DPQ sites is 44.8%.
Correlations between deep voltage sags and shallow sags are more pro-
nounced. SARFI
90
and SARFI
50
have a 56.9% correlation coefficient. If we
break the sites down by load density, the correlation coefficients improve to
90, 84, and 74% for urban, suburban, and rural sites.
10.7 Factors That Influence Sag and Momentary Rates
Power system faults cause voltage sags and momentary interruptions. The
frequency of faults depends on many factors including weather, mainte-
nance, and age of equipment. The protection schemes and location of circuit
FIGURE 10.13
Comparison of the 16 SEMI sites with the DPQ substation sites.
Distribution substation
sites (DPQ)
Transmission
sites (SEMI)
0 10 20 30 40
Distribution substation
sites (DPQ)
Transmission
sites (SEMI)
0 2 4 6
0
25
50
75
100
0
25
50
75
100
SARFI
ITIC
Percent of locations
exceeding the x-axis value
0
25
50
75
100
0
25
50
75
100
SARFI
10
Percent of locations
exceeding the x-axis value
1791_book.fm Page 503 Monday, August 4, 2003 3:20 PM
(C) 2004 by CRC Press LLC
504 Electric Power Distribution Handbook
interrupters determine whether a fault causes a voltage sag or an interrup-
tion, and the protection system determines the event duration. The following
sections describe work using EPRI’s DPQ data to investigate what factors
influence sags and momentaries (Short et al., 2002).
10.7.1 Location
Three monitors were used on each circuit in the DPQ study. One was always
at the substation, and two were on the feeder, named “feeder middle” and
“feeder end.” The feeder sites were randomly picked on the circuits, so the
naming is somewhat misleading; “feeder end” does not mean the most
distant point from the substation (it just means the most distant of the two
monitors randomly placed on the circuit). Since one third of the monitors
are at the substation, the set is biased to “near-substation” customers since
most customers are not located near the substation. Although there is some
difference between measurement locations, it turns out that it is not drastic.
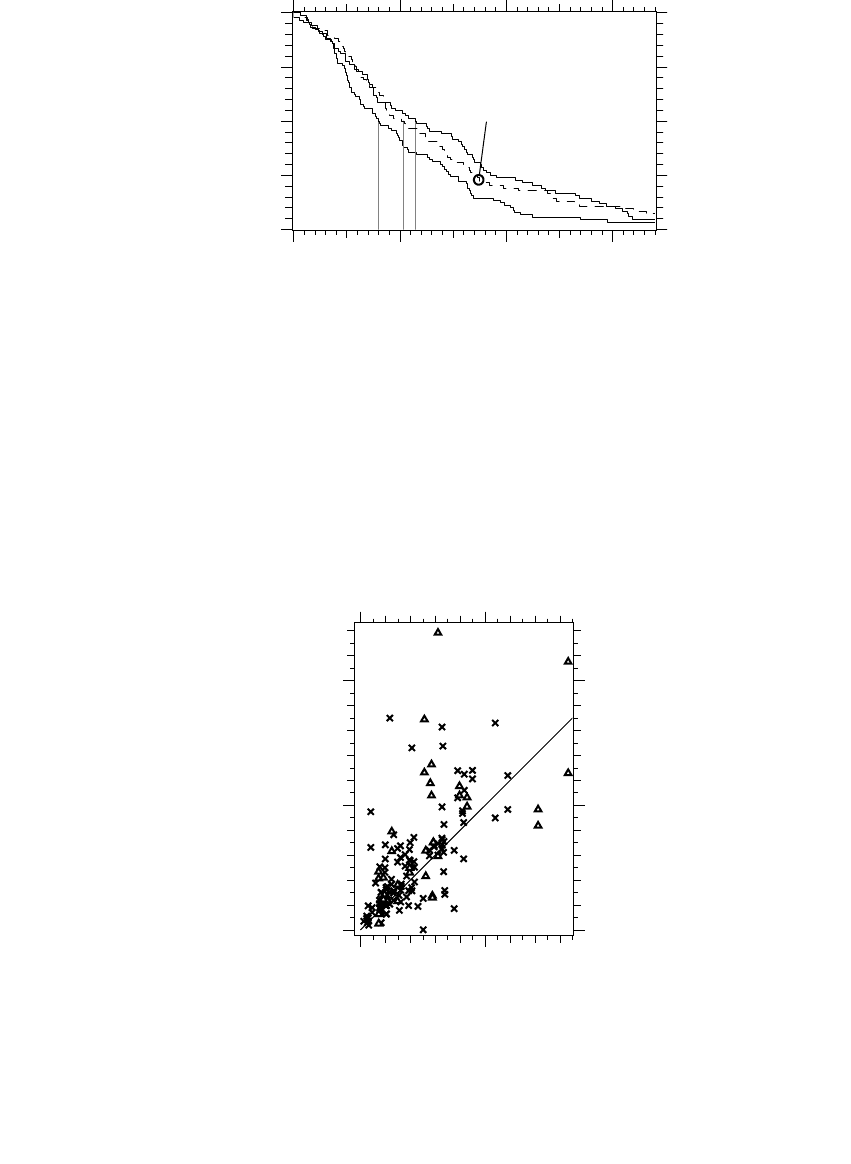
FIGURE 10.14
Relationship between voltage sags and momentary interruptions (greater than 0.4 sec). Each
point gives the average voltage sags and momentary interruptions at a site (n = 158).
0 20 40 60
0
10
20
30
Voltage sags (Sarfi
ITIC
- Sarfi
10
)
Momentary interruptions > 0.4 sec
(Sarfi
10
)
1791_book.fm Page 504 Monday, August 4, 2003 3:20 PM
(C) 2004 by CRC Press LLC
Voltage Sags and Momentary Interruptions 505
There is surprisingly little difference between the distributions of monitoring
locations (see Figure 10.15 for SARFI
ITIC
).
Figure 10.16 shows a more specific comparison of the substation’s perfor-
mance plotted against its two feeder sites. As expected, most feeder sites
have more sags than their substation site, especially rural sites. A significant
number of feeder sites were better than the substation. Measurement anom-
alies could produce this (the substation recorder is down for part of a bad
storm season), or it could be real (downstream regulation devices keep the
nominal voltage higher or the connected load “pushes” back on the source
FIGURE 10.15
Comparison of feeder sites and substation sites in the DPQ data for SARFI
ITIC
.
FIGURE 10.16
SARFI
ITIC
at substation sites plotted against SARFI
ITIC
at that substation’s feeder sites (triangles
indicate rural sites).
substation
feeder middle
feeder end
0 20 40 60
0
25
50
75
100
0
25
50
75
100
0
25
50
75
100
Sarfi
ITIC
Percent of locations
exceeding the x-axis value
0 50
0
50
100
Substation sites
Feeder sites
1791_book.fm Page 505 Monday, August 4, 2003 3:20 PM
(C) 2004 by CRC Press LLC
506 Electric Power Distribution Handbook
impedance during bus faults). For most of our analysis, we excluded sub-
station sites, thinking that the feeder sites better represent a random feeder
location where customers are fed.
10.7.2 Load Density
Rural sites have more voltage sags and momentary interruptions (see Table
10.9 and Figure 10.17). This is not surprising given the extra lengths of line
needed to serve load in low-density areas. Interruptions showed the most
dramatic difference.
Why do urban sites not have even more profoundly lower voltage sag
rates than suburban and rural sites? After all, urban sites are shorter and
mostly underground with fewer faults per mile. The main answer is that
urban sites have many more feeders off of a bus. In addition, even though
urban circuits are shorter, most of the exposure is close to the substation.
So, while many of the faults on rural and suburban circuits are too far
away to pull down the substation voltage, almost every fault on an urban
circuit causes a significant voltage sag for all customers off of that substa-
tion bus.
TABLE 10.9
Statistics for Momentary Interruptions
Longer than 0.4 sec
Median
P(75%) P(50%) P(25%)
Rural 2.37 8.56 18.31
Suburban 0.23 2.39 6.71
Urban 0.00 1.37 2.82
FIGURE 10.17
Comparison of urban, suburban, and rural sites for SARFI
ITIC
(feeder sites only).
urban
rural
suburban
0 20 40 60
0
25
50
75
100
0
25
50
75
100
0
25
50
75
100
Sarfi
ITIC
Percent of locations
exceeding the x-axis value
1791_book.fm Page 506 Monday, August 4, 2003 3:20 PM
(C) 2004 by CRC Press LLC