Wai-Fah Chen.The Civil Engineering Handbook
Подождите немного. Документ загружается.


50
-6
The Civil Engineering Handbook, Second Edition
50.2 Proportioning and Mixing Concrete
Proportioning Concrete Mix
A concrete mix is specified by the weight of water, sand, coarse aggregate, and admixture to be used per
94-pound bag of cement. The type of cement (Table 50.4), modulus of the aggregates, and maximum
size of the aggregates (Table 50.5) should also be given. A mix can be specified by the weight ratio of
cement to sand to coarse aggregate with the minimum amount of cement per cubic yard of concrete.
In proportioning a concrete mix, it is advisable to make and test trial batches because of the many
variables involved. Several trial batches should be made with a constant water-cement ratio but varying
TABLE 50.3
Standard Prestressing Strands, Wires, and Bars
Grade
Nominal Dimension
f
pu
Diameter Area Weight
Ten d o n Ty pe ksi in. in.
2
plf
Seven-wire strand 250 1/4 0.036 0.12
270 3/8 0.085 0.29
250 3/8 0.080 0.27
270 1/2 0.153 0.53
250 1/2 0.144 0.49
270 0.6 0.215 0.74
250 0.6 0.216 0.74
Prestressing wire 250 0.196 0.0302 0.10
240 0.250 0.0491 0.17
235 0.276 0.0598 0.20
Deformed prestressing bars 157 5/8 0.28 0.98
150 1 0.85 3.01
150 1
¼
1.25 4.39
150 1
⅜
1.58 5.56
Source:
Collins and Mitchell, 1991.
TA BLE 50.4
Types of Portland Cement*
Type Usage
IOrdinary construction where special properties are not required
II Ordinary construction when moderate sulfate resistance or moderate heat of hydration is desired
III When high early strength is desired
IV When low heat of hydration is desired
VWhen high sulfate resistance is desired
*According to ASTM C150.
TA BLE 50.5
Recommended Maximum Sizes of Aggregate*
Maximum Size, in., of Aggregate for
Minimum Dimension Reinforced-Concrete Heavily Lightly Reinforced
of Section, in. Beams, Columns, Walls Reinforced Slabs or Unreinforced Slabs
5 or less
¾
–1
½¾
–1
½
6–11
¾
–1
½
1
½
1
½
–3
12–29 1
½
–3 3 3–6
30 or more 1
½
–3 3 6
*
Concrete Manual.
U.S. Bureau of Reclamation.
© 2003 by CRC Press LLC

Structural Concrete Design
50
-7
ratios of aggregates to obtain the desired workability with the least cement. To obtain results similar to
those in the field, the trial batches should be mixed by machine.
When time or other conditions do not allow proportioning by the trial batch method, Table 50.6 may
be used. Start with mix B corresponding to the appropriate maximum size of aggregate. Add just enough
water for the desired workability. If the mix is undersanded, change to mix A; if oversanded, change to
mix C. Weights are given for dry sand. For damp sand, increase the weight of sand 10 lb, and for very
wet sand, 20 lb per bag of cement.
Admixtures
Admixtures may be used to modify the properties of concrete. Some types of admixtures are set accel-
erators, water reducers, air-entraining agents, and waterproofers. Admixtures are generally helpful in
improving quality of the concrete. However, if admixtures are not properly used, they could have
undesirable effects; it is therefore necessary to know the advantages and limitations of the proposed
admixture. The ASTM Specifications cover many of the admixtures.
Set accelerators are used (1) when it takes too long for concrete to set naturally, such as in cold weather,
or (2) to accelerate the rate of strength development. Calcium chloride is widely used as a set accelerator.
If not used in the right quantities, it could have harmful effects on the concrete and reinforcement.
Water reducers lubricate the mix and permit easier placement of the concrete. Since the workability
of a mix can be improved by a chemical agent, less water is needed. With less water but the same cement
content, the strength is increased. Since less water is needed, the cement content could also be decreased,
which results in less shrinkage of the hardened concrete. Some water reducers also slow down the concrete
set, which is useful in hot weather and in integrating consecutive pours of the concrete.
Air-entraining agents are probably the most widely used type of admixture. Minute bubbles of air are
entrained in the concrete, which increases the resistance of the concrete to freeze-thaw cycles and the use
of ice-removal salts.
Waterproofing chemicals are often applied as surface treatments, but they can be added to the concrete
mix. If applied properly and uniformly, they can prevent water from penetrating the concrete surface.
Epoxies can also be used for waterproofing. They are more durable than silicone coatings, but they may
TABLE 50.6
Typical Concrete Mixes*
Maximum
Size of
Aggregate,
in.
Mix
Designation
Bags of
Cement
per yd
3
of
Concrete
Aggregate, lb per Bag of Cement
Sand
Gravel or
Crushed Stone
Air-Entrained
Concrete
Concrete
Without Air
1/2 A 7.0 235 245 170
B 6.9 225 235 190
C 6.8 225 235 205
IA6.6 225 235 225
B 6.4 225 235 245
C 6.3 215 225 265
1A6.4 225 235 245
B 6.2 215 225 275
C 6.1 205 215 290
1½ A 6.0 225 235 290
B 5.8 215 225 320
C 5.7 205 215 345
2A5.7 225 235 330
B 5.6 215 225 360
C 5.4 205 215 380
*Concrete Manual, U.S. Bureau of Reclamation.
© 2003 by CRC Press LLC

50-8 The Civil Engineering Handbook, Second Edition
be more costly. Epoxies can also be used for protection of wearing surfaces, patching cavities and cracks,
and glue for connecting pieces of hardened concrete.
Mixing
Materials used in making concrete are stored in batch plants that have weighing and control equipment
and bins for storing the cement and aggregates. Proportions are controlled by automatic or manually
operated scales. The water is measured out either from measuring tanks or by using water meters.
Machine mixing is used whenever possible to achieve uniform consistency. The revolving drum-type
mixer and the countercurrent mixer, which has mixing blades rotating in the opposite direction of the
drum, are commonly used.
Mixing time, which is measured from the time all ingredients are in the drum, “should be at least
1.5 minutes for a 1-yd
3
mixer, plus 0.5 min for each cubic yard of capacity over 1 yd
3
” [ACI 304-73,
1973]. It also is recommended to set a maximum on mixing time since overmixing may remove entrained
air and increase fines, thus requiring more water for workability; three times the minimum mixing time
can be used as a guide.
Ready-mixed concrete is made in plants and delivered to job sites in mixers mounted on trucks. The
concrete can be mixed en route or upon arrival at the site. Concrete can be kept plastic and workable
for as long as 1.5 hours by slow revolving of the mixer. Mixing time can be better controlled if water is
added and mixing started upon arrival at the job site, where the operation can be inspected.
50.3 Flexural Design of Beams and One-Way Slabs
Reinforced Concrete Strength Beams
The basic assumptions made in flexural design are:
1. Sections perpendicular to the axis of bending that are plane before bending remain plane after bending.
2. A perfect bond exists between the reinforcement and the concrete such that the strain in the
reinforcement is equal to the strain in the concrete at the same level.
3. The strains in both the concrete and the reinforcement are assumed to be directly proportional
to the distance from the neutral axis (ACI 10.2.2) [ACI Committee 318, 1992].
4. Concrete is assumed to fail when the compressive strain reaches 0.003 (ACI 10.2.3).
5. The tensile strength of concrete is neglected (ACI 10.2.5).
6. The stresses in the concrete and reinforcement can be computed from the strains using stress-
strain curves for concrete and steel, respectively.
7. The compressive stress-strain relationship for concrete may be assumed to be rectangular, trape-
zoidal, parabolic, or any other shape that results in prediction of strength in substantial agreement
with the results of comprehensive tests (ACI 10.2.6). ACI 10.2.7 outlines the use of a rectangular
compressive stress distribution which is known as the Whitney rectangular stress block. For other
stress distributions see Reinforced Concrete Mechanics and Design by James G. MacGregor [1992].
Analysis of Rectangular Beams with Tension Reinforcement Only
Equations for M
n
and
f
M
n
: Tension Steel Yielding.
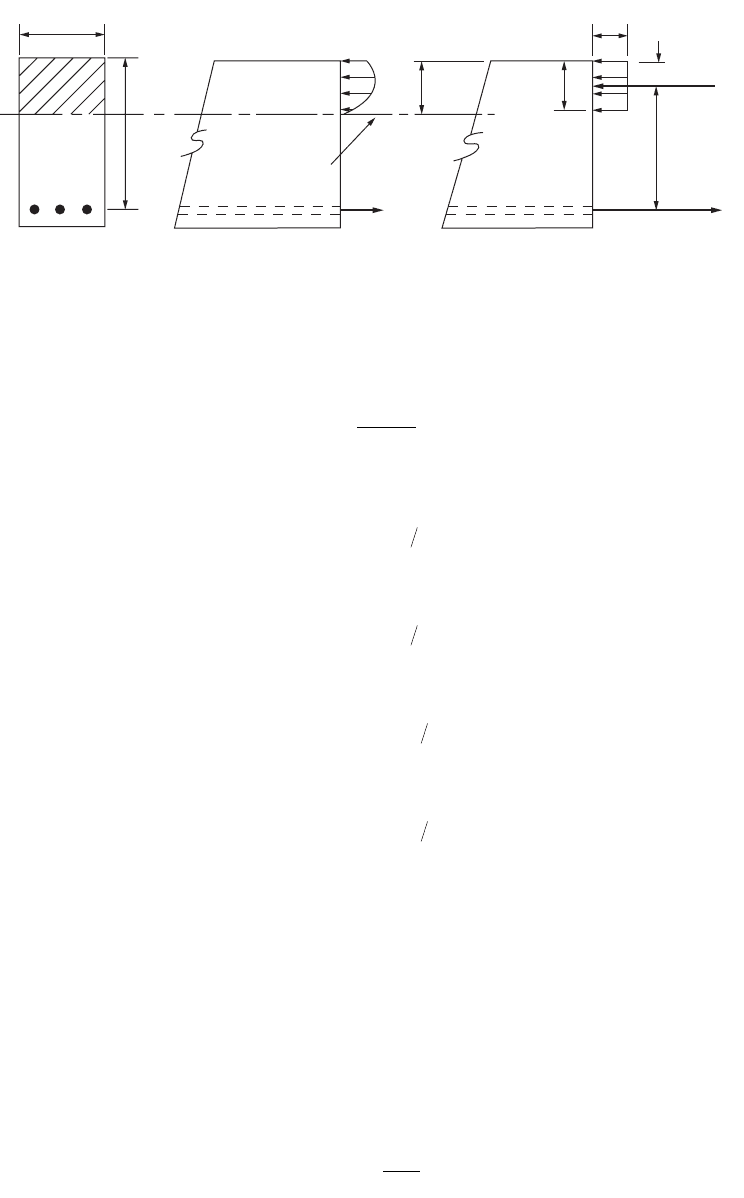
Consider the beam shown in Fig. 50.1. The compressive force, C, in the concrete is
(50.3)
The tension force, T, in the steel is
(50.4)
Cfba
c
=
¢
()
085.
TAf
sy
=
© 2003 by CRC Press LLC
Structural Concrete Design 50-9
For equilibrium, C = T, so the depth of the equivalent rectangular stress block, a, is
(50.5)
Noting that the internal forces C and T form an equivalent force-couple system, the internal moment is
(50.6)
or
fM
n
is then
(50.7)
or
where f = 0.90.
Equation for M
n
and
f
M
n
: Tension Steel Elastic.
The internal forces and equilibrium are given by:
(50.8)
From strain compatibility (see Fig. 50.1),
(50.9)
FIGURE 50.1 Stresses and forces in a rectangular beam. (Source: MacGregor, 1992.)
b
d
(a) Cross section.
a
/2
T
c
c
f
s
jd
=
d
-
a
/2
a
=
b
1
c
0.85
f
¢
c
Neutral axis
(Axis of zero strain)
(b) Actual stress
distribution.
(c) Equilvalent rectangular
stress distribution.
a
Af
fb
sy
c
=
¢
085.
MTda
n
=-
()
2
MCda
n
=-
()
2
ffMTda
n
=-
()
2
ffMCda
n
=-
()
2
CT
fba Af
fba bdE
css
css
=
¢
=
¢
=
085
085
.
. re
ee
scu
dc
c
=
-
Ê
Ë
Á
ˆ
¯
˜
© 2003 by CRC Press LLC
50-10 The Civil Engineering Handbook, Second Edition
Substituting e
s
into the equilibrium equation, noting that a = b
1
c, and simplifying gives
(50.10)
which can be solved for a. Equations (50.6) and (50.7) can then be used to obtain M
n
and fM
n
.
Reinforcement Ratios.
The reinforcement ratio, r, is used to represent the relative amount of tension reinforcement in a beam
and is given by
(50.11)
At the balanced strain condition the maximum strain, e
cu
, at the extreme concrete compression fiber
reaches 0.003 just as the tension steel reaches the strain e
y
= f
y
/E
s
. The reinforcement ratio in the balanced
strain condition, r
b
, can be obtained by applying equilibrium and compatibility conditions. From the
linear strain condition, Fig. 50.1,
(50.12)
The compressive and tensile forces are:
(50.13)
Equating C
b
to T
b
and solving for r
b
gives
(50.14)
which on substitution of Eq. (50.12) gives
(50.15)
ACI 10.3.3 limits the amount of reinforcement in order to prevent nonductile behavior:
(50.16)
ACI 10.5 requires a minimum amount of flexural reinforcement:
(50.17)
Analysis of Beams with Tension and Compression Reinforcement
For the analysis of doubly reinforced beams, the cross section will be divided into two beams. Beam 1
consists of the compression reinforcement at the top and sufficient steel at the bottom so that T
1
= C
s
;
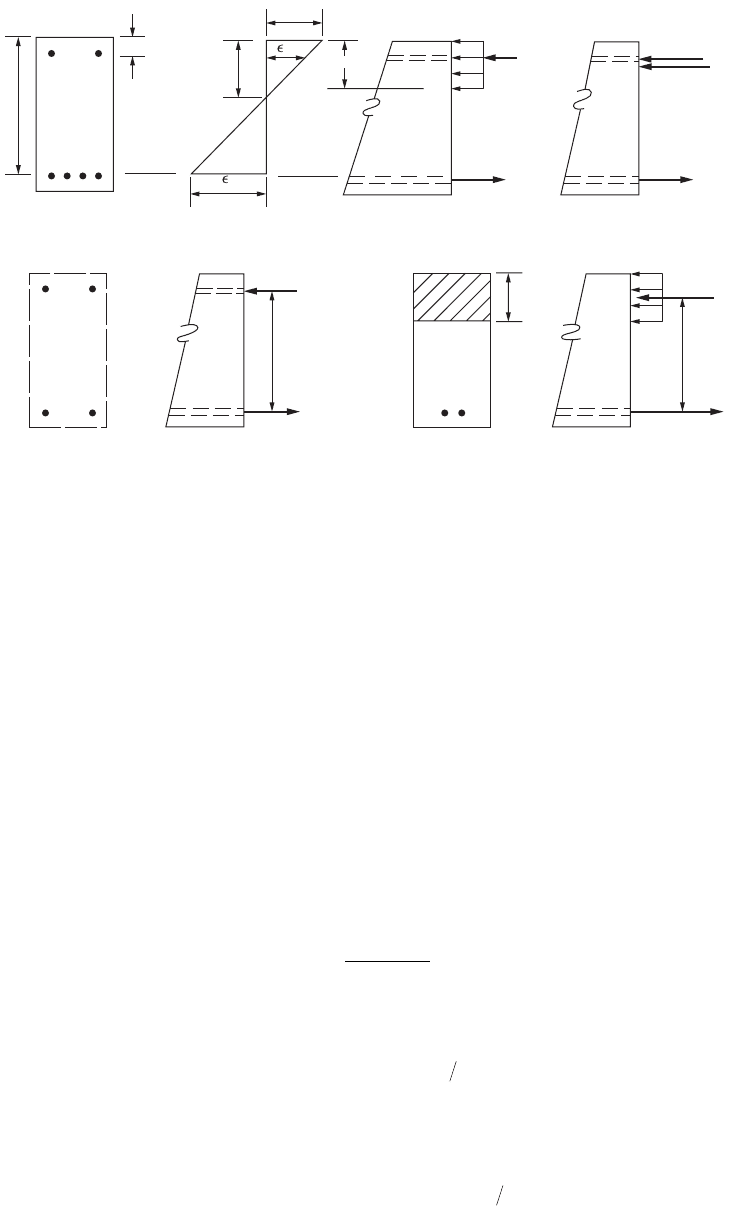
beam 2 consists of the concrete web and the remaining tensile reinforcement, as shown in Fig. 50.2.
085
0
2
1
2
.
¢
Ê
Ë
Á
ˆ
¯
˜
+
()
-=
f
E
adad
c
scu
re
b
r=
A
bd
s
c
d
f
f
bcu
cu y
y
y
=
+
=
+
=
+
e
ee
0 003
0 003
29 000 000
87 000
87 000
.
.
,,
,
,
Cfbc
TfA bdf
bcb
bysbby
=
¢
==
085
1
. b
r
r
b
b
c
y
b
f
f
c
d
=
¢
Ê
Ë
Á
ˆ
¯
˜
085
1
.
r
b
b
c
yy
f
ff
=
¢
+
Ê
Ë
Á
ˆ
¯
˜
085
87 000
87 000
1
.
,
,
max .rr= 075
b
r
min
=
200
f
y
© 2003 by CRC Press LLC
Structural Concrete Design 50-11
Equation for M
n
: Compression Steel Yields.
The area of tension steel in beam 1 is obtained by setting T
1
= C
s
, which gives A
s1
= A¢
s
.The nominal
moment capacity of beam 1 is then
(50.18)
Beam 2 consists of the concrete and the remaining steel, A
s2
= A
s
– A
s1
= A
s
– A¢
s
.The compression force
in the concrete is
(50.19)
and the tension force in the steel for beam 2 is
(50.20)
The depth of the compression stress block is then
(50.21)
Therefore, the nominal moment capacity for beam 2 is
(50.22)
The total amount capacity for a doubly reinforced beam with compression steel yielding is the summation
of the moment capacity for beam 1 and beam 2; therefore,
(50.23)
FIGURE 50.2 Strains, stresses, and forces in beam with compression reinforcement. (Source: MacGregor, 1992.)
A
¢
s
A
¢
s
C
s
=
A
¢
s
f
¢
s
(
d
-
d
¢)
T
1
=
A
s
1
f
y
A
s
1
A
s
2
a
¢
s
s
d
¢
d
c
a
=
b
1
c
0.85
f
¢
c
0.003
A
s
f
¢
s
C
s
C
c
(
d
-
a
/2)
T
2
=
A
s
2
f
y
C
c
T
f
s
=
f
y
(a) Section.
(e) Beam 1.
(f) Beam 2.
(b) Strain
distribution.
(c) Stress
distribution.
(d) Internal
forces.
MAfdd
nsy1
=
¢
-
¢
()
Cfba
c
=
¢
085.
TAAf
ssy
=-
¢
()
a
AAf
fb
ssy
c
=
-
¢
()
¢
085.
MAAfda
nssy2
2=-
¢
()
-
()
MAfdd AAfda
nsy ssy
-
¢
-
¢
()
+-
¢
()
-
()
2
© 2003 by CRC Press LLC
50-12 The Civil Engineering Handbook, Second Edition
Equation for M
n
: Compression Steel Does Not Yield.
Assuming that the tension steel yields, the internal forces in the beam are
(50.24)
where
(50.25)
From equilibrium, C
s
+ C
c
= T or
(50.26)
This can be rewritten in quadratic form as
(50.27)
where a can be calculated by means of the quadratic equation. Therefore, the nominal moment capacity
in a doubly reinforced concrete beam where the compression steel does not yield is
(50.28)
Reinforcement Ratios.
The reinforcement ratio at the balanced strain condition can be obtained in a similar manner as that for
beams with tension steel only. For compression steel yielding, the balanced ratio is
(50.29)
For compression steel not yielding, the balanced ratio is
(50.30)
The maximum and minimum reinforcement ratios as given in ACI 10.3.3 and 10.5 are
(50.31)
TAf
Cfba
CAE
sy
cc
ssss
=
=
¢
=
¢¢
()
085.
e
¢
=-
¢
Ê
Ë
Á
ˆ
¯
˜
()
e
b
s
d
a
10003
1
.
085 1 0003
1
..
¢
+
¢
-
¢
Ê
Ë
Á
ˆ
¯
˜
()
=fba AE
d
a
Af
css sy
b
085 0003 0 003 0
2
1
.. .
¢
()
+
¢
-
()
-
¢¢
()
=fba AE Af a AE d
csssyss
b
MCd
a
Cd d
nc s
=-
Ê
Ë
Á
ˆ
¯
˜
+-
¢
()
2
rr
b
-
¢
()
=
¢
+
Ê
Ë
Á
ˆ
¯
˜
b
c
yy
f
ff
085
87 000
87 000
1
.
,
,
r
rb
-
¢¢
Ê
Ë
Á
ˆ
¯
˜
=
¢
+
Ê
Ë
Á
ˆ
¯
˜
f
f
f
ff
s
y
b
c
yy
085
87 000
87 000
1
.
,
,
rr
r
max
min
.=
=
075
200
b
y
f
© 2003 by CRC Press LLC
Structural Concrete Design 50-13
Prestressed Concrete Strength Design
Elastic Flexural Analysis
In developing elastic equations for prestress, the effects of prestress force, dead load moment, and live
load moment are calculated separately, and then the separate stresses are superimposed, giving
(50.32)
where (–) indicates compression and (+) indicates tension. It is necessary to check that the stresses in
the extreme fibers remain within the ACI-specified limits under any combination of loadings that may
occur. The stress limits for the concrete and prestressing tendons are specified in ACI 18.4 and 18.5 [ACI
Committee 318, 1992].
ACI 18.2.6 states that the loss of area due to open ducts shall be considered when computing section
properties. It is noted in the commentary that section properties may be based on total area if the effect
of the open duct area is considered negligible. In pretensioned members and in post-tensioned members
after grouting, section properties can be based on gross sections, net sections, or effective sections using
the transformed areas of bonded tendons and nonprestressed reinforcement.
Flexural Strength
The strength of a prestressed beam can be calculated using the methods developed for ordinary reinforced
concrete beams, with modifications to account for the differing nature of the stress-strain relationship
of prestressing steel compared with ordinary reinforcing steel.
A prestressed beam will fail when the steel reaches a stress f
ps
, generally less than the tensile strength
f
pu
. For rectangular cross-sections the nominal flexural strength is
(50.33)
where
(50.34)
The steel stress f
ps
can b found based on strain compatibility or by using approximate equations such
as those given in ACI 18.72. The equations in ACI are applicable only if the effective prestress in the steel,
f
se
, which equals P
e
/A
ps
, is not less than 0.5 f
pu
. The ACI equations are as follows.
(a) For members with bonded tendons:
(50.35)
If any compression reinforcement is taken into account when calculating f
ps
with Eq. (50.35), the following
applies:
(50.36)
f
F
A
Fey
I
My
I
=- ± ±
MAfd
a
npsps
=-
2
a
Af
fb
ps ps
c
=
¢
085.
ff
f
f
d
d
ps pu
ppu
cp
=-
¢
+-
¢
()
È
Î
Í
Í
˘
˚
˙
˙
Ê
Ë
Á
ˆ
¯
˜
1
1
g
b
rww
rww
p
pu
cp
f
f
d
d
¢
+-
¢
()
È
Î
Í
Í
˘
˚
˙
˙
≥ 017.
© 2003 by CRC Press LLC

50-14 The Civil Engineering Handbook, Second Edition
and
(b) For members with unbonded tendons and with a span-to-depth ratio of 35 or less:
(50.37)
(c) For members with unbonded tendons and with a span-to-depth ratio greater than 35:
(50.38)
The flexural strength is then calculated from Eq. (50.33). The design strength is equal to fM
n
, where
f = 0.90 for flexure.
Reinforcement Ratios
ACI requires that the total amount of prestressed and nonprestressed reinforcement be adequate to
develop a factored load at least 1.2 times the cracking load calculated on the basis of a modulus of rupture
of 7.5 .
To control cracking in members with unbonded tendons, some bonded reinforcement should be
uniformly distributed over the tension zone near the extreme tension fiber. ACI specifies the minimum
amount of bonded reinforcement as
(50.39)
where A is the area of the cross section between the flexural tension face and the center of gravity of the
gross cross section. ACI 19.9.4 gives the minimum length of the bonded reinforcement.
To ensure adequate ductility, ACI 18.8.1 provides the following requirement:
(50.40)
ACI allows each of the terms on the left side to be set equal to 0.85 a/d
p
in order to simplify the equation.
When a reinforcement ratio greater than 0.36b
1
is used, ACI 18.8.2 states that the design moment
strength shall not be greater than the moment strength based on the compression portion of the moment
couple.
50.4 Columns under Bending and Axial Load
Short Columns under Minimum Eccentricity
When a symmetrical column is subjected to a concentric axial load, P, longitudinal strains develop
uniformly across the section. Because the steel and concrete are bonded together, the strains in the
¢
£dd
p
015.
ff
f
f
f
ps se
c
p
py
se
=+ +
¢
£
+
Ï
Ì
Ó
¸
˝
˛
10 000
100
60 000
,
,
r
ff
f
f
f
ps se
c
p
py
se
=+ +
¢
£
+
Ï
Ì
Ó
¸
˝
˛
10 000
300
30 000
,
,
r
¢
f
c
AA
s
= 0 004.
w
www
www
b
p
p
p
pw
p
ww
d
d
d
d
+
Ê
Ë
Á
ˆ
¯
˜
-
¢
()
+
Ê
Ë
Á
ˆ
¯
˜
-
¢
()
Ï
Ì
Ô
Ô
Ô
Ô
Ó
Ô
Ô
Ô
Ô
¸
˝
Ô
Ô
Ô
Ô
˛
Ô
Ô
Ô
Ô
£ 036
1
.
© 2003 by CRC Press LLC

Structural Concrete Design 50-15
concrete and steel are equal. For any given strain it is possible to compute the stresses in the concrete
and steel using the stress-strain curve for the two materials. The forces in the concrete and steel are equal
to the stresses multiplied by the corresponding areas. The total load on the column is the sum of the
forces in the concrete and steel:
(50.41)
To account for the effect of incidental moments, ACI 10.3.5 specifies that the maximum design axial load
on a column be, for spiral columns,
(50.42)
and for tied columns,
(50.43)
For high values of axial load, f values of 0.7 and 0.75 are specified for tied and spiral columns, respectively
(ACI 9.3.2.2b) [ACI Committee 318, 1992].
Short columns are sufficiently stocky such that slenderness effects can be ignored.
Short Columns under Axial and Bending
Almost all compression members in concrete structures are subjected to moments in addition to axial
loads. Although it is possible to derive equations to evaluate the strength of columns subjected to combined
bending and axial loads, the equations are tedious to use. For this reason, interaction diagrams for columns
are generally computed by assuming a series of strain distributions, each corresponding to a particular
point on the interaction diagram, and computing the corresponding values of P and M. Once enough
such points have been computed, the results are summarized in an interaction diagram. For examples on
determining the interaction diagram, see Reinforced Concrete Mechanics and Design by James G. MacGregor
[1992] or Reinforced Concrete Design by Chu-Kia Wang and Charles G. Salmon [1985].
Figure 50.3 illustrates a series of strain distributions and the resulting points on the interaction diagram.
Point A represents pure axial compression. Point B corresponds to crushing at one face and zero tension
at the other. If the tensile strength of concrete is ignored, this represents the onset of cracking on the
bottom face of the section. All points lower than this in the interaction diagram represent cases in which
the section is partially cracked. Point C, the farthest right point, corresponds to the balanced strain
condition and represents the change from compression failures for higher loads and tension failures for
lower loads. Point D represents a strain distribution where the reinforcement has been strained to several
times the yield strain before the concrete reaches it crushing strain.
The horizontal axis of the interaction diagram corresponds to pure bending where f = 0.9. A transition
is required from f = 0.7 or 0.75 for high axial loads to f = 0.9 for pure bending. The change in f begins
at a capacity fP
a
, which equals the smaller of the balanced load, fP
b
, or 0.1f ¢
c
Ag. Generally, fP
b
exceeds
0.1f ¢
c
Ag except for a few nonrectangular columns.
ACI Publications SP-17A(85), A Design Handbook for Columns, contains nondimensional interaction
diagrams as well as other design aids for column [ACI Committee 340, 1990].
Slenderness Effects
ACI 10.11 describes an approximate slenderness-effect design procedure based on the moment magnifier
concept. The moments are computed by ordinary frame analysis and multiplied by a moment magnifier
that is a function of the factored axial load and the critical buckling load of the column. The following
gives a summary of the moment magnifier design procedure for slender columns in frames.
PfAAfA
ocgstyst
=
¢
-
()
+085.
ffPfAAfA
n
cg st yst
max
..
()
=
¢
-
()
+
[]
085 85
ffPfAAfA
n
cg st yst
max
..
()
=
¢
-
()
+
[]
080 85
© 2003 by CRC Press LLC