Wai-Fah Chen.The Civil Engineering Handbook
Подождите немного. Документ загружается.

56-18 The Civil Engineering Handbook, Second Edition
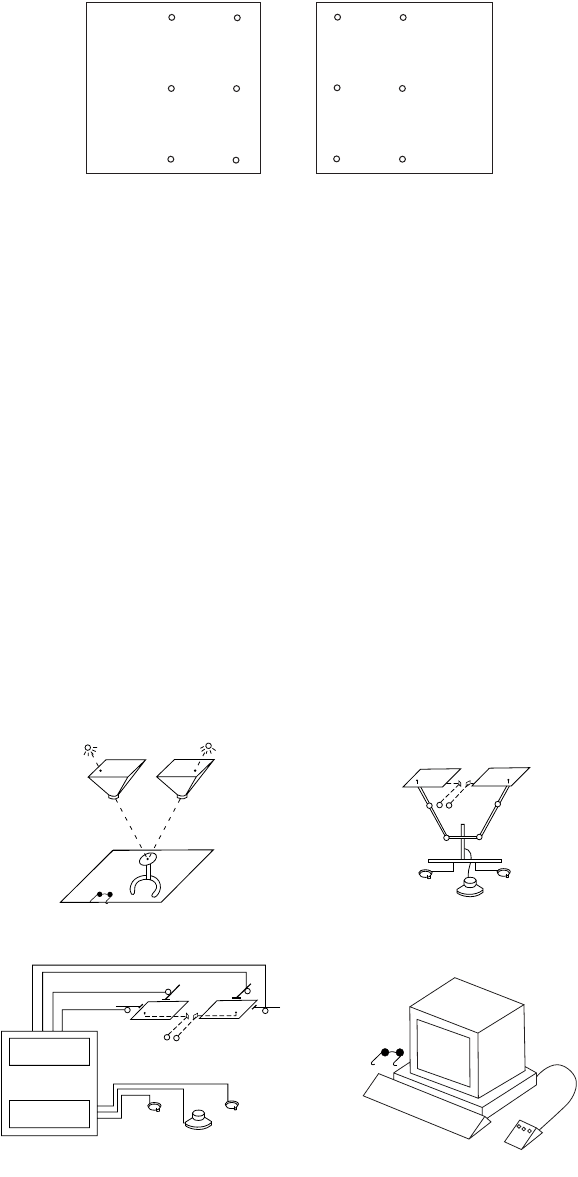
If there is parallax at point 6, the procedure is repeated until no parallax is seen at point 6. Convergence
can be speeded up by overcorrecting by about half at step 5. When this is complete, the entire model
should be free of y-parallax. If there is visible parallax at other points, it could be due to uncompensated
lens distortion, excessive film deformation, or other factors. Following relative orientation comes the
absolute orientation, in which the relation is established between the model coordinates and the ground
coordinates, defined by control points in the model. In the past this was done by physically orienting a
map manuscript to a mechanical tracing device. This physical procedure would involve scaling, by
adjusting the base components, and leveling, by adjusting either common rotation elements or combi-
nations of projector rotations and corresponding base components. Now it is done analytically by
computing the parameters of the three-dimensional similarity transformation between the model and
ground coordinates. The computed rotations would then be introduced into the instrument as before.
This computationally assisted absolute orientation requires that the instrument be fitted with position
encoders for coordinate readout of xyz model coordinates. Accuracies on the order of 5 micrometers are
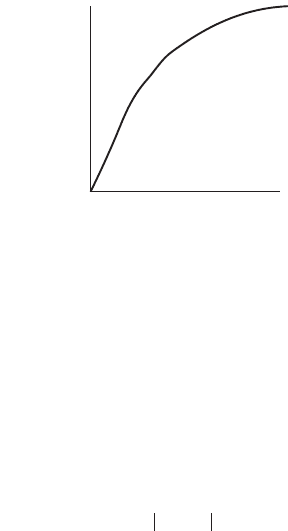
typically seen for this task. Schematic depictions of an optical and a mechanical stereo restitution
instrument are shown in Fig. 56.14(a) and (b). In addition to map compilation of planimetry and
elevation data, an analogue stereo instrument can also be used to collect model coordinates for indepen-
dent model aerial triangulation. This requires an additional step of determining the model coordinates
of the perspective center, which is necessary to link adjacent models in a strip.
All of the functions of an analogue instrument can be duplicated and usually exceeded in an analytical
plotter. Such a device, shown schematically in Fig. 56.14(c), consists of two computer-controlled stages,
FIGURE 56.13 Point layout for relative orientation.
FIGURE 56.14 Schematic diagrams of stereo restitution instruments.
3
1
5
4
2
6
3
1
5
4
2
6
(a) Optical
(b) Mechanical
(d) Digital/Softcopy
(c) Analytical
Stage Position
Output
Computer
Operator
Input
© 2003 by CRC Press LLC
Photogrammetry and Remote Sensing 56-19
a viewing stereomicroscope, operator controls for three-axis motion, and a suite of computer software
to automate and assist in all of the desired operations. Interior orientation consists of measuring the
fiducial marks and introducing the calibrated camera parameters. Relative orientation consists of mea-
suring conjugate points and computing the five orientation parameters. Absolute orientation consists of
measuring the control points and computing the seven-parameter transformation as above. Of course,
the two steps of relative and absolute orientation can be combined in a two-photo bundle solution using
the collinearity equations as described previously. In addition to conventional map compilation, analytical
plotters are well suited to aerial triangulation and block adjustment, digital elevation model collection,
cross section and profile collection, and terrestrial or close-range applications. Stage accuracies are
typically 1 or 2 micrometers. Today one would always have a CAD system connected to the instrument
for direct digitizing of features into the topographic or GIS database.
The most recent variant on the stereo viewer/plotter is the softcopy stereo system. Here the stereo
images are presented to the operator on a computer video monitor. This is shown schematically in
Fig. 56.14(d). In the two previous cases the input materials were hardcopy film transparencies. In this
case the input material is a pair of digital image files. These usually come from digitized photographs,
but can also come from sensors which provide digital image data directly, such as SPOT. Softcopy stereo
systems present interesting comparisons with hardcopy-based instruments. Spatial resolution may be
inferior to that visible in the original hardcopy image, depending on the resolution and performance of
the scanner, but possibilities for automation and operator assistance by digital image processing are
abundant and are being realized today. In addition, the complicated task of overlaying vector graphics
onto the stereo images in a hardcopy instrument becomes a simple task in a softcopy environment. This
can be enormously beneficial for editing and completeness checking. The orientation aspect of a softcopy
system is very similar to the analytical plotter in that all computations for orientation parameters are
done via computer from image coordinate input. The dramatic impact of softcopy systems will not be
apparent until specialized image processing tools for feature extraction and height determination are
improved to the point that they can reliably replace manual operation for substantial portions of the
map compilation task. A few definitions are now presented to encourage standardized terminology. Digital
mapping refers to the collection of digital map data into a CAD or GIS system. This can be done from
any type of stereo device: analogue, analytical, or softcopy. Digital photogrammetry refers to any photo-
grammetric operations performed on digital images. Softcopy photogrammetry is really synonymous with
digital photogrammetry, with the added connotation of softcopy stereo viewing.
Scanners
With the coming importance of digital photogrammetry, scanners will play an important role in the
conversion of hardcopy photograph transparencies into digital form. For aircraft platforms, and therefore
for the majority of large scale mapping applications, film-based imaging is still preferred because of the
high resolution and the straightforward geometry of non-time-dependent imagery. Thus arises the need
for scanning equipment to make this hardcopy imagery available to digital photogrammetric worksta-
tions. To really capture all of the information in high-performance film cameras, a pixel size of about
5 micrometers would be needed. Because of large resulting file sizes, many users are settling for pixel
sizes of 12 to 30 micrometers. For digital orthophotos, sometimes an even larger size is used. Table 56.1
shows the relation between pixel size and file size for a 230-mm square image assuming no compression
and assuming that each pixel is quantized to one of 256 gray levels (8 bits).
There are three main scanner architectures: (1) drum with a point sensor, usually a PMT (photomultiplier
tube); (2) flatbed with area sensor; and (3) flatbed with linear sensor. Radiometric response of a scanner
is usually set so that the imagery uses as much of the 256 level gray scale as possible. The relation between
gray level and image density should be known from system calibration. In some cases, gray values can be
remapped so that they are linear with density or transmittance. Most photogrammetric scanners produce
color by three passes over the imagery with appropriate color filters. These can be recorded in a band
sequential or band interleaved manner as desired. There are a large number of image file formats in use.
© 2003 by CRC Press LLC

56-20 The Civil Engineering Handbook, Second Edition
Plotters
Until recently the majority of engineering mapping (as opposed to mass production mapping) has been
produced on vector plotters. These produce vector line work on stable base material. They are usually
based on a rotating drum for one axis and a moving pen carriage for the other axis. Flatbed designs also
exist with a two-axis cross-slide for the pen carriage. These have the additional possibility to handle
scribing directly in addition to ink. Electrostatic plotters are essentially raster plotters which may emulate
a vector plotter by vector to raster conversion. Digital photogrammetry, with the integration of images
and vectors, requires a raster-oriented device. Likewise GIS, which often calls for graphic presentations
with area fills or raster layers, may require a raster device.
56.5 Photogrammetric Products
Topographic Maps
The classical product of photogrammetric compilation is a topographic map. A topographic map consists
typically of planimetric features such as roads, buildings, and waterways, as well as terrain elevation
information usually in the form of contours. In the past these were manually drafted in ink or scribed
onto scribe coat material. Today they are recorded directly into a CAD system or GIS. U.S. National Map
Accuracy Standards (NMAS) dictate an accuracy of planimetric features as well as contour lines, which
is tied to hard copy scale. In the digital environment, such standards may need to be revised to reflect
the increasingly prominent role of the (scaleless) digital map representation. The following is a summary
of the Office of Management and Budget standards:
1. Horizontal accuracy. For maps with publication scale greater than 1:20,000, not more than 10% of
the “well-defined” points tested shall be in error by more than 1/30th of an inch at publication scale.
For maps with publication scale less than 1:20,000, the corresponding tolerance is 1/50th of an inch.
2. Vertical accuracy. Not more than 10% of the elevations tested shall be in error by more than one-
half contour interval. Allowances are made for contour line position errors as above.
3. Any testing of map accuracy should be done by survey systems of a higher order of accuracy than
that used for the map compilation.
4. Published maps meeting these accuracy requirements shall note this fact in their legends, as follows:
“This map complies with national map accuracy standards.”
5. Published maps whose errors exceed these limits shall omit from their legends any mention of
compliance with accuracy standards.
6. When a published map is a considerable enlargement of a map designed for smaller-scale publi-
cation, this fact shall be stated in the legend. For example, “This map is an enlargement of a
1:20,000 scale map.”
Other commonly accepted accuracy standards are as follows. Reference grid lines and control point
positions should be within 1/100th of an inch of their true position. Ninety percent of spot elevations
TA BLE 56.1 File Sizes for Given
Pixel Sizes
Pixel Size File Size, 230-mm Image
5 mm 2.1 Gb
10 mm 530 Mb
15 mm 235 Mb
20 mm 130 Mb
25 mm 85 Mb
50 mm 21 Mb
100 mm5 Mb
© 2003 by CRC Press LLC
Photogrammetry and Remote Sensing 56-21
should be accurate to within one-fourth contour interval, and the remaining 10% shall not be in error
by more than one-half contour interval.
Image Products
Image products from photogrammetry include uncontrolled mosaics, controlled mosaics, rectified
enlargements, and orthophotos. Mosaics are collections of adjoining photograph enlargements mated in
a way to render the join lines as invisible as possible. In the case of controlled mosaics, the photographs
are enlarged in a rectifier, using control points to remove the effects of camera tilt, and to bring all
enlargements for the mosaic to a common scale. Uncontrolled mosaics are similar except that no tilt
removal is done, enlargement scales are less accurately produced, and continuity is attempted by the
careful matching of image features. In the past all mosaicking has been done with paper prints, glue, and
considerable manual dexterity. If the photographs are scanned, or if the imagery is originally digital, then
the mosaicking process can be entirely digital. Digital techniques allow great flexibility for such tasks as
tone matching, scaling, rectifying, and vector/annotation addition. Orthophotos are photographs which
have been differentially rectified to remove both tilt displacements as well as relief displacements. A well-
produced orthophoto can meet horizontal map accuracy standards, and can function as a planimetric
map. Individual orthophotos can be further merged into orthophoto mosaics. Digital techniques for
orthophoto production are also becoming very popular because of the flexibility mentioned above. People
who are not mapping specialists seem to have a particularly easy time interpreting an orthophoto,
compared to an abstract map with point, line, and area symbology that may be unfamiliar. With digital
orthophoto generation, it is particularly effective to overlay contour lines on the imagery.
Digital Elevation Models
The concept of digitally recording discrete height points to characterize the topographic surface has been
in practice for a number of years. Names and acronyms used to describe this concept include DTM,
digital terrain model; DEM, digital elevation model; DHM, digital height model; and DTED, digital terrain
elevation data. The philosophy behind this concept is that one obtains sufficient digital data to describe
the terrain, and then generates graphic products such as contours or profiles only as a means for
visualizing the terrain. This is in contrast to the conventional practice of recording a contour map and
having the contours be the archival record which represents the landforms. The advantage of the DEM
approach is that the height database can be used for several different applications such as contour
generation, profile/cross section generation, automated road design, and orthophoto interpolation con-
trol. Potential pitfalls in this approach mostly revolve around decisions to balance the conflicting demands
of accurate terrain representation versus fast data collection and reasonable file sizes. There are basically
two alternatives to consider when collecting such data: random data points selected to describe the terrain,
or a regular grid of points, with interval selected to describe the terrain.
Random Data Points
Random data points in a DEM may be used directly in a TIN, triangulated irregular network, or they
may be used to interpolate a regular grid via a variety of interpolation methods. The TIN may be created
by a number of algorithms which are producing the equivalent Dirichlet tessellation, Thiesson Polygons,
or the Delauney triangulation. One of the simpler methods is the basic Watson algorithm, described by
the following steps:
1. Create three fictitious points such that the defined triangle includes all of the data points.
2. Pick a point.
3. Find all of the triangles whose “circumcircle” (the circle passing through triangle vertices) contains
the point.
4. The union of all triangles in step 3 forms an “insertion polygon.”
5. Destroy all internal edges in the insertion polygon, and connect the current point with all vertices
of the polygon.
© 2003 by CRC Press LLC
56-22 The Civil Engineering Handbook, Second Edition
6. Go to step 2, until no more points are left.
7. When done, eliminate any triangle with a vertex consisting of one of the initial three fictitious
points.
To enforce a breakline, one can overlay the breakline on the preliminary TIN, and introduce new
triangles as required by the breakline. Interpolation within a TIN usually means locating the required
triangular plane facet, and evaluating the plane for Z as a function of X and Y. Contour line generation
is particularly easy within the triangular plane facets, with all lines being straight and parallel. Connecting
contour lines between facets requires a searching and concatenation operation.
Interpolation in a random point DEM not organized as a TIN can be carried out by various moving
surface methods, or by linear prediction. An example of a moving surface model would be a moving
“tilted” plane:
(56.47)
One equation is written for each point within a certain radius, possibly with weighting inversely related
to distance from desired position, and the three parameters are solved for, thereby allowing an estimate
of the interpolated height. Such moving surface models can be higher-order polynomials in two dimen-
sions, as dictated by point density and terrain character. With linear prediction, an elevation is interpo-
lated as follows:
(56.48)
where z is an n ¥ 1 vector representing height points in the vicinity of the point to be interpolated, S
zz
is an n ¥ n matrix of covariances between the reference points, usually based on distance, and is an
n ¥ 1 vector representing the covariances between the point to be interpolated and the reference points,
again based on distance. Breaklines can be enforced in these methods by not allowing reference points
on one side of the break to influence interpolations on the other side of the break.
Gridded Data Points
Points can be easily collected directly in a regular grid by programming an analytical stereo instrument
to move in this pattern. Grids may also be “created” by interpolating at grid “posts” using random data
as outlined above. Interpolation within a regular grid could be done by the methods outlined for random
points, but is more often done by bilinear interpolation. Bilinear interpolation can be done by making
two linear interpolations along one axis, followed by a single linear interpolation along the other axis.
Alternatively, one could solve uniquely for the following four parameters a, b, c, d at the grid cell corners,
and evaluate the equation at the unknown point. x and y can be local grid cell coordinates.
(56.49)
Contouring is also relatively straightforward in a gridded DEM by linear interpolation along the edges
of each grid cell. An ambiguity may arise when there is the same elevation on all four sides of the grid cell.
Geographic Information Systems and Photogrammetry
Historically, map data collected over the same region for different purposes was typically stored separately
with no attempts at registration and integration. Likewise, textual attribute data describing the map
features were likely kept in yet another storage location. Increasingly, the trend, particularly for munic-
ipalities, is to coregister all of this diverse map and attribute data within a geographic information system,
or GIS. The photogrammetric process typically plays a very important role in creating the land base, or
land fabric, based on well-defined geodetic control points, to which all other GIS data layers are registered.
Photogrammetry also plays a role in making periodic updates to the GIS land base in order to keep it
current with new land development, subdivision, or construction. The photogrammetric compiler may
za
0
a
1
xa
2
y++=
z
0
s
zz
0
t
S
zz
1–
z=
s
zz
0
zabxcy dxy+++=
© 2003 by CRC Press LLC

Photogrammetry and Remote Sensing 56-23
also be involved in collecting facilities features and tagging them with attributes or linking them to existing
attribute records in a facilities database.
56.6 Digital Photogrammetry
The term digital photogrammetry refers to photogrammetric techniques applied to digital imagery. The
current trend in favor of digital photogrammetry has been driven by the enormous increase in computer
power and availability, and the advances in image capture and display techniques.
Data Sources
Digital image data for photogrammetry can come from a number of sources. Satellite imagers transmit
data directly in digital form. Primary among the satellite sources would be SPOT and Landsat, each with
a series of spacecraft and sensors to provide continuous availability of imagery. Digital cameras for
airborne or terrestrial use have up to now been a minor contributor as source imagery for photogram-
metry. This is principally due to the limited size and density of sensor element packing for area sensors,
and to the adverse restitution capabilities with linear sensors using motion-induced scanning. The
predominant source of digital imagery for engineering photogrammetry is the scan conversion of con-
ventional film transparencies on high-accuracy scanning systems. Such image data is typically collected
as 8-bit (256 level) gray values for monochrome imagery, or as 3 ¥ 8-bit red, green, and blue components
for color imagery. Monochrome digital images are stored as a raster, or rectangular grid format. For fast
access they may also be tiled, or subdivided into subgrids. Color images may be stored in band sequential
or band interleaved order.
Digital Image Processing Fundamentals
Sampling
Digital image data is generated by sampling from a continuous source of incident radiation. In the case
of direct imaging, the source is truly continuous; in the case of sampling from a silver-halide emulsion
image, the source is usually of sufficiently higher resolution as to be effectively continuous. The sampling
theorem states that for a band-limited spatial signal with period T corresponding to the highest frequency
present, we must sample it with a period no greater than T/2 in order to be able to reconstruct it without
error. If there are frequencies present which are higher than can be reconstructed, aliasing will occur and
may be visible in the reconstructed image as moiré patterns or other effects. If this is the case, one should
purposely blur or defocus the image until the maximum frequencies present are consistent with the
sampling interval. This creates an antialiasing filter. The sampled image will be referred to as F(x, y). The
gray values recorded in the digital image may represent estimates of well-defined photometric quantities
such as irradiance, density, or transmittance. They may also be a rather arbitrary quantization of the
range of irradiance levels reaching the sensor.
Histogram Analysis and Modification
The histogram of a digital image is a series of counts of frequency of occurrence of individual gray levels
or ranges of gray levels. It corresponds to the probability function or probability density function of a
random variable. Any operation on an image, A,
(56.50)
in which the output gray level at a point is a function strictly of the input gray level is referred to as a
point operation and will result in a modification of the histogram. If an image operation is a function of
the position as well as the input gray level,
(56.51)
Bxy,()fAxy,()[]=
Bxy,()fAxy,()xy,,[]=
© 2003 by CRC Press LLC
56-24 The Civil Engineering Handbook, Second Edition
This may be referred to as a spatially variant point operation. It will result in a modification of the
histogram that is position dependent. This would be used to correct for a sensor which has a position-
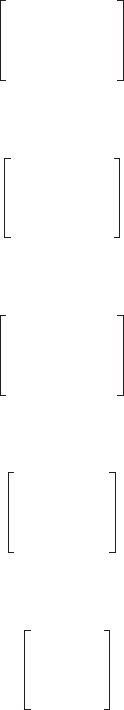
dependent response. To illustrate a point operation, function f (D) in Fig. 56.15 maps an input gray level
D
A
to an output gray level D
B
. We assume for simplicity that f is monotone increasing or decreasing, and
therefore has an inverse. The output histogram, H
B
(D), as a function of the input histogram, H
A
(D), and
of the function, f, is
(56.52)
This is analogous to the transformation of distributions based on a functional relation between random
variables. Other common applications of histogram modification include contrast stretching and bright-
ness shifting, that is, gain and offset.
Resampling, Geometric Image Manipulation
Whenever the geometric form of an image requires modification, resampling is necessary. This is really
just two-dimensional interpolation. Examples of such geometric modifications are rotation, rectification,
and epipolar line extraction. If a simple change of scale is desired, magnification can be accomplished
by pixel replication, and minification can be accomplished by pixel aggregation, or more quickly (with
aliasing) by subsampling. For the resampling task, the fastest method is nearest neighbor, which assigns
the gray level of the nearest pixel center to the point being interpolated. The most common method
would be bilinear interpolation. This math model was described under digital elevation models. Less
common would be interpolation by higher-order polynomials, such as cubic polynomials. As an example,
the process to generate a digital orthophoto can be easily summarized in this context. A grid is defined
in object space, which represents the locations of the “output” pixels. The elevation for these points is
observed directly or interpolated from a digital terrain model. Each of these (XYZ) object points is passed
through the collinearity equations using the known orientation of an image, and image coordinates are
obtained. These image coordinates are transformed into the row/column coordinate space of the digital
image. If the output spacing is on the order of the digital image pixel spacing, bilinear interpolation can
be used to interpolate the orthophoto pixel gray level. If the output spacing is much greater than the
image spacing, the output gray value should be obtained by averaging over all image pixels within the
larger pixel coverage, thus avoiding aliasing problems.
Filtering
For continuous functions in one dimension, convolution is expressed as
(56.53)
FIGURE 56.15 Gray level remapping.
255
255
D
B
Output
Gray
Level
0
0
D
A
Input Gray Level
H
B
D()
H
A
f
1–
D()[]
df dD§
-----------------------------=
yt()
f
*
gf
t
()gt
t
–()
t
d
•–
•
Ú
==
© 2003 by CRC Press LLC
Photogrammetry and Remote Sensing 56-25
For continuous functions in two dimensions, convolution is given by
(56.54)
For discrete two-dimensional functions, that is, images, convolution is given by
(56.55)
Image enhancements and feature exaggeration can be introduced by convolving the following 3 ¥ 3
kernels with an image. For an edge parallel to azimuth 90 degrees,
(56.56)
For an edge parallel to azimuth 135 degrees,
(56.57)
For general edge sharpening via a Laplacian,
(56.58)
For an edge parallel to azimuth 0 degrees using a Sobel operator,
(56.59)
For low pass filtering,
(56.60)
Matching Techniques
Digital image matching represents one of the means by which digital photogrammetry can potentially
far exceed the productivity of conventional photogrammetry. Point mensuration and stereo compilation
are tasks requiring skilled operators if done manually, and few means are available to speed up the manual
process. Point mensuration and stereo “perception” by image matching will increase in speed with each
advance in computer technology, including parallel processing. Point mensuration occurs at numerous
stages in the photogrammetric restitution process, such as interior orientation (fiducial marks), relative
hxy,()
f
*
gfuv,()gx uy v–,–()udvd
•–
•
Ú
•–
•
Ú
==
Hij,()
F
*
G
Fmn,()Gi m j n–,–()
n
Â
m
Â
==
G
1 1 1
1 2– 1
1– 1– 1–
=
G
1 1 1
1– 2– 1
1– 1– 1
=
G
1– 1– 1–
1– 8 1–
1– 1– 1–
=
G
1 0 1–
2 0 2–
1 0 1–
=
G
1
9
--
1 1 1
1 1 1
1 1 1
=
© 2003 by CRC Press LLC

56-26 The Civil Engineering Handbook, Second Edition
orientation (parallax points), absolute orientation (signalized control points), and aerial triangulation
(pass points and signalized control points). In the case of signalized points, a strategy would be as follows:
1. Derive a rotation-independent detection template for the target type. Convolve this template with
the image(s) under study, and, by thresholding, obtain the approximate locations of the points.
2. With a fine-pointing template estimate the target position in the image, while simultaneously
modeling rotation, scale, affinity, and radiometry.
The search criterion can be the maximization of a correlation coefficient, or the minimization of a
sum of squares of residuals. The correlation coefficient is given by
(56.61)
where u and v represent image and template, or vice versa, and
(56.62)
The other significant application area of digital image matching is digital elevation model extraction.
Three techniques will be described for this task: (1) vertical line locus, (2) least squares matching, and
(3) epipolar matching.
Vertical Line Locus
Ve rtical line locus (VLL) is used to estimate the elevation at a single point, appearing in two photographs.
An initial estimate is required of the object space elevation of the point to be estimated. A “search range”
is then established in the Z-dimension, extending above and below the initial estimate. This search range
is then subdivided into “test levels.” At each test level, a matrix of points is defined surrounding the point
to be estimated, all in a horizontal plane. All points in this matrix are then projected back into each of
the two photographs, and via interpolation in the digital image, a corresponding matrix of gray levels is
determined for each photograph, at each level. When the test level most nearly coincides with the actual
terrain elevation at the point, the match between the pair of gray level matrices should be the maximum.
Some measure of this match is computed, often the correlation coefficient, and the elevation correspond-
ing to the peak in the match function is the estimated elevation. Variants on this procedure involving an
iterative strategy of progressively finer elevation intervals, variable sized matrix, and “matrix shaping”
based on estimated terrain slope can all be implemented, yielding more accurate results at the expense
of more computing effort.
Least Squares Matching
In the usual least squares matching (LSM) approach, one assumes that the two images are the same
except for an affine geometric relationship and a radiometric relationship with a gain and offset. One
takes the gray values from one image of the pair to be observations and then computes geometric and
radiometric transformation parameters in order to minimize the sum of squares of the discrepancies
(residuals) with the second image. In the following equations, g will represent the first image and h will
represent the second image. The affine geometric relationship is defined by
(56.63)
The linearized equation relating the gray levels is
(56.64)
C
uv
S u
i
u–()v
i
v–()
S u
i
u–()
2
S v
i
v–()
2
[]
12§
-----------------------------------------------------------=
u S
u
i
N
----
and v S
v
i
N
----
==
x
h
a
1
x
g
a
2
y
g
a
3
++=
y
h
b
1
x
g
b
2
y
g
b
3
++=
gx y,()hx y,()
h
∂
x
∂
------
dx
h
∂
y
∂
------
dy h x y,()dk
1
dk
2
+++ +=
© 2003 by CRC Press LLC

Photogrammetry and Remote Sensing 56-27
Taking differentials of Eq. (56.63),
(56.65)
making the following substitution for compact notation:
(56.66)
adding a residual to g, and substituting the differentials into Eq. (56.64), we obtain the condition equation
to be used for the least squares estimation,
(56.67)
In matrix form,
(56.68)
the condition equation becomes
(56.69)
One such equation may be written for each pixel in the area surrounding the point to be matched.
The usual solution of the least squares problem yields the parameter estimates, in particular the shift
parameters to yield the “conjugate” image point. If the parameters are not small, it may be necessary to
resample for a new “shaped” image, h, and solve repeated iterations until the parameter estimates are
sufficiently small.
Epipolar Matching
Both of the previous techniques involved matching areas, albeit small ones. In epipolar matching, the
two matched signals are one-dimensional. Also of interest is the degree to which these methods make
use of a priori knowledge of the image orientation. In the VLL technique we make use of this information.
In LSM we do not. In epipolar matching this information is used.
In theory, the use of this information should further restrict the solution space and thereby yield faster
solutions. In the epipolar technique, one takes the two planes defined by the two images to be matched,
and a third plane defined by the two perspective centers and intersecting the two photograph planes.
This third plane is referred to as an epipolar plane (there is an infinite number of them). The intersection
of this epipolar plane with each of the photograph planes defines two lines, one in each of the photographs.
If the orientation is correct, it is guaranteed that each point on one of the lines has a conjugate point on
the other line. Thus to search for this conjugate point one needs only to search in one dimension. The
practical steps necessary to implement this technique would be as follows:
dx
h
x
g
da
1
y
g
da
2
da
3
++=
dy
h
x
g
db
1
y
g
db
2
db
3
++=
h
x
hx y,()
∂
x
∂
--------------------
and h
y
hx y,()
∂
y
∂
--------------------==
gv
g
h– h
x
x
g
da
1
h
x
y
g
da
2
h
x
da
3
h
y
x
g
db
1
h
y
y
g
db
2
h
y
db
3
hdk
1
dk
2
––––
––––+
0=
vBD+ f=
v
g
h
x
x
g
– h
x
y
g
– h
x
– h
y
x
g
– h
y
y
g
– h
y
– h– 1–[]
da
1
da
2
da
3
db
1
db
2
db
3
dk
1
dk
2
+ hg–=
© 2003 by CRC Press LLC