API RP 2T-2010 Planning, Designing, and Constructing Tension Leg Platforms
Подождите немного. Документ загружается.


PLANNING, DESIGNING, AND CONSTRUCTING TENSION LEG PLATFORMS 211
16.8.3 Hurricane Preparedness
Advanced planning can also assist in reducing hurricane risks as well as improving post-hurricane response.
Owners should develop a written hurricane preparedness plan describing general activities for their inventory
of offshore structures as well as the plans for each specific structure. Checklists and platform specific guides
can assist during the evacuation process. TLP’s with higher life safety exposure and/or economic risk may
require additional consideration.
Examples of hurricane preparedness are as follows.
a) Evacuation planning for major hurricanes, including first evacuation for platforms that are at greater risk
of failure and those that are furthest from shore. Initial evacuation of non-essential personnel should
begin early.
b) Evacuation planning for sudden hurricanes, which occur at short notice, should be given special
consideration, including evacuation to offshore structures that have been demonstrated to be able to
safely survive sudden hurricane conditions.
c) Begin preparing operations for safe shut-in as early as possible including system pump down, securing
equipment and control panels, reducing liquid inventories, etc.
d) Secure loose objects and equipment that can become airborne projectiles. Store movable equipment in
safe and dry areas.
e) Develop advance plans for post-hurricane access to the TLP, in case normal access and safety systems
such as boat landings, walkways, power, etc. are not be available or functional due to damage.
f) Establish guidelines for safe re-boarding of a damaged TLP, with minimum acceptance criteria for
platform access and egress.
Copyright American Petroleum Institute
Provided by IHS under license with API
Licensee=Shell Global Solutions International B.V. Main/5924979112, User=Low, Ko
Not for Resale, 01/31/2011 00:10:44 MST
No reproduction or networking permitted without license from IHS
--``,`,```,,,``,`,``,,,,,,,,,,`-`-`,,`,,`,`,,`---

212
Annex A
(informative)
Commentary on Global Response Analysis and Design Checks
A.1 VIV of Hull, Tendons, and Risers
A.1.1 Introduction
VIV is an important response for the design of systems in areas with substantial currents. VIV is an interactive
load/response in which vortex shedding of flow around bluff bodies, when occurring at resonant frequencies
of the body, is capable of exciting resonant system response. It is a feedback and lock-in phenomenon,
wherein the motion of the body increases and correlates the vortex shedding. Depending on the system, the
response can be onerous in generating high loads and/or stress. Because of the continuous nature of the
response, the number of cycles possible, and the duration of some current events, high fatigue damage due
to VIV is often a concern. In addition to the dynamic response, when a system is experiencing a VIV response
the steady drag coefficients are also generally increased, leading to increased mean loads due to currents.
VIV is especially a concern for long slender members of bluff cross section (e.g. risers and tendons). For
these members, the VIV response is typically a transverse modal response. The issues in this type of
response include bending stress fatigue, increased drag loads, and the end effects that transmit loads into
either wellheads or foundation piles, and into the TLP hull.
The other area of significant VIV concern is the excitation of the hull in sway resonant motion. This has
primarily been thought to be a concern for single column structures such as spars and single column TLPs,
but recent tests have also shown VIV response of multicolumn structures. This has included square column
as well as round column structures. Hull VIV for TLP’s is not generally a strength issue, as it might be for a
catenary moored structure, but does have implications for maximum offset and for riser response and fatigue.
VIV is currently a topic of much research. References for the basic phenomena of VIV may be found in review
articles by Williamson and Govardhan (2004)
[246]
; Sarpkaya (1979)
[216]
and (2004)
[217]
; Griffin and Ramberg
(1982)
[149]
; Bearman (1984)
[98]
; Parkinson (1989)
[204]
; in a book chapter by Anagnostopoulos (2002)
[88]
.
Books on VIV include Blevins (1990)
[100]
; Naudascher and Rockwell (1994)
[197]
; and Sumer and Fredsøe
(1997)
[229]
. Additional useful references include Barltrop (1991)
[96]
; Vandiver (1993)
[238]
; and Vandiver, Allen
and Li (1996)
[239]
.
A.1.2 Observations of VIV on TLPs
With the development of TLPs in the deepwater portions of the Gulf of Mexico, which are subject to the Loop
Current and its eddies, there is now field experience with VIV effects on TLPs. observations include the
following.
a) Hull VIV in existing systems has been observed to be small and not a major design issue. Motions and
increased offsets should be included in the riser design, especially for SCRs.
b) The VIV of tendons has been observed to provide a significant excitation of the TLP structure, both at
rigid body resonances (heave, pitch, roll), and at higher frequencies which may affect internal structural
resonances. The observed motions have been sufficient to affect comfort of personnel, operation of
production equipment, and provided concern for fatigue loading of TLP local and primary structure
(Leverette, et al. (2003)
[179]
).
Copyright American Petroleum Institute
Provided by IHS under license with API
Licensee=Shell Global Solutions International B.V. Main/5924979112, User=Low, Ko
Not for Resale, 01/31/2011 00:10:44 MST
No reproduction or networking permitted without license from IHS
--``,`,```,,,``,`,``,,,,,,,,,,`-`-`,,`,,`,`,,`---
P
LANNING
,
D
ESIGNING
,
AND
C
ONSTRUCTING
T
ENSION
L
EG
P
LATFORMS
213
A.1.3 Analysis of VIV for TLPs
Most ongoing efforts in VIV response analysis are targeted at risers, where VIV is an established design
constraint. Further details on VIV analysis for risers (and tendons) may be found in API 2RD.
The primary tools in riser/tendon VIV analysis are modal response methods based on empirical load/response
techniques. Cylinder and riser model testing forms the basis for most of the industry capability in this area. In
addition, progress has recently been made on computational fluid dynamics (CFD) modeling of the flow
around cylinders and other structures. This is currently adding to the understanding gained from model
testing, and is being used in a limited number of applications in strip theory models. Full 3D simulation of a
substantial portion of a riser is currently at the outer limits of our computational capacity.
There are no proven analytical tools for the coupled analysis of tendon VIV exciting the structure. Leverette,
et al. (2003)
[179]
describe one analysis which combines a traditional riser analysis with a time domain coupled
numerical TLP model.
A.1.4 VIV Mitigation
The mitigation of VIV is typically done with either helical strakes or fairings. Strakes are devices that disrupt
the coherence of the flow and reduce the VIV effects. Fairings are streamlining shrouds which make the bluff
body into a shape where vortex shedding either does not occur, or does not communicate from one side of
the body to the other, thereby disrupting coherence necessary for lock-in.
Figure A.1 shows a typical strake pattern. Parameters governing the effectiveness of the strakes to reduce
VIV are strake height, usually specified as a fraction of the riser diameter, strake pitch, and number of strakes
(typically three). Strakes typically increase drag while eliminating a significant portion of the VIV response.
Figure A.1—Helical Strakes
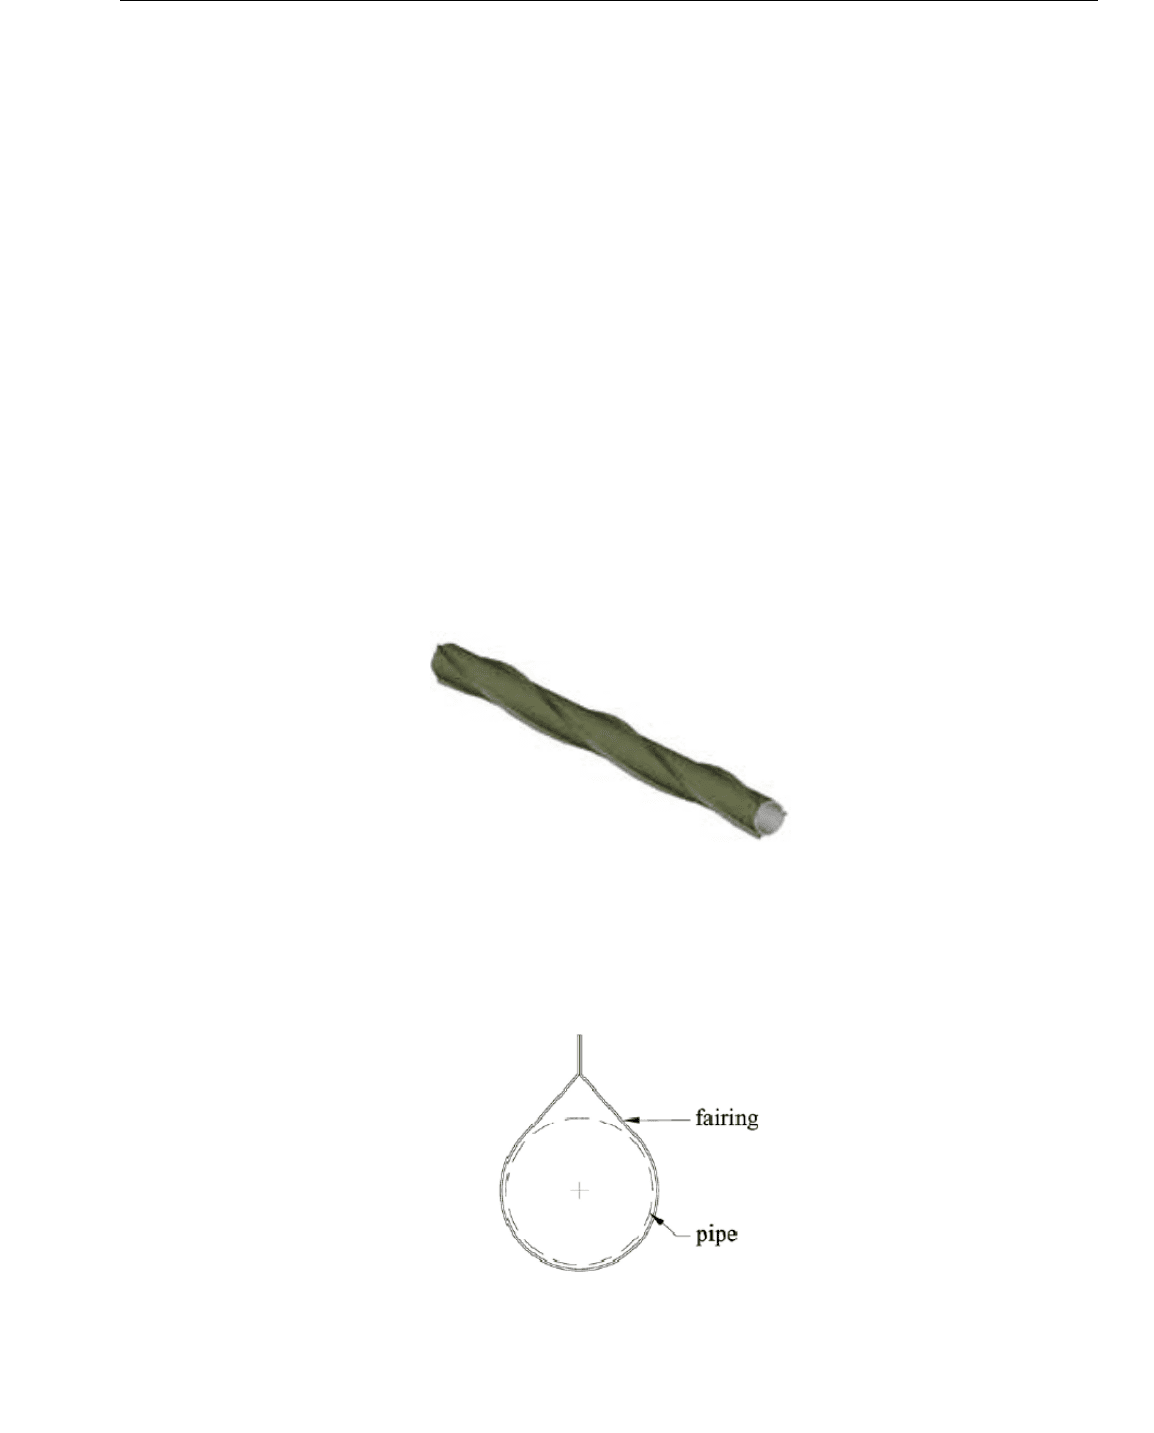
Figure A.2 shows a typical fairing. Parameters governing effectiveness of fairings are the length-to-diameter
ratio and shape. Fairings may also reduce drag. Recent developments (Allen, 2003
[87]
) include very short
fairings which do not reduce drag, but which appear to be effective on VIV and are much easier to handle.
Figure A.2—Short Fairing
Copyright American Petroleum Institute
Provided by IHS under license with API
Licensee=Shell Global Solutions International B.V. Main/5924979112, User=Low, Ko
Not for Resale, 01/31/2011 00:10:44 MST
No reproduction or networking permitted without license from IHS
--``,`,```,,,``,`,``,,,,,,,,,,`-`-`,,`,,`,`,,`---

214 API RECOMMENDED PRACTICE 2T
A.2 High-frequency TLP Responses
A.2.1 Introduction
The high-frequency responses of TLPs are significantly affected by nonlinear mechanisms, particularly in
moderate to extreme seastates. The primary nonlinear mechanisms are as follows:
a) springing,
b) ringing,
c) vortex shedding excitation of lateral tendon vibrations, and
d) deck wave impacts.
Since all of these mechanisms may be contributing to the high-frequency responses, it is basically impossible
to separate them from a time series simply by filtering techniques. However springing will always be present
in the high-frequency response.
In low to moderate seastates, there is generally significant wave energy in the frequency range overlapping
the natural heave/pitch/roll frequencies of a TLP; consequently both first-order (linear) and second-order
diffraction forces should be considered to evaluate the total forcing at the resonant frequencies of the vertical
modes. In extreme seastates, the wave energy in the frequency range overlapping the natural heave/pitch/roll
frequencies of a TLP is relatively small and the total forcing at these frequencies is dominated by second-
order springing and higher-order nonlinear effects.
From band-pass filtered time series of vibrations at, and close to, the natural period it is generally difficult to
separate the contributions caused by the different sources: first-order waves, springing and (not severe)
ringing, which makes utilization of these time series difficult in design. For certain structures and in certain
extreme seastates, the ringing response events stand out so clearly from the background springing that it is
useful and unambiguous, from a practical perspective, to identify and separate the two types of responses.
However, since ringing is normally caused by the same forcing mechanisms that contribute to springing
(neglecting the special case of ringing caused by waves impacting the deck), it can be expected that there will
be conditions where the delineation between the two types of responses will not be so clear, to the point of
being impractical.
A.2.2 Springing
Springing forces at or near the resonant heave/pitch/roll natural periods of TLPs are an important contributor
to tendon fatigue and shall be properly accounted for to assess fatigue damage accumulation. Springing
forces are also important in the assessment of extreme tendon tensions in extreme design seastates
(Mercier, et al. 1997
[190]
).
The springing response is, in contrast to ringing, very dependent on the damping of the system. The springing
response does commonly not appear in “bursts”, like the ringing response, but more in terms of continuous,
modulated groups. The full calculation of second-order springing forces is quite involved, but the theory has
been validated experimentally (Mercier and Niedzwecki, 1994
[189]
). However the implementation of the
theory for random seastates is not routinely done, primarily because it is not clear that application of the
second-order diffraction theory for calculation of springing forces is sufficient in that third- and higher-order
springing forces should also be included in the analysis (Newman, 1995
[200]
). In some cases, ringing
responses are known to be important but are not included in the theoretical modeling.
Copyright American Petroleum Institute
Provided by IHS under license with API
Licensee=Shell Global Solutions International B.V. Main/5924979112, User=Low, Ko
Not for Resale, 01/31/2011 00:10:44 MST
No reproduction or networking permitted without license from IHS
--``,`,```,,,``,`,``,,,,,,,,,,`-`-`,,`,,`,`,,`---

PLANNING, DESIGNING, AND CONSTRUCTING TENSION LEG PLATFORMS 215
A.2.3 Ringing
Ringing responses of TLPs are (Natvig, 1994
[196]
; Davies, et al. 1994
[123]
):
a) transient free vibration responses at the high-frequency resonant periods associated with impulsive
loading due to very steep and high individual waves;
b) a rare event, showing a burst-like occurrence only a few times an hour in relatively severe seastates, and
consequently usually contributing to the extreme responses only, and not to fatigue;
c) sensitive to relatively small changes in the geometrical form of the individual wave, as well as small
changes in the wave kinematics.
Two waves that, from a record, seem similar might lead to quite different ringing response: one might lead to
severe ringing, the other might not initiate any noticeable ringing at all. All observations of ringing events
indicate that most of the excitation takes place in the wave crest, above the mean free surface, but that the
excitation in the wave trough has a significant effect on the level of severity of the ringing response.
Furthermore, the forcing does not seem to be caused by viscous effects, but rather by "inertia" effects. This,
in turn, indicates that proper use of potential theory might lead to a numerical model capable of computing the
ringing forces. However, neither first-order nor second-order theory are expected to be capable of describing
ringing, which also is in line with practical experience.
Ringing is a highly nonlinear phenomenon that is not well understood theoretically. Ringing has been
recognized to be present for all TLPs designed to date, and it has contributed, to a varying extent, to the
extreme tether tension in all cases.
A.2.4 Vortex Shedding Excitation of Lateral Tendon Vibrations
A third mechanism responsible for nonlinear excitation of high-frequency responses is due to lateral tendon
vibrations caused with vortex shedding in strong currents (Leverette, et al. 2003
[179]
). For example, vortex
shedding from the tendons at a period near six seconds will transmit three-second period vibrations to the
hull.
A.2.5 Deck Wave Impacts
TLP ringing is the result of one or several steep waves impacting the columns of the TLP. A related source of
high-frequency excitation is wave impact loading on the side or underside of the deck. Due to the wave
inundation effect, the forcing event is not necessarily as short as that associated with ringing, consequently
the response following the main impulse may be more highly damped or confused. Nevertheless, depending
on the extent of inundation, the wave impact forcing may be quite large (Schott, et al. 1995
[219]
).
A.2.6 Numerical Modeling Techniques
From the transient nature of the ringing and wave impact responses it is clear that any numerical
computations of this effect have to be executed in the time domain. The description of ringing excitation
should be sought within the framework of the hydrodynamic theory of potential flow. It is equally clear that
linear or second-order perturbation theory is not adequate for this kind of computation. Though much effort
has been expended in developing and verifying analytical models of TLP ringing (Faltinsen, et al. 1995
[138]
;
Jefferys and Rainey, 1994
[163]
; Davies, et al. 1994
[123]
; Malenica and Molin, 1995
[185]
; Krokstad, et al.
1996
[170]
), no widely accepted modeling approach has emerged. It is likely that the only numerical modeling
approach that will be successful in predicting ringing is solving the exact 3D free surface problem, a capability
which does not yet exist.
Analytical or numerical models for springing, ringing and wave impacts have not yet been sufficiently
validated with experimental or full-scale data to justify their use in detailed analysis and design verification.
These models are suitable only for preliminary design. For these reasons, model tests are typically used to
Copyright American Petroleum Institute
Provided by IHS under license with API
Licensee=Shell Global Solutions International B.V. Main/5924979112, User=Low, Ko
Not for Resale, 01/31/2011 00:10:44 MST
No reproduction or networking permitted without license from IHS
--``,`,```,,,``,`,``,,,,,,,,,,`-`-`,,`,,`,`,,`---

216 API RECOMMENDED PRACTICE 2T
quantify the high-frequency responses of TLPs (Schott, et al. 1995
[219]
). Nevertheless, a fundamental
understanding of the underlying physics is needed to ensure that the model tests are set up properly.
A.2.7 Recommended Design Verification Procedure
A.2.7.1 General
Due to the lack of reliable analytic tools for modeling high-frequency responses and forces, one should either
resort to model tests to provide the needed information or turn to past experience to establish conservative
design allowances for these responses. The former is the preferred approach since it leads to a more reliable
and optimized design. However, even with this approach a number of ill-defined issues should be considered
related to what seastates to use as the basis for the design, how to set up and conduct the model tests, and
most importantly, how to interpret the measurements and incorporate them in the design process.
The selection of environmental criteria for high-frequency responses should consider the spectral wave
parameters and statistics of individual waves in the seastate. The selection of spectral wave criteria for high-
frequency responses ideally should be response-based. However, since reliable tools for analytic modeling of
high-frequency responses do not yet exist, it is necessary to resort to an investigation of the sensitivity of the
response to variations in the spectral wave parameters near the 100-year seastate. To determine the
appropriate design level response, the responses to the various seastates investigated should be weighted
according to their relative probability of occurrence.
Carefully conceived and executed model tests using dynamically faithful scale models are the most reliable
way to quantify the high-frequency responses and should be an integral part of the design process. The tests
should be performed as early in the design process as possible, definitely before the final sizing is complete.
Unless test data from previous tests can be extrapolated with confidence to provide the requisite design
information, postponing the model tests until after the final sizing is complete to verify the final design may
pose a substantial risk to the project schedule and should be avoided.
The interpretation of measured or simulated response time series is also a challenging part of the design
process. The goal is to identify the extreme value distribution of the high-frequency response. This information
is then used to calibrate design recipes, which are equations for combining the responses from the various
frequency bands.
A.2.7.2 Interpretation of Model Test Results
The use of model tests for determination of high-frequency responses imposes a number of requirements on
the interpretation of such tests. It is sometimes difficult to distinguish between springing responses, ringing
responses, and those due to wave impact on the deck of the TLP. The high-frequency responses are most
directly observed in tendon tension responses, and in heave/pitch/roll acceleration responses. In addition to
examining the times series, visual examination of video records is critical for identifying events such as deck
impacts and breaking waves (Schott, et al. 1995
[219]
).
One means of separating responses in tension data is to extract the heave, pitch, and roll induced tension by
modal decomposition (Jefferys and Rainey, 1994
[163]
). This is typically done by summing and differencing the
tension from the various tendons according to the contribution each motion mode gives to each tendon. This
is useful in separating pitch/roll from heave effects, but has been of only limited use in separating ringing
responses from other responses.
The primary tool used to distinguish the various response components is filtering of the response signal. Low
pass, band pass, and high pass filters are used to separate the slow drift, wave frequency, and high-
frequency (heave/pitch/roll frequency) responses. This is useful for understanding the various responses, but
suffers from the following limitations:
— filters will always produce some distortion of the signal, and shall be designed carefully to avoid adding
more uncertainty to the measurements;
Copyright American Petroleum Institute
Provided by IHS under license with API
Licensee=Shell Global Solutions International B.V. Main/5924979112, User=Low, Ko
Not for Resale, 01/31/2011 00:10:44 MST
No reproduction or networking permitted without license from IHS
--``,`,```,,,``,`,``,,,,,,,,,,`-`-`,,`,,`,`,,`---
PLANNING, DESIGNING, AND CONSTRUCTING TENSION LEG PLATFORMS 217
— the various responses may have quite separate frequency bands, but often have some degree of overlap,
so that frequency separation does not completely separate the responses;
— ringing and springing are separate processes, but occur at the same frequencies, so that no separation is
possible.
Significant ringing of a structure is recognized both in a plot of the filtered time series and in a plot of the
probability distribution of the responses in that (Davies, et al. 1994
[123]
):
— the high-pass filtered time series shows an oscillatory signal with a large amplitude being built up over a
couple of cycles (at the natural period), followed by a slow decay of the amplitude in time at a rate that
depends significantly on the damping of the vibrational mode;
— the existence of a dual population of responses is clearly indicated in that the extreme events due to
ringing show a completely different probability distribution than the main bulk of events at a lower
response level.
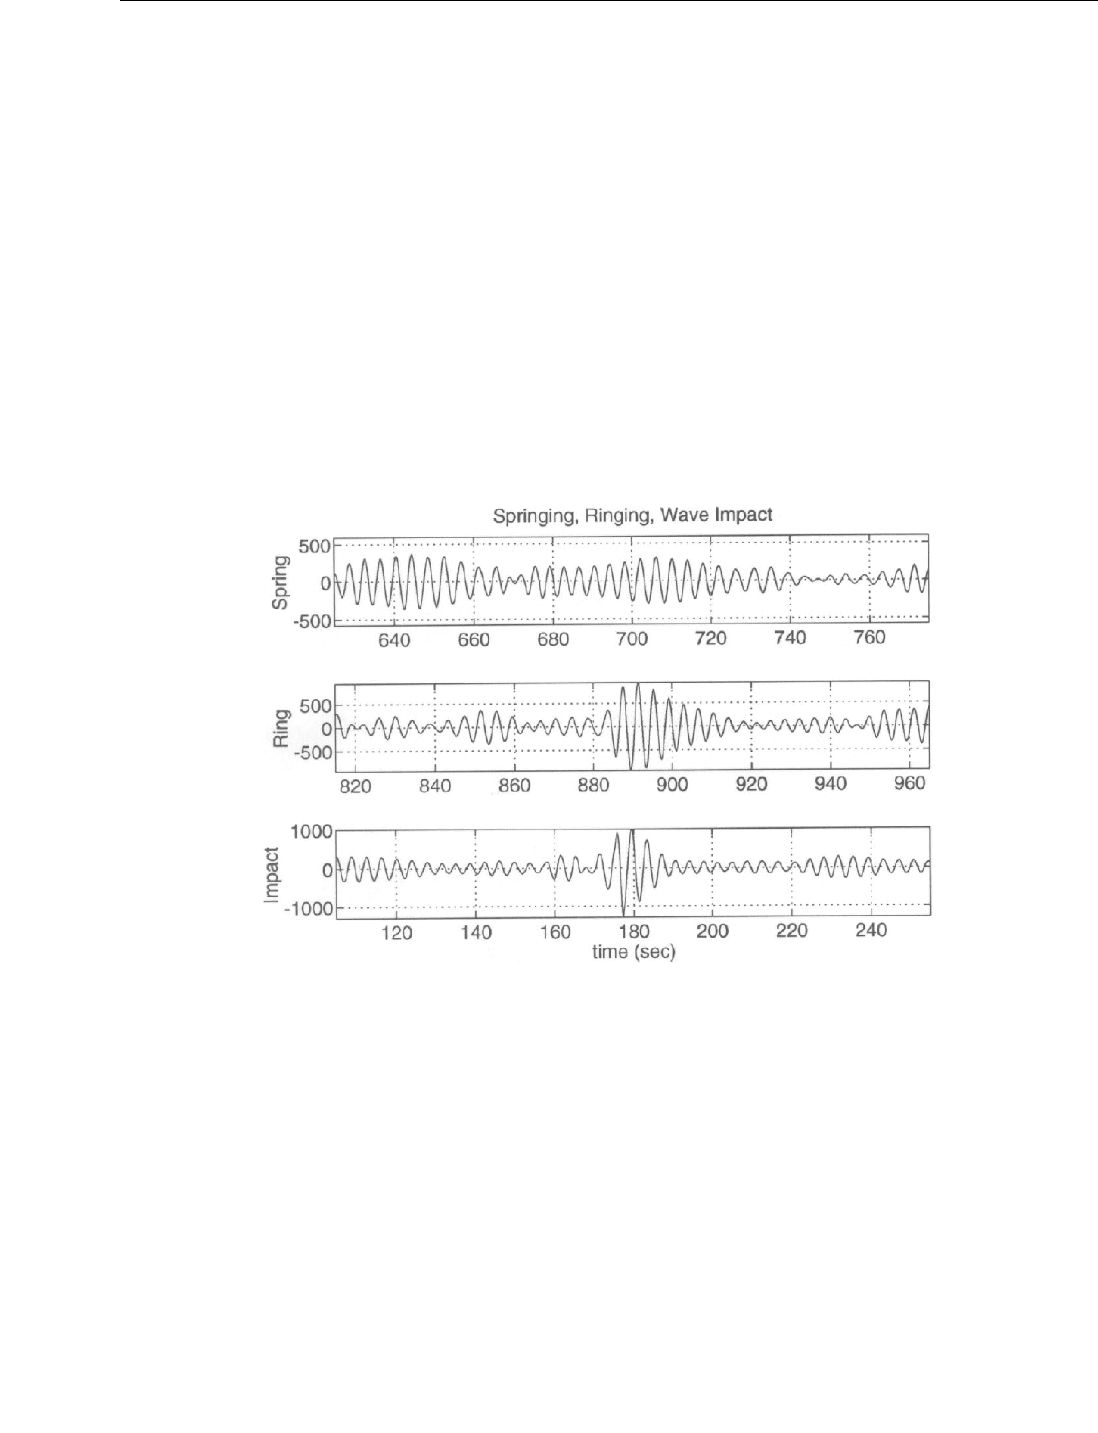
Figure A.3 illustrates the time series characteristics of springing, ringing, and wave impact responses (Schott,
et al. 1995
[219]
).
Figure A.3—Sample High-frequency TLP Tension Responses
A.2.7.2.1 Extreme Value Estimation
Extreme values interpreted from model test results are generally inferred from the statistics of peaks of the
measured time series. The prediction of extremes of the complete response is complicated by the various
components of response with differing statistical distributions. The makeup of the complete response varies
with time during any single test run. The collection of complete wave responses during any single test falls
into different populations, depending on which component is dominating each peak.
For linear wave responses, the response distribution is much the same as the distribution of wave height, and
is well fit by a Gaussian distribution. For second-order forces (wave drift, second-order sum frequency
springing forces), the response distribution is more skewed than Gaussian, and is often fit by a Gram-Charlier
distribution or by Hermite polynomials used to map the process back to a Rayleigh distribution (Winterstein, et
al. 1994
[248]
). For weakly coupled, lightly damped linear system responses to second-order forces, the
Copyright American Petroleum Institute
Provided by IHS under license with API
Licensee=Shell Global Solutions International B.V. Main/5924979112, User=Low, Ko
Not for Resale, 01/31/2011 00:10:44 MST
No reproduction or networking permitted without license from IHS
--``,`,```,,,``,`,``,,,,,,,,,,`-`-`,,`,,`,`,,`---

218 API RECOMMENDED PRACTICE 2T
response distribution tends back to Gaussian based on the averaging properties of the system. However, for
ringing dominated responses, the distribution is much more variable than commonly observed in offshore
structure responses, and commonly used distributions are not at all appropriate. While linear Gaussian
responses typically have a value of less than 4 standard deviations at the 1-in-1000 level, second-order
responses typically have values between 4 and 6, and ringing responses have been observed with 1-in-1000
values of 6 to 20 standard deviations (Davies, et al. 1994
[123]
).
The estimation of extreme values for nonlinear responses is often performed using generalized distributions
such as Weibull, exponential, or Gumbel distributions. These functions are not related to the physics of the
process, but are general purpose extreme value fitting functions which are used to fit data. Care should be
taken to not apply the results to conditions other than those represented by the individual test, such as
extrapolation to much longer return periods.
The fitting of extremal distributions to model test data with multiple populations should be performed to the
segment of the data of interest. In the case of extreme value estimates, the fitting is generally done to the tail
of the data. This is done by segmenting the data, or by masking the lower values, so that the fitting only sees
a single population of points.
A.2.7.2.2 Event-based Statistics
Because ringing appears to be caused by an impulsive type of load, and there are multiple peaks in a given
ringing event, an analysis of the peaks of a tension time series measurement will contain many events which
are statistically correlated with other events. Since ringing responses are associated with specific waves, it
has proven useful to extract snippets from the measured resample tension responses time series so that each
snippet containing a ringing event is associated with a single unique on one sample per wave event. This is
performed with a zero-crossing analysis conditioned on the zero-crossing analysis of the waves. In other
words, a one-to-one correspondence between each candidate ringing event and an individual wave crest is
established by cross-correlating tension and wave snippets extracted between zero- or mean-level threshold
crossings. The resulting data set of snippets will have the same number of tension and wave events as there
are waves, and is much easier to treat statistically (Davies, et al. 1994
[123]
).
A.2.7.2.3 Statistical Stability, Confidence Bounds
The statistical stability and confidence bounds in fits to measured data are closely tied to the variability of the
processes discussed above. In general, the fitting used in model test data analysis is based on fitting the tails
of a process, and estimation of an expected largest value in approximately three to six hours of prototype
response (0.0050 to 0.0005 exceedence levels). In a process which is well behaved, and which contains one
statistical population, it is reasonable to estimate this from a single observation corresponding to the design
storm duration. However, for processes which are much more variable, and for which only a few large events
are observed in the typical three to six hour observation, much longer data sets are required for reasonable
characterization of the process. The length of data sets required can be determined from the data itself. If the
estimates of an expected design exposure maximum converge with additional observations, then sufficient
data are present.
A.2.8 Design Recipes
In general spectral analysis, it is often assumed that the energy in one frequency band is statistically
independent of the energy in other frequency bands, and that both are Gaussian in nature. In the case of
narrow band spectra, the estimation of maxima is often done using the theoretical relationships first derived
by Rice (1944 to 1945)
[211]
. Given a time record of response in which N extreme values between mean level
threshhold crossings are observed, the most likely maximum value of all the extremes is given by:
max 2 ln N=σ
(A.1)
where σ is the standard deviation of the response determined from the record. In cases where the spectrum is
broad band (with spectral bandwidth ε), the most likely maximum value becomes:
Copyright American Petroleum Institute
Provided by IHS under license with API
Licensee=Shell Global Solutions International B.V. Main/5924979112, User=Low, Ko
Not for Resale, 01/31/2011 00:10:44 MST
No reproduction or networking permitted without license from IHS
--``,`,```,,,``,`,``,,,,,,,,,,`-`-`,,`,,`,`,,`---

PLANNING, DESIGNING, AND CONSTRUCTING TENSION LEG PLATFORMS 219
2
2
21
max 2 ln
11
N
⎧⎫
−ε
⎪⎪
=σ
⎨⎬
+−ε
⎪⎪
⎩⎭
(A.2)
However, if various frequency bands are not Gaussian, and are not statistically independent, the estimation of
maxima is much more problematical. Empirical equations of the following forms have been used:
22
11 2 2
max max maxcc=+
(A.3)
112 2
max max maxcc=+ (A.4)
A.3 Long-term Analysis and Response-based Criteria
A.3.1 Introduction
One aspect of TLP global performance analysis which is unique compared to traditional design code
calculations is the sensitivity to multiple environmental parameters. Although it is possible to generalize TLP
sensitivities to the environment, some configurations are more sensitive to some combinations of parameters
than are others.
The application of reliability methods inherently requires the use of probabilistic methods to evaluate a design.
There are a number of implementations of reliability methods which involve performing probabilistic analysis
to provide additional design checks. See Forristall, Larrabee and Mercier (1991)
[141]
; Spillane and Leverette
(1991)
[225]
; Winterstein, et al. (1993)
[247]
; Leverette and Rashedi (1995)
[178]
; Wen and Banon (1995)
[242]
;
and Tromans and Vanderschuren (1995)
[234]
.
The TLP global responses are subject to many sources of variability and uncertainty, which should be
accounted for by the designer. The major sources of variability and uncertainty in the global responses are:
a) Long-term environmental variability,
b) Short-term response variability,
c) inaccuracies in numerical and experimental methods,
d) platform condition uncertainties.
The main objective in establishing a TLP design is to provide a sufficiently “safe” design, without providing
costly unnecessary strength or capability. As such, the design process should provide reasonable safety
factors which are directly related to the uncertainties of the design response predictions.
The approach taken in this RP is to evaluate the TLP in conditions which produce the largest response that
the platform is expected to experience, and then to provide additional safety factors on the response to
provide the overall level of safety or reliability that is required for the application.
The procedures which follow are a means of selecting environmental design cases based on the response
sensitivities of a particular TLP. By performing this selection probabilistically, the selected design cases are
neither too conservative—in order to cover all possible configurations—nor are unconservative in missing
more onerous and more probable seastate combinations.
The two parts of this analysis are a long-term probabilistic analysis of the structure to determine the long-term
extreme responses, and a second step which defines environmental load cases which produce these extreme
responses. The former may be performed with a relatively simple model which still contains the relative
sensitivities of the specific TLP to the various environmental force combinations at site. The latter then
Copyright American Petroleum Institute
Provided by IHS under license with API
Licensee=Shell Global Solutions International B.V. Main/5924979112, User=Low, Ko
Not for Resale, 01/31/2011 00:10:44 MST
No reproduction or networking permitted without license from IHS
--``,`,```,,,``,`,``,,,,,,,,,,`-`-`,,`,,`,`,,`---

220 API RECOMMENDED PRACTICE 2T
produces conventional event-based criteria which are appropriate for the specific structure and location (e.g.
a storm definition which produces 100-year return period responses).
It is noted that an alternate approach taken by some designers, which achieves a similar level of overall
reliability, is to design to traditionally defined environments, and then perform a long-term analysis with more
detailed models of the final structure. The result of this analysis is actual rather than notional extreme value
responses for the structure. This analysis then confirms that the design conditions used in the design were
conservative and sufficient to cover all likely combinations that would be controlling for the design (Baar, et al.
1997
[94]
).
A.3.2 Long-term Response Analysis
A.3.2.1 Environmental Database
The input to the long-term response analysis is a database of environmental history, either measured or
hindcast, for the site or region for the design. The database should be based on a reasonably complete
representation of the area environment, accurate extreme event simulation, include direction, wind/
wave/current joint occurrence and directions, wave spectral information, storm surge effects. For the Gulf of
Mexico, this is typically one of the hurricane hindcast data sets based on the 90 or so years of historical
hurricane records. For the North Sea, this is typically based on measured and/or hindcast conditions for 30
years. The database should be sufficiently complete to allow 0.05 to 0.02 annual exceedence probability
estimates to be made without extrapolation.
The data base should include a complete description of each environmental observation in order to identify
appropriate joint statistical relationships. The following should be available for use in the analysis:
a) significant wave height;
b) modal peak period for wave spectrum (or other frequency dependent spectral description of wave
energy);
c) spectral peak enhancement factor, gamma;
d) mean wind speed;
e) wave direction;
f) wind direction;
g) storm surge (water elevation);
h) mixed layer current speed;
i) current direction;
The database should comprise one to six hour samples of storm conditions. Multiple grid points/sites may be
used to increase the data extent for hurricane data to improve the variability of the response estimates. The
definition of wave spectral information is particularly important for TLPs. Care should be taken to ensure that
peak periods and spectral models assigned to mixed sea and swell conditions do not incorrectly place all of
the energy at sensitive peaks in the TLPs response functions.
A.3.2.2 Long-term Response Statistics
The database is processed sequentially using a simplified response model of the particular TLP to calculate
approximate design load case responses for each environmental observation in the database. Various
response models have been used for this type of analysis, including polynomial functional fit models and
frequency domain, transfer function based load case models. The important aspect of the simplified model is
that it be representative of the sensitivities of the full system to combinations of environmental parameters.
Copyright American Petroleum Institute
Provided by IHS under license with API
Licensee=Shell Global Solutions International B.V. Main/5924979112, User=Low, Ko
Not for Resale, 01/31/2011 00:10:44 MST
No reproduction or networking permitted without license from IHS
--``,`,```,,,``,`,``,,,,,,,,,,`-`-`,,`,,`,`,,`---