Baker K.R. Optimization Modeling with Spreadsheets
Подождите немного. Документ загружается.

the appreciation rate), corresponding to the time the investment matures. The only
exceptions are I0 and A8, which essentially represent flows into and out of the network.
In other funds-flow models, the column coefficients portray the investment-and-return
profile on a per-unit basis for each of the variables. Following our sign convention, the
right-hand-side constants show the profile of flows in and out of the system over the
various time periods. In this case, the constants in the last four constraints are negative,
reflecting required outflows from the investment account in the last four years of
the plan.
The objective function in this example is simply the initial size of the investment
account, represented by the variable I0, which we want to minimize. Thus, we can
depart from the standard form (which uses the SUMPRODUCT function as an objec-
tive) and designate the objective function simply by referencing cell B5. The model
specification is as follows.
Objective: B8 (minimize)
Variables: B5:P5
Constraints: Q10:Q17 ¼ S10:S17
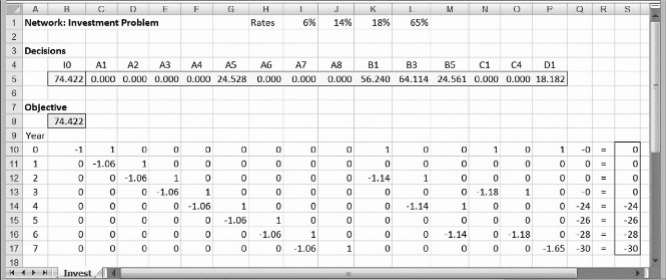
When we minimize I0, Solver provides the optimal solution shown in Figure 3.15,
calling for an initial investment of about $74,422. Compare this with the nominal
value of the college expenses, which sum to $108,000. The lower figure for the initial
investment testifies to the power of compound interest. In our example, the parents can
use linear programming to take advantage of interest rate patterns and minimize the
investment they need to make in order to cover the prospective costs of their daughter’s
college education.
The nature of the optimal solution may not be too surprising. First, the return of 18
percent on the three-year investment is dominated by the return of 6 percent on the
one-year investment A, due to compounding. Thus, we should not expect to see any
use of the three-year instruments in the optimal solution. The return on the one-year
investment is dominated, in turn, by the return on the two-year investment and the
Figure 3.15. Spreadsheet model for Example 3.5.
96 Chapter 3 Linear Programming: Network Models
return on the seven-year investment. Thus, we should expect to see substantial use of
those two instruments. The use of the one-year investment is dictated by timing:
Because it is the only investment maturing at the end of year 5, it becomes the vehicle
to meet the $26,000 requirement. Prior to that, the solution uses B3 (funded in turn by
B1) to cover the first year of expenses and to fund A5. Then B5 covers the third year of
expenses, funded by B3. Finally, D1 covers the fourth year of expenses. As expected,
the account should be empty at the end of the planning horizon.
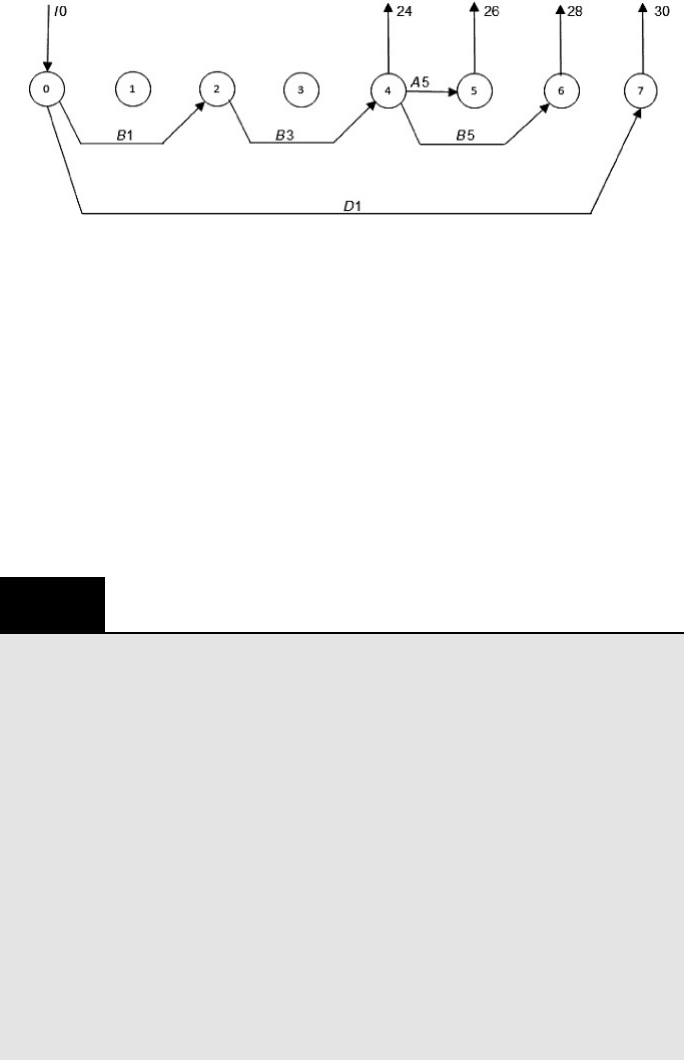
The network diagram provides another perspective on this solution structure. In
Figure 3.16, we show the network diagram with only the positive flows displayed.
The diagram shows clearly that the only vehicle in the optimal solution for meeting
Figure 3.16. Flow diagram with optimal flows for Example 3.5.
BOX 3.2
Characteristics of General Network Models for
Funds Flow
Decision variables
Arcs correspond to sources and uses of funds.
Make investments; pay off debts owed.
Objective function
Reference a single variable.
Minimize initial investment or maximize final value.
Constraints
Nodes correspond to points in time.
A balance equation corresponds to each node.
For investments, the column depicts the pattern of principal and returns.
For loans, the column depicts the pattern of principal and interest payments.
RHS constants describe external flows to and from the network.
Add lower-bound or upper-bound constraints as needed.
3.6. General Network Models with Yields
97

the $30,000 requirement at node 7 is the investment in D1. Therefore, the size of the
initial investment in D1 must be 30,000/1.65 ¼ 18,182. Working backwards, we can
also see that the size of B5 is dictated by the $28,000 requirement, and A5 is dictated by
the $26,000 requirement. Once A5 and B5 are determined, they, together with the
$24,000 requirement, dictate the size of B3. In turn, B3 dictates the size of B1. The
diagram systematically conveys the detailed pattern in the optimal solution.
Box 3.2 summarizes the important features of network models for funds flow pro-
blems. In a multiperiod investment model, flows expand as they travel along arcs.
Matter is not conserved as it flows, so we lose the conservation of matter that holds
implicitly for flows between nodes in special networks. However, balance equations
still apply at each node, in the sense that the total flow out of a node always equals
the total flow in. The flows are still denominated in currency wherever they appear
in the network. (Money is not converted into product, for example.) By contrast, we
look next at a class of network models in which the flows are transformed.
3.7. GENERAL NETWORK MODELS WITH
TRANSFORMED FLOWS
Another phenomenon that lends itself to network descriptions is the output of pro-
duction processes. In this application, a node in the flow diagram represents a process
that transforms inputs into outputs. In a transportation network, a node might represent
a facility where material is received and ultimately sent out; however, the form of the
input flow and the form of the output flow always match. That is, if the input is
measured in truckloads, then so is the output. If the input is measured in cartons,
then so is the output. The concept holds as well for nodes in a funds-flow network:
if the input is measured in dollars, then so is the output. By contrast, production pro-
cesses alter the material flowing in the system, so outputs may constitute different
types of material than the inputs from which they were created. Even with this gener-
alization, network concepts are still applicable. Consider the example of oil refining at
Delta Oil Company.
EXAMPLE 3.6
Delta Oil Company
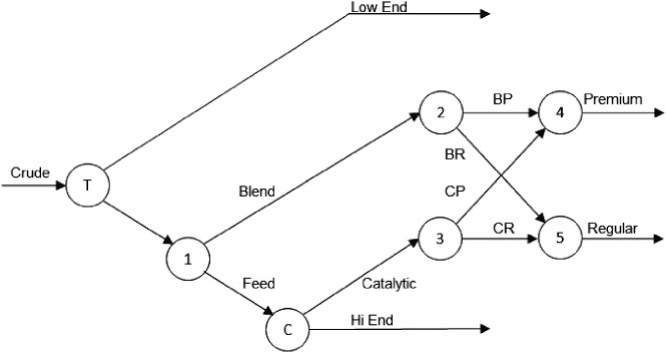
A simplified representation of the refining process at Delta Oil Company appears in Figure 3.17.
First, the distillation process separates gasoline from other components by heating crude oil
under pressure in a distillation tower. The vapors are then collected separately and cooled to pro-
duce distillate and other “low-end” by-products. The distillation tower uses five barrels of crude
oil to produce three barrels of distillate and two barrels of by-products. Some distillate is blended
into gasoline; the rest becomes feedstock for the catalytic cracker.
The catalytic cracking process utilizes high temperatures to break heavy hydrocarbon com-
pounds into lighter compounds. This process produces high quality catalytic gasoline (or cata-
lytic, for short) and other “high-end” by-products. Delta’s catalytic cracker requires 2.5 barrels
of distillate to produce 1.6 barrels of catalytic and 1 barrel of by-products. (The cracking process
creates output volume that exceeds input volume.)
98 Chapter 3 Linear Programming: Network Models
Finally, distillate from the distillation tower is blended with catalytic to make regular gaso-
line and premium gasoline. Premium grade gasoline requires a higher proportion of catalytic in
the blend as compared to regular grade gasoline. B
We adapt the sketch of production flows and convert it to a standard network flow
diagram by labeling each of the arcs in the network, recognizing that these labels will
also serve as the names of decision variables in the linear programming model. For
convenience, we use some abbreviations, such as CR, which represents the amount
of catalytic that is combined into regular gasoline. Next, we create node T to represent
the tower and node C to represent the cracker. We also add nodes 1, 2, and 3 to rep-
resent allocations of flow. At node 1, the distillate must be split into a portion that is
directly blended into gasoline and a portion that is used as a feedstock for the cracker.
At node 2, the distillate allocated to blending must be split between regular and pre-
mium grades of gasoline, and similarly at node 3 for the catalytic produced by the
cracker. Finally, nodes 4 and 5 represent the output of the two blending decisions,
one for regular and one for premium.
For each node in the diagram, we write a balance equation. Conceptually,
however, there is a twist here. Because the nodes represent transformation processes,
the input material may differ from the output material, and there may be several
input materials and output materials. (In distribution models and yield models,
no transformation of material takes place.) We write a balance equation for each
output material. For example, the equations for the tower node (T) take the follow-
ing form.
Flows Out Flows In ¼ 0
Dist 0:60 Crude ¼ 0
Low 0:40 Crude ¼ 0
Figure 3.17. Flow diagram for Example 3.6.
3.7. General Network Models with Transformed Flows 99
Thus, this node generates two balance equations, one each for distillate and low-end
by-products. Each equation contains one input term, for crude. The coefficients of
0.60 and 0.40 correspond to a fractional split of five barrels into flows of three
barrels and two barrels, respectively, for the split between distillate (Dist) and low-
end by-products (Low).
A similar pair of equations applies to the cracker node (C)
Flows Out Flows In ¼ 0
Cat 0:64 Feed ¼ 0
High 0:40 Feed ¼ 0
The numbered nodes are similar to transshipment nodes in our distribution
models, because the inputs and outputs are the same material. At node 1, the distillate
must be split into either feedstock (Feed) or gasoline blending input (Blend). The
balance equation becomes
Feed þ Blend Dist ¼ 0
Nodes 2 and 3 have a similar structure
BP þ BR Blend ¼ 0
CP þ CR Cat ¼ 0
Nodes 4 and 5 are also of this type
BP þ CP Prem ¼ 0
BR þ CR Reg ¼ 0
The balance equations represent an algebraic description of the flow diagram.
Conversely, the flow diagram represents a network representation of the balance
equations. The system of balance equations and the network flow diagram are different
manifestations of the same model. We can use one form to audit the other in order to
check for consistency and eliminate structural errors.
The linear programming model has not been finished. In addition to the network
“kernel” for this problem, other types of information are needed, including:
†
production capacities for each production process,
†
sales potentials for final products,
†
blending specifications for gasoline.
The first two of these can be stated in appropriate dimensions, such as barrels per day,
whereas the third describes limits on the ratio in which gasoline inputs may be mixed.
To illustrate the entire model, suppose the following parametric assumptions apply.
†
Tower and cracker capacities: 50,000 and 20,000 barrels/day.
†
Sales potential for regular and premium gasoline: 16,000 each.
†
Sales potential for by-products: unlimited.
100
Chapter 3 Linear Programming: Network Models
†
Blending floor for catalytic in regular gasoline: at least 50 percent catalytic.
†
Blending floor for catalytic in premium gasoline: at least 75 percent catalytic.
To complete the model, we need the economic factors that make up the objective
function. Suppose the following parametric assumptiosns apply.
†
Cost of crude oil: $28 per barrel.
†
Cost of operating the tower: $5 per barrel of crude.
†
Cost of operating the cracker: $6 per barrel of feedstock.
†
Revenue for high-end and low-end by products: $44 and $36 per barrel.
†
Revenue for regular and premium gasoline: $50 and $55 per barrel.
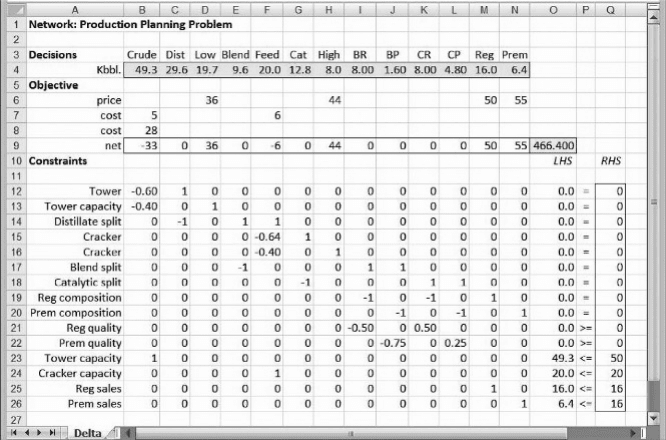
Figure 3.18 shows a spreadsheet model for the entire problem. Balance equations
form the kernel of the model in rows 12–20. The next pair of constraints, in rows
21–22, contains the blending quality requirements for the grades of gasoline.
Finally, the four constraints in rows 23–26 contain the ceilings on production
capacities and sales volumes. These could alternatively be incorporated as upper
bounds on the variables Crude, Feed, Reg, and Prem.
The objective function is made up of revenue from the sales of outputs, the cost of
operations, and the cost of input materials. For clarity, we devote a row of the spread-
sheet to each of these components of the objective function, recognizing that several of
these cells do not apply. In fact, intermediate products such as distillate are not directly
Figure 3.18. Spreadsheet model for Example 3.6.
3.7. General Network Models with Transformed Flows 101

associated with any costs or revenues at all. The value of the objective function, cal-
culated as a SUMPRODUCT, appears in cell O9. The model specification is
as follows.
Objective: O9 (maximize)
Variables: B4:N4
Constraints: O12:O20 ¼ Q12:Q20
O21:O22 Q21:Q22
O23:O26 Q23:Q26
Figure 3.18 displays the optimal solution to Delta Oil Company’s refining
problem. In brief, the solution achieves a profit contribution of $466,400. It calls
for purchases of 49,333 barrels of crude oil. This quantity leaves the tower with a
small amount of excess capacity, but cracker capacity is fully utilized by the
optimal allocation of distillate. Sales of regular gasoline are limited by market
potential, but this is not the case for premium. Both gasoline products are blended
at their minimum quality requirements, suggesting that catalytic is a scarce resource.
A brief look at the decision variables reveals that there is flow on every arc in the net-
work diagram.
BOX 3.3
Characteristics of General Network Models for
Transformation Processes
Decision variables
Arcs correspond to materials generated at any stage of the process.
Define variables as convenient to track costs and revenues.
Intermediate products appear as arcs, possibly without cost or revenue.
Objective function
Net revenue or variable cost can be captured as a SUMPRODUCT.
Maximize net revenue or minimize variable cost in standard form.
Constraints
Nodes correspond to stages of the process.
An equation corresponds to each transshipment node.
At each transformation node, one equation for each output product.
Rest of the model
Augment the network kernel with capacities and demands.
Add lower bounds and upper bounds as needed.
102 Chapter 3 Linear Programming: Network Models
Viewed as strategic information, the optimal solution provides useful insights
into the determinants of profitability at Delta Oil. Of the two main pieces of process
equipment, the cracker is currently the more constraining; however, the tower is not
far behind. Capacity may have to be raised in both places for Delta to significantly
increase its profits. On the output side, profits are also constrained by demand for regu-
lar gasoline. If the marketing department could find additional customers for regular
gasoline, this could also lead to increased profits. In short, the strategic implications
of the Delta Oil model are typical of product-mix models; however, the construction
of the model itself is driven by network-modeling principles.
Returning to the network structure, which lies at the heart of the Delta Oil model,
we highlight the key features in Box 3.3.
SUMMARY
This chapter has introduced the network model to accompany allocation, covering, and blending
models as one of the four basic linear programming types. The network model is uniquely
adapted to the use of network flow diagrams, which can help substantially in constructing
and debugging a spreadsheet model.
Among network models, a set of important cases are called special networks. Special net-
work models arise frequently in distribution problems faced by industry. These models also have
a structure that leads naturally to a distinctive array-based format for spreadsheet use. The use of
arrays reflects the natural From/To structure in the problem itself, which lends itself readily to
the row-and-column layout of a spreadsheet. (The array format adds an important case to the
standard linear programming format covered in Chapter 2.) Special networks are usually formu-
lated with inequality constraints; although from a more general perspective, these constraints are
intuitive simplifications of a set of balance equations.
General network models illustrate the application of balance equations as a means of
structuring an optimization problem. The overarching framework for these models is the same
standard layout that was emphasized in Chapter 2. Nevertheless, the use of balance equations pro-
vides us with a simple recipe for developing a model (or a portion of a model) made up of EQ
constraints. These constraints can be formulated directly from an accompanying flow diagram.
EXERCISES
3.1. Distributing a Product The Nicklaus Razor Blade Company plans to test market a new
blade next month. The blades will be stocked in their three warehouses in the following
quantities.
Warehouse A B C
Stock (cartons) 50 50 50
Meanwhile, the carton quantities required by the distributors in the four test markets are
as follows.
Distributor D E F G
Requirement 45 15 25 20
Exercises
103
The unit costs (in dollars per carton) of shipping the blades from warehouses to distribu-
tors are given in the table below.
DEFG
A81063
B91586
C51257
(a) NRBC wishes to meet the distributor’s requirements at the minimum total transpor-
tation cost. Find the optimal plan.
(b) Show the network diagram corresponding to the solution in (a). That is, label each of
the arcs in the solution and verify that the flows are consistent with the given
information.
3.2. Assigning Tasks Suppose a data processing department wishes to assign five program-
mers to five programming tasks (one programmer to each task). Management has esti-
mated the total number of days each programmer would take if assigned to the
different jobs, and these estimates are summarized in the following table.
Task12345
Programmer
1 5025786460
2 4330705672
3 6028806668
4 5429756070
5 4532706275
(a) Determine the assignment that minimizes the total programmer days required to
complete all five jobs.
(b) Show the network diagram corresponding to the solution in (a). That is, label each of
the arcs in the solution and verify that the flows are consistent with the given
information.
(c) How would yoursolution change if programmer3 could not be assigned to tasks 2 or 4?
3.3. Shipping Grain The Sadeghian Company is in the business of buying and selling
grain. An important aspect of the company’s business is arranging for the purchased
grain to be shipped to customers. If the company can keep freight costs low, its profitabil-
ity will be improved. Currently, the company has purchased three rail cars of grain at
Peoria, seven rail cars at Iowa City, and six rail cars at Lawrence. Fourteen carloads of
grain have been sold. The locations and the amount sold at each location are as follows.
Location Rail car loads
Augusta 2
Gainesville 4
Oxford 3
Columbia 5
104 Chapter 3 Linear Programming: Network Models

All shipments must be routed through either Louisville or Dayton. Shown below are
the shipping costs per rail car from the origins to Louisville and Dayton and the costs
per rail car to ship from Louisville and Dayton to the destinations.
Louisville Dayton
Peoria 1800 1500
Iowa City 1400 1900
Lawrence 1200 1600
Augusta Gainesville Oxford Columbia
Louisville 4400 3600 3300 3200
Dayton 4200 3500 3100 2700
(a) Determine a shipping schedule that will minimize the freight costs necessary to
satisfy demand.
(b) Show the network diagram corresponding to the solution in (a). That is, label each of
the arcs in the solution and verify that the flows are consistent with the given
information.
3.4. Distributing a Product The Lincoln Lock Company manufactures a commercial
security lock at plants in Atlanta, Louisville, Detroit, and Phoenix. The unit cost of pro-
duction at each plant is $35.50, $37.50, $37.25, and $36.25, and the annual capacities are
18,000, 15,000, 25,000, and 20,000, respectively. The locks are sold through wholesale
distributors in seven locations around the country. The unit shipping cost for each plant –
distributor combination is shown in the following table, along with the forecasted demand
from each distributor for the coming year.
Tacoma
San
Diego Dallas Denver St Louis Tampa Baltimore
Atlanta 2.50 2.75 1.75 2.00 2.10 1.80 1.65
Louisville 1.85 1.90 1.50 1.60 1.00 1.90 1.85
Detroit 2.30 2.25 1.85 1.25 1.50 2.25 2.00
Phoenix 1.90 0.90 1.60 1.75 2.00 2.50 2.65
Demand 5.500 11.500 10.500 9.600 15.400 12.500 6.600
(a) Determine the least costly way of shipping locks from plants to distributors.
(b) Show the network diagram corresponding to the solution in (a). That is, label each of
the arcs in the solution and verify that the flows are consistent with the given
information.
(c) Suppose that the unit cost at each plant were $10 higher than the original figure. What
change in the optimal distribution plan would result? What general conclusions can
you draw for transportation models with nonidentical plant-related costs?
Exercises
105