Berg J.M., Tymoczko J.L., Stryer L. Biochemistry
Подождите немного. Документ загружается.

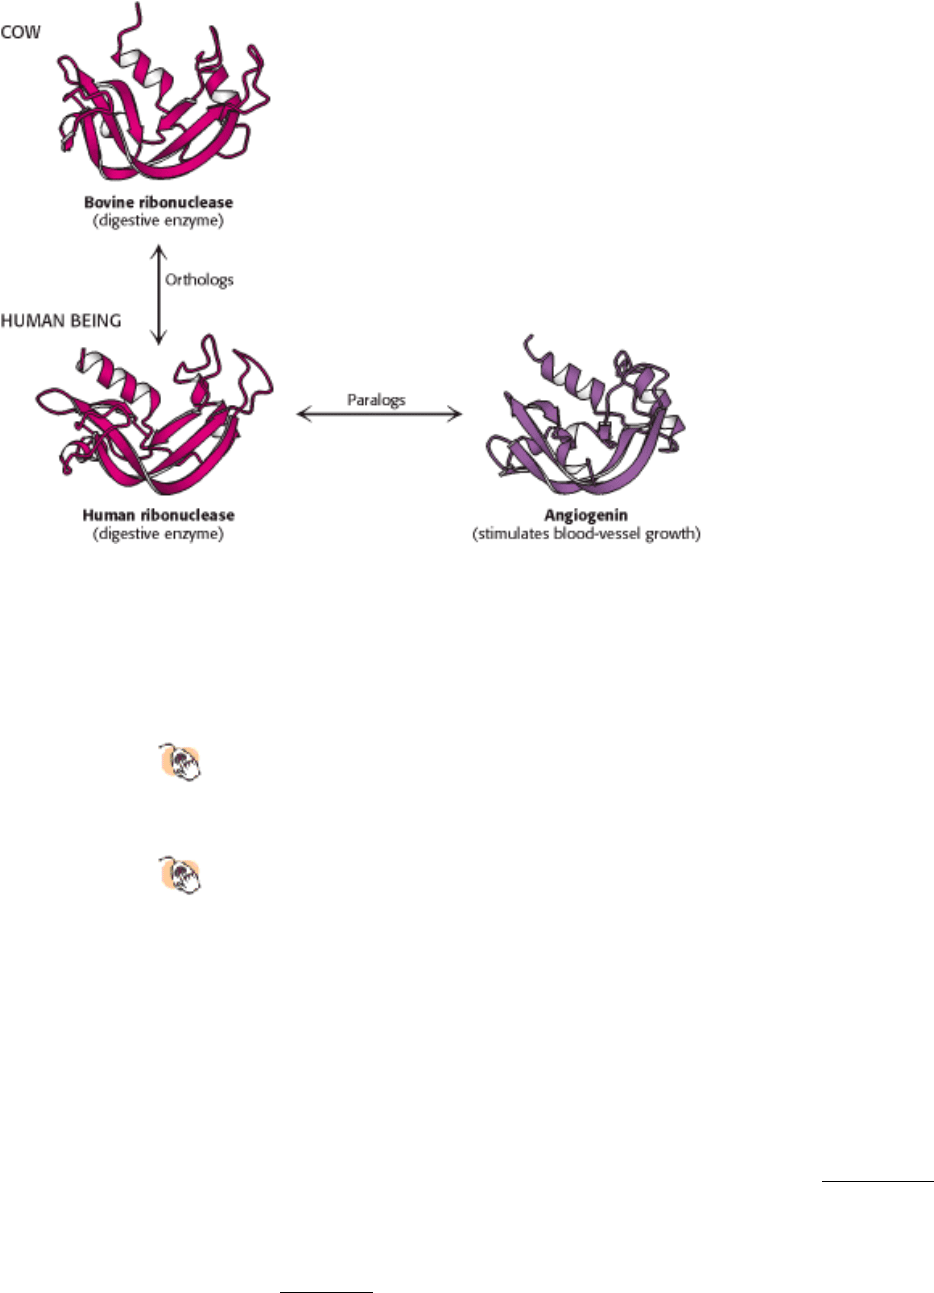
I. The Molecular Design of Life 7. Exploring Evolution 7.1. Homologs Are Descended from a Common Ancestor
Figure 7.3. Two Classes of Homologs. Homologs that perform identical or very similar functions in different organisms
are called orthologs, whereas homologs that perform different functions within one organism are called paralogs.
I. The Molecular Design of Life 7. Exploring Evolution
7.2. Statistical Analysis of Sequence Alignments Can Detect Homology
Conceptual Insights, Sequence Analysis, provides opportunities to
interactively explore issues involved in sequence alignment.
Conceptual Insights, appearing throughout the book, are interactive
animations that help you build your understanding of key biochemical
principles and concepts. To access, go to the Web site: www.whfreeman.com/
biochem5, and select the chapter, Conceptual Insights, and the title.
A significant sequence similarity between two molecules implies that they are likely to have the same evolutionary
origin and, therefore, the same three-dimensional structure, function, and mechanism. Although both nucleic acid and
protein sequences can be compared to detect homology, a comparison of protein sequences is much more effective for
several reasons, most notably that proteins are built from 20 different building blocks, whereas RNA and DNA are
synthesized from only 4 building blocks.
To illustrate sequence-comparison methods, let us consider a class of proteins called the globins. Myoglobin is a protein
that binds oxygen in muscle, whereas hemoglobin is the oxygen-carrying protein in blood (Section 10.2). Both proteins
cradle a heme group, an iron-containing organic molecule that binds the oxygen. Each human hemoglobin molecule is
composed of four heme-containing polypeptide chains, two identical α chains and two identical β chains. Here, we
consider only the α chain. We wish to examine the similarity between the amino acid sequence of the human α chain
and that of human myoglobin (Figure 7.4). To detect such similarity, methods have been developed for sequence
alignment.
How can we tell where to align the two sequences? The simplest approach is to compare all possible juxtapositions of
one protein sequence with another, in each case recording the number of identical residues that are aligned with one

another. This comparison can be accomplished by simply sliding one sequence past the other, one amino acid at a time,
and counting the number of matched residues (Figure 7.5).
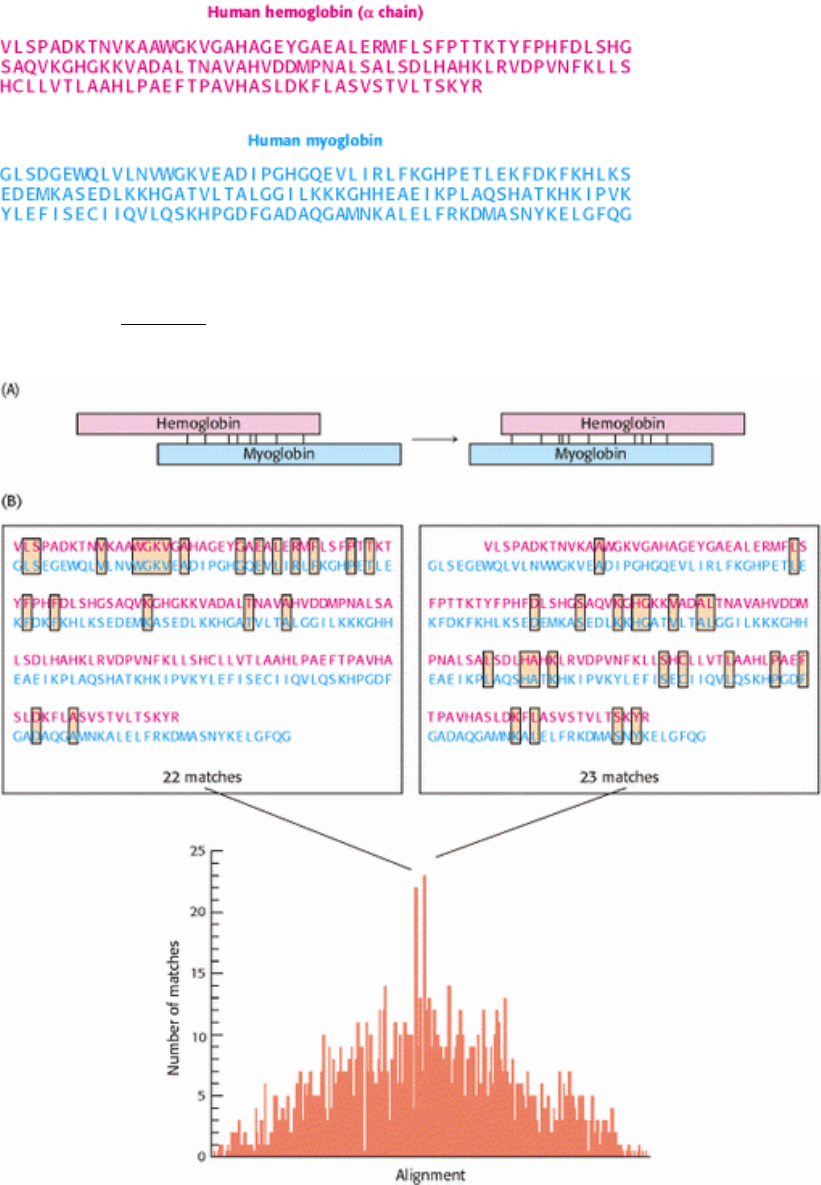
For hemoglobin α and myoglobin, the best alignment reveals 23 sequence identities, spread throughout the central parts
of the sequences. However, a nearby alignment showing 22 identities is nearly as good. In this alignment, the identities
are concentrated toward the amino-terminal end of the sequences. The sequences can be aligned to capture most of the
identities in both alignments by introducing a gap into one of the sequences (Figure 7.6). Such gaps must often be
inserted to compensate for the insertions or deletions of nucleotides that may have taken place in the gene for one
molecule but not the other in the course of evolution.
The use of gaps substantially increases the complexity of sequence alignment because, in principle, the insertion of gaps
of arbitrary sizes must be considered throughout each sequence. However, methods have been developed for the
insertion of gaps in the automatic alignment of sequences. These methods use scoring systems to compare different
alignments, and they include penalties for gaps to prevent the insertion of an unreasonable number of them. Here is an
example of such a scoring system: each identity between aligned sequences results in +10 points, whereas each gap
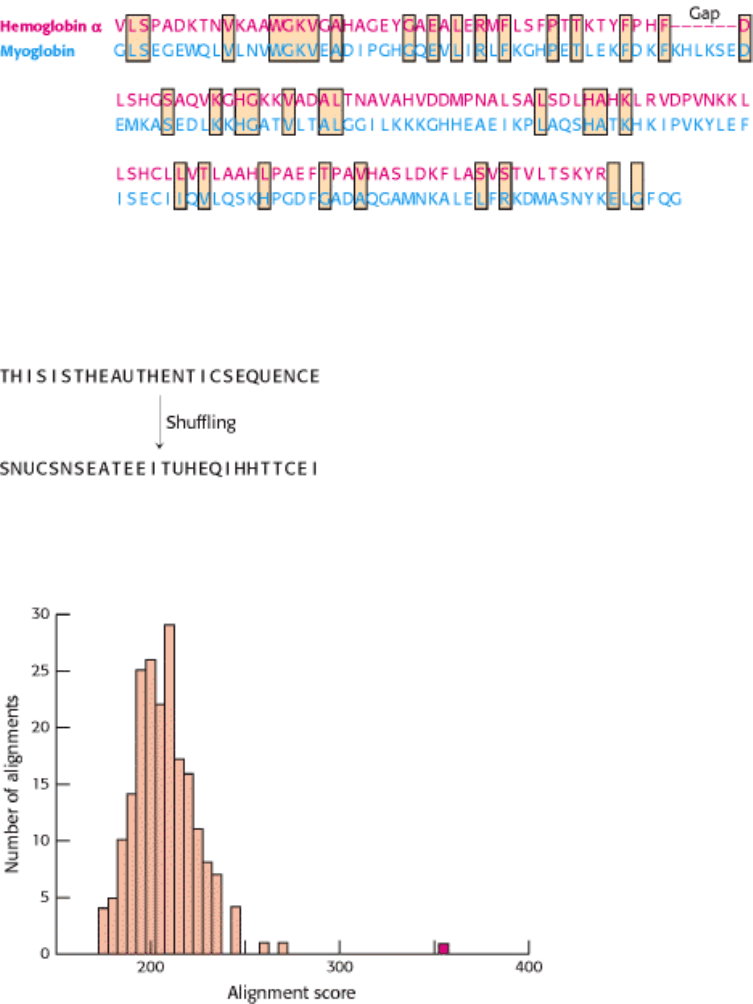
introduced, regardless of size, results in -25 points. For the alignment shown in Figure 7.6, there are 38 identities and 1
gap, producing a score of (38 × 10 - 1 × 25 = 355). Overall, there are 38 matched amino acids in an average length of
147 residues; so the sequences are 25.9% identical. The next step is to ask, Is this precentage of identity significant?
7.2.1. The Statistical Significance of Alignments Can Be Estimated by Shuffling
The similarities in sequence in Figure 7.5 appear striking, yet there remains the possibility that a grouping of sequence
identities has occurred by chance alone. How can we estimate the probability that a specific series of identities is a
chance occurrence? To make such an estimate, the amino acid sequence in one of the proteins is "shuffled" that is,
randomly rearranged and the alignment procedure is repeated (Figure 7.7). This process is repeated to build up a
distribution showing, for each possible score, the number of shuffled sequences that received that score.
When this procedure is applied to the sequences of myoglobin and hemoglobin α , the authentic alignment clearly stands
out (Figure 7.8). Its score is far above the mean for the alignment scores based on shuffled sequences. The odds of such a
deviation occurring owing due to chance alone are approximately 1 in 10
20
. Thus, we can comfortably conclude that the
two sequences are genuinely similar; the simplest explanation for this similarity is that these sequences are
homologous that is, that the two molecules have descended by divergence from a common ancestor.
7.2.2. Distant Evolutionary Relationships Can Be Detected Through the Use of
Substitution Matrices
The scoring scheme in Section 7.2.1 assigns points only to positions occupied by identical amino acids in the two
sequences being compared. No credit is given for any pairing that is not an identity. However, not all substitutions are
equivalent. Some are structurally conservative substitutions, replacing one amino acid with another that is similar in size
and chemical properties. Such conservative amino acid substitutions may have relatively minor effects on protein
structure and can thus be tolerated without compromising function. In other substitutions, an amino acid replaces one
that is dissimilar. Furthermore, some amino acid substitutions result from the replacement of only a single nucleotide in
the gene sequence; whereas others require two or three replacements. Conservative and single-nucleotide substitutions
are likely to be more common than are substitutions with more radical effects. How can we account for the type of
substitution when comparing sequences? We can approach this problem by first examining the substitutions that have
actually taken place in evolutionarily related proteins.
From the examination of appropriately aligned sequences, substitution matrices can be deduced. In these matrices, a
large positive score corresponds to a substitution that occurs relatively frequently, whereas a large negative score
corresponds to a substitution that occurs only rarely. The Blosum-62 substitution matrix illustrated in Figure 7.9 is an
example. The highest scores in this substitution matrix indicate that amino acids such as cysteine (C) and tryptophan (W)
tend to be conserved more than those such as serine (S) and alanine (A). Furthermore, structurally conservative

substitutions such as lysine (K) for arginine (R) and isoleucine (I) for valine (V) have relatively high scores. When two
sequences are compared, each substitution is assigned a score based on the matrix. In addition, a gap penalty is often
assigned according to the size of the gap. For example, the introduction of a gap lowers the alignment score by 12 points
and the extension of an existing gap costs 2 points per residue. Using this scoring system, the alignment shown in Figure
7.6 receives a score of 115. In many regions, most substitutions are conservative (defined as those substitutions with
scores greater than 0) and relatively few are strongly disfavored types (Figure 7.10).
This scoring system detects homology between less obviously related sequences with greater sensitivity than would a
comparison of identities only. Consider, for example, the protein leghemoglobin, an oxygen-binding protein found in the
roots of some plants. The amino acid sequence of leghemoglobin from the herb lupine can be aligned with that of human
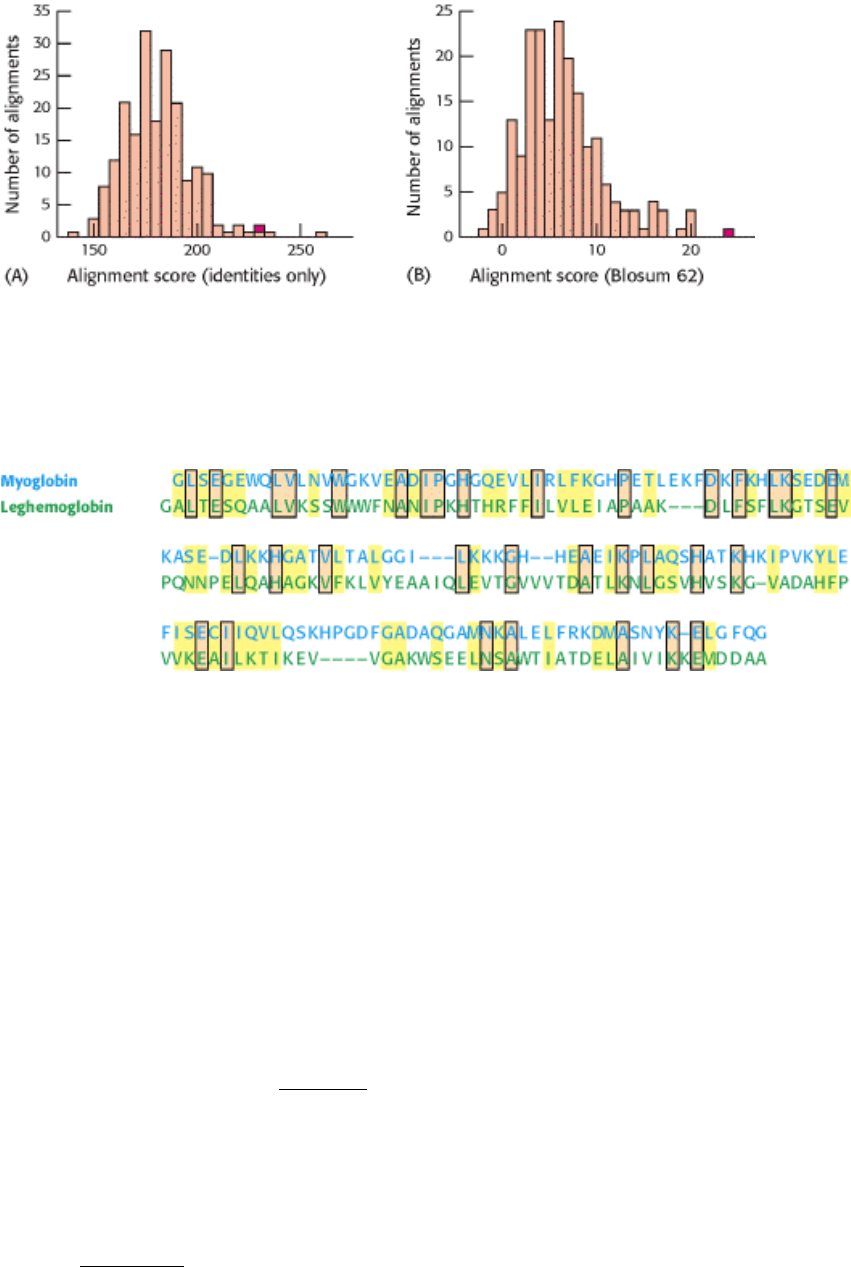
myoglobin and scored by using either the simple scoring scheme based on identities only or the Blosum-62 scoring
matrix (see Figure 7.9). Repeated shuffling and scoring provides a distribution of alignment scores (Figure 7.11).
Scoring based on identities only indicates that the odds of the alignment between myoglobin and leghemoglobin
occurring by chance alone are 1 in 20. Thus, although the level of similarity suggests a relationship, there is a 5% chance
that the similarity is accidental on the basis of this analysis. In contrast, users of the substitution matrix are able to
incorporate the effects of conservative substitutions. From such an analysis, the odds of the alignment occurring by
chance are calculated to be approximately 1 in 300. Thus, an analysis performed by using the substitution matrix reaches
a much firmer conclusion about the evolutionary relationship between these proteins (Figure 7.12).
Experience with sequence analysis has led to the development of simpler rules of thumb. For sequences longer than 100
amino acids, sequence identities greater than 25% are almost certainly not the result of chance alone; such sequences are
probably homologous. In contrast, if two sequences are less than 15% identical, pairwise comparison alone is unlikely to
indicate statistically significant similarity. For sequences that are between 15% and 25% identical, further analysis is
necessary to determine the statistical significance of the alignment. It must be emphasized that the lack of a statistically
significant degree of sequence similarity does not rule out homology. The sequences of many proteins that have
descended from common ancestors have diverged to such an extent that the relationship between the proteins can no
longer be detected from their sequences alone. As we will see, such homologous proteins can often be detected by
examining three-dimensional structures.
7.2.3. Databases Can Be Searched to Identify Homologous Sequences
When the sequence of a protein is first determined, comparing it with all previously characterized sequences can be a
source of tremendous insight into its evolutionary relatives and, hence, its structure and function. Indeed, an extensive
sequence comparison is almost always the first analysis performed on a newly elucidated sequence. The sequence
alignment methods heretofore described are used to compare an individual sequence with all members of a database of
known sequences.
In 1995, investigators reported the first complete sequence of the genome of a free-living organism, the bacterium
Haemophilus influenzae. Of 1743 identified open reading frames (Section 6.3.2), 1007 (58%) could be linked by
sequence-comparison methods to some protein of known function that had been previously characterized in another
organism. An additional 347 open reading frames could be linked to sequences in the database for which no function had
yet been assigned ("hypothetical proteins"). The remaining 389 sequences did not match any sequence present in the
database at the time at which the Haemophilus influenzae sequence was completed. Thus, investigators were able to
identify likely functions for more than half the proteins within this organism solely through the use of sequence-
comparison methods.
I. The Molecular Design of Life 7. Exploring Evolution 7.2. Statistical Analysis of Sequence Alignments Can Detect Homology
Figure 7.4. Amino Acid Sequences of Human Hemoglobin (α chain) and Human Myoglobin. Hemoglobin α is
composed of 141 amino acids; myoglobin consists of 153 amino acids. (One-letter abbreviations designating amino acids
are used; see Table 3.2.)
I. The Molecular Design of Life 7. Exploring Evolution 7.2. Statistical Analysis of Sequence Alignments Can Detect Homology
Figure 7.5. Comparing the Amino Acid Sequences of Hemoglobin α and myoglobin. (A) A comparison is made by
sliding the sequences of the two proteins past one another, one amino acid at a time, and counting the number of amino
acid identities between the proteins. (B) The two alignments with the largest number of matches are shown above the
graph, which plots the matches as a function of alignment.
I. The Molecular Design of Life 7. Exploring Evolution 7.2. Statistical Analysis of Sequence Alignments Can Detect Homology
Figure 7.6. Alignment with Gap Insertion. The alignment of hemoglobin α and myoglobin after a gap has been
inserted into the hemoglobin α sequence.
I. The Molecular Design of Life 7. Exploring Evolution 7.2. Statistical Analysis of Sequence Alignments Can Detect Homology
Figure 7.7. The Generation of a Shuffled Sequence.
I. The Molecular Design of Life 7. Exploring Evolution 7.2. Statistical Analysis of Sequence Alignments Can Detect Homology
Figure 7.8. Statistical Comparison of Alignment Scores. Alignment scores are calculated for many shuffled
sequences, and the number of sequences generating a particular score is plotted against the score. The resulting plot is a
distribution of alignment scores occurring by chance. The alignment score for hemoglobin α and myoglobin (shown in
red) is substantially greater than any of these scores, strongly suggesting that the sequence similarity is significant.
I. The Molecular Design of Life 7. Exploring Evolution 7.2. Statistical Analysis of Sequence Alignments Can Detect Homology
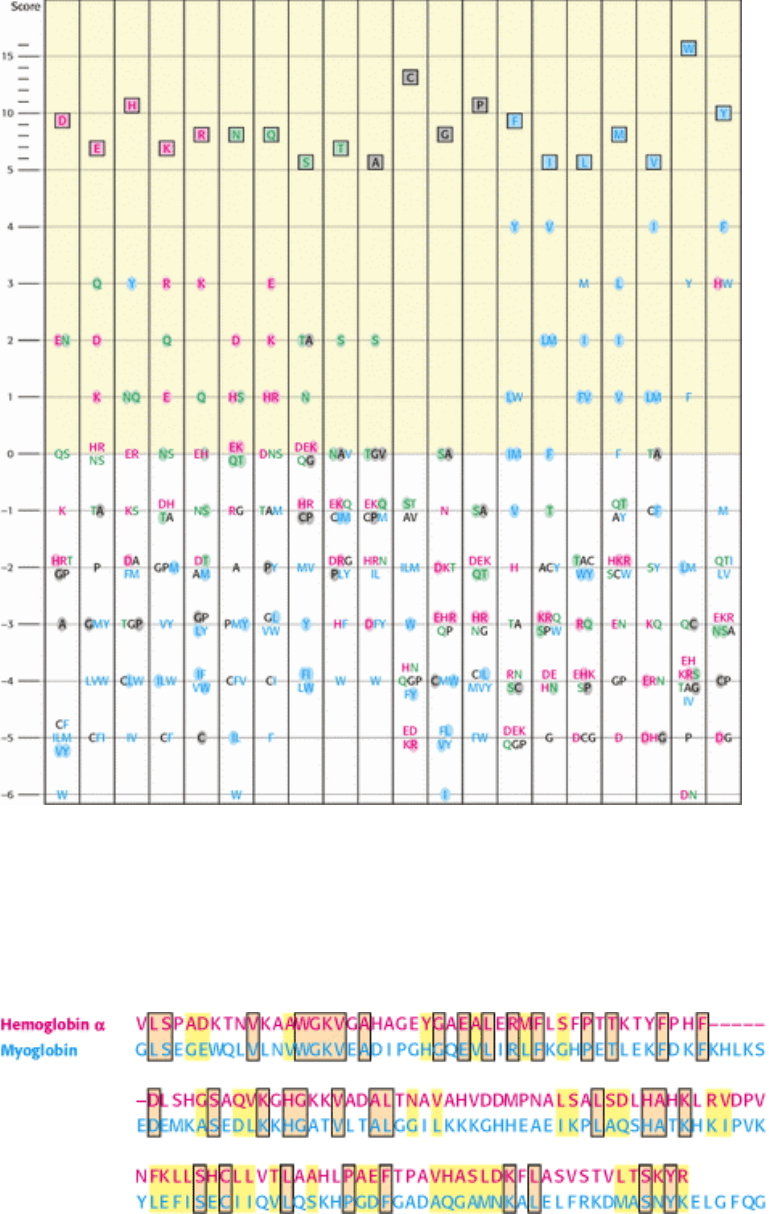
Figure 7.9. A Graphic View of the Blosum-62 Substitution Matrix. This scoring scheme was derived by examining
substitutions that occur within aligned sequence blocks in related proteins. Amino acids are classified into four groups
(charged, red; polar, green; large and hydrophobic, blue; other, black). Substitutions that require the change of only a
single nucleotide are shaded. To find the score for a substitution of, for instance, a Y for an H, you find the Y in the
column having H (boxed) at the top and check the number at the left. In this case, the resulting score is 3.
I. The Molecular Design of Life 7. Exploring Evolution 7.2. Statistical Analysis of Sequence Alignments Can Detect Homology
Figure 7.10. Alignment with Conservative Substitutions Noted. The alignment of hemoglobin α and myoglobin with
conservative substitutions indicated by yellow shading and identities by orange.
I. The Molecular Design of Life 7. Exploring Evolution 7.2. Statistical Analysis of Sequence Alignments Can Detect Homology
Figure 7.11. Alignment of Identities Only Versus the Blosum 62 Matrix. Repeated shuffling and scoring reveal the
significance of sequence alignment for human myoglobin versus lupine leghemoglobin with the use of either (A) the
simple, identity-based scoring system or (B) the Blosum-62 matrix. The scores for the alignment of the authentic
sequences are shown in red. The Blosum matrix provides greater statistical power.
I. The Molecular Design of Life 7. Exploring Evolution 7.2. Statistical Analysis of Sequence Alignments Can Detect Homology
Figure 7.12. Alignment of Human Myoglobin and Lupine Leghemoglobin. The use of the Blosum-62 substitution
matrix yields the alignment shown between human myoglobin and lupine leghemoglobin, illustrating identities (orange)
and conservative substitutions (yellow). These sequences are 23% identical.
I. The Molecular Design of Life 7. Exploring Evolution
7.3. Examination of Three-Dimensional Structure Enhances Our Understanding of
Evolutionary Relationships
Sequence comparison is a powerful tool for extending our knowledge of protein function and kinship. However,
biomolecules generally function as intricate three-dimensional structures rather than as linear polymers. Mutations occur
at the level of sequence, but the effects of the mutations are at the level of function, and function is directly related to
tertiary structure. Consequently, to gain a deeper understanding of evolutionary relationships between proteins, we must
examine three-dimensional structures, especially in conjunction with sequence information. The techniques of structural
determination are presented in Chapter 4.
7.3.1. Tertiary Structure Is More Conserved Than Primary Structure
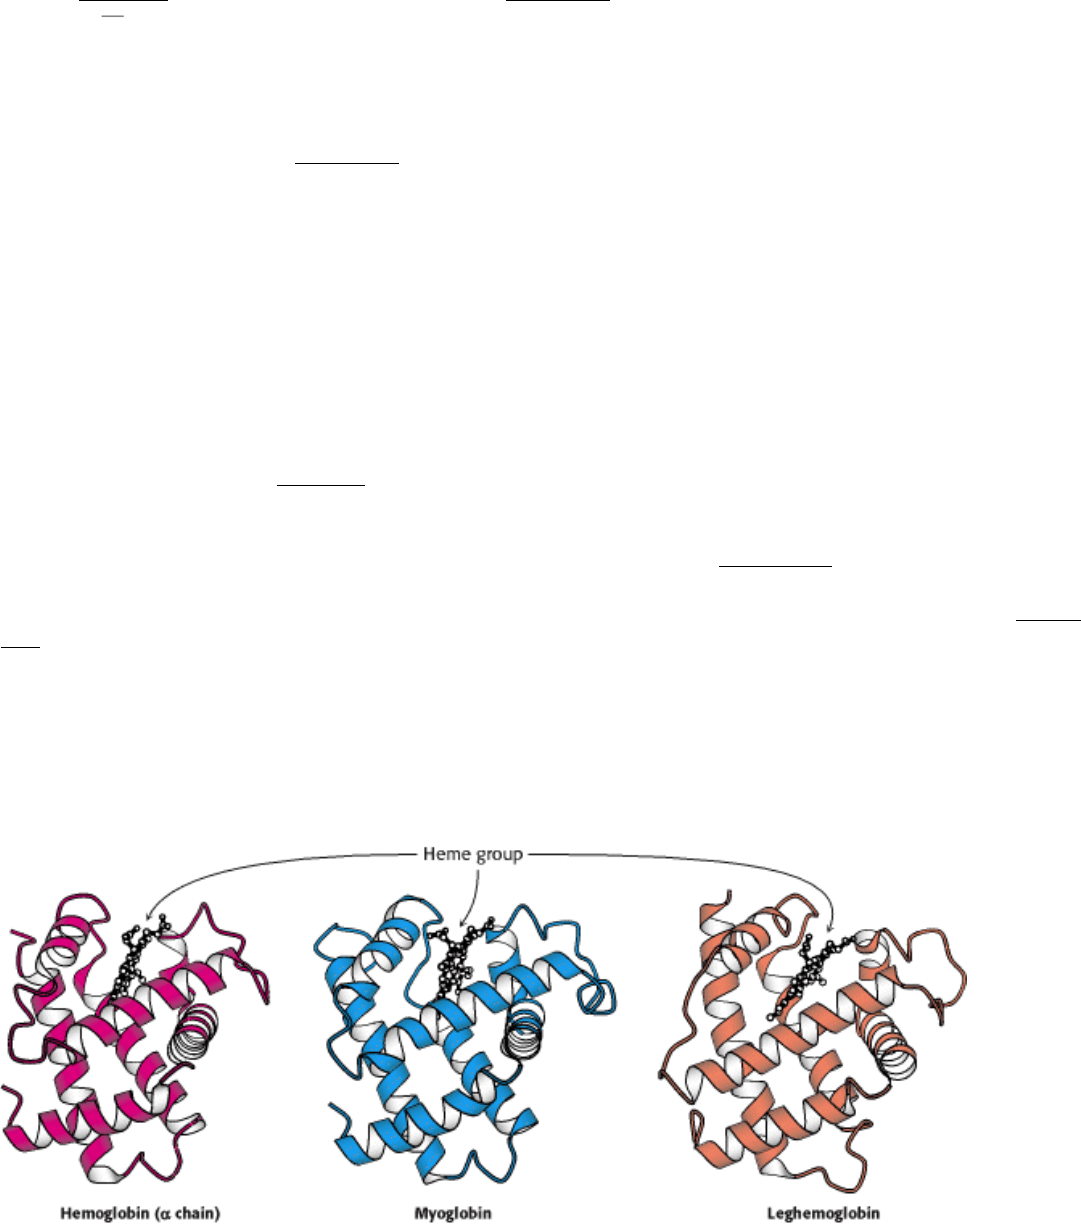
Because three-dimensional structure is much more closely associated with function than is sequence, tertiary structure is
more evolutionarily conserved than is primary structure. This conservation is apparent in the tertiary structures of the
globins (Figure 7.13), which are extremely similar even though the similarity between human myoglobin and lupine
leghemoglobin is just barely detectable at the sequence level and that between human hemoglobin ( α chain) and lupine
leghemoglobin is not statistically significant (15.6% identity). This structural similarity firmly establishes that the
framework that binds the heme group and facilitates the reversible binding of oxygen has been conserved over a long
evolutionary period.

Anyone aware of the similar biochemical functions of hemoglobin, myoglobin, and leghemoglobin could expect the
structural similarities. In a growing number of other cases, however, a comparison of three-dimensional structures has
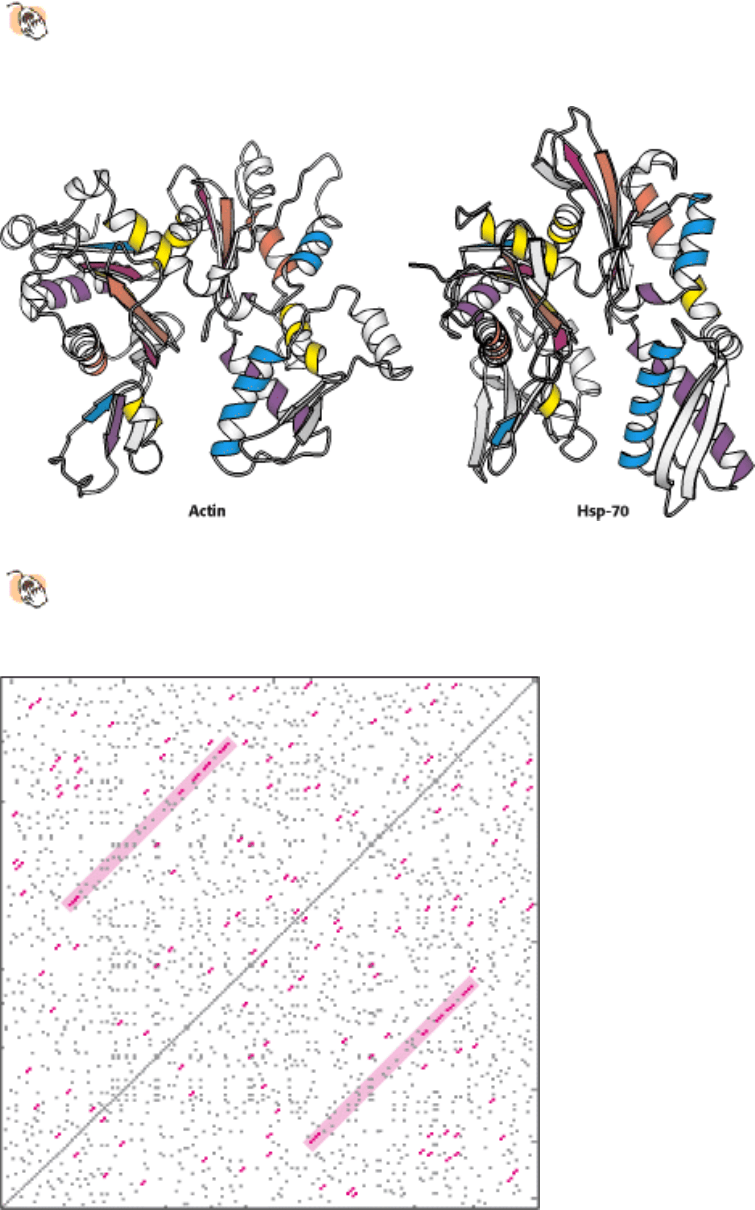
revealed striking similarities between proteins that were not expected to be related. A case in point is the protein actin, a
major component of the cytoskeleton, and heat shock protein 70 (Hsp-70), which assists protein folding inside cells.
These two proteins were found to be noticeably similar in structure despite only 15.6% sequence identity (Figure 7.14).
On the basis of their three-dimensional structures, actin and Hsp-70 are paralogs. The level of structural similarity
strongly suggests that, despite their different biological roles in modern organisms, these proteins descended from a
common ancestor. As the three-dimensional structures of more proteins are determined, such unexpected kinships are
being discovered with increasing frequency. The search for such kinships relies ever more frequently on computer-based
search procedures that allow the three-dimensional structure of any protein to be compared with all other known
structures.
7.3.2. Knowledge of Three-Dimensional Structures Can Aid in the Evaluation of
Sequence Alignments
The sequence-comparison methods described thus far treat all positions within a sequence equally. However,
examination of families of homologous proteins for which at least one three-dimensional structure is known has revealed
that regions and residues critical to protein function are more strongly conserved than are other residues. For example,
each type of globin contains a bound heme group with an iron atom at its center. A histidine residue that interacts
directly with this iron (residue 64 in human myoglobin) is conserved in all globins. After we have identified key residues
or highly conserved sequences within a family of proteins, we can sometimes identify other family members even when
the overall level of sequence similarity is below statistical significance. Thus, the generation of sequence templates
conserved residues that are structurally and functionally important and are characteristic of particular families of
proteins can be useful for recognizing new family members that might be undetectable by other means. A variety of
other methods for sequence classification that take advantage of known three-dimensional structures also are being
developed. Still other methods are able to identify relatively conserved residues within a family of homologous proteins,
even without a known three-dimensional structure. These methods are proving to be powerful in identifying distant
evolutionary relationships.
7.3.3. Repeated Motifs Can Be Detected by Aligning Sequences with Themselves
More than 10% of all proteins contain sets of two or more domains that are similar to one another. The aforedescribed
sequence search methods can often detect internally repeated sequences that have been characterized in other proteins.
Where repeated units do not correspond to previously identified domains, their presence can be detected by attempting to
align a given sequence with itself. This alignment is most easily visualized with the use of a self-diagonal plot. Here, the
protein sequence is displayed on both the vertical and the horizontal axes, running from amino to carboxyl terminus; a
dot is placed at each point in the space defined by the axes at which the amino acid directly below along the horizontal
axis is the same as that directly across along the vertical axis. The central diagonal represents the sequence aligned with
itself. Internal repeats are manifested as lines of dots parallel to the central diagonal, illustrated by the plot in Figure 7.15
prepared for the TATA-box-binding protein, a key protein in the initiation of gene transcription (Section 28.2.3).
The statistical significance of such repeats can be tested by aligning the regions in question as if these regions were
sequences from separate proteins. For the TATA-box-binding protein, the alignment is highly significant: 30% of the
amino acids are identical over 90 residues (Figure 7.16A). The estimated probability of such an alignment occurring by
chance is 1 in 10
13
. The determination of the three-dimensional structure of the TATA-box-binding protein confirmed
the presence of repeated structures; the protein is formed of two nearly identical domains (Figure 7.16B). The evidence
is convincing that the gene encoding this protein evolved by duplication of a gene encoding a single domain.
7.3.4. Convergent Evolution: Common Solutions to Biochemical Challenges
Thus far, we have been exploring proteins derived from common ancestors
that is, through divergent evolution. In
other cases, clear examples have been found of proteins that are structurally similar in important ways but are not
descended from a common ancestor. How might two unrelated proteins come to resemble each other structurally? Two
proteins evolving independently may have converged on a similar structure in order to perform a similar biochemical
activity. Perhaps that structure was an especially effective solution to a biochemical problem that organisms face. The
process by which very different evolutionary pathways lead to the same solution is called convergent evolution.
One example of convergent evolution is found among the serine proteases. These enzymes, to be discussed in more
detail in Chapter 9, cleave peptide bonds by hydrolysis. Figure 7.17 shows for two such enzymes the structure of the
active sites that is, the sites on the proteins at which the hydrolysis reaction takes place. These active-site structures are
remarkably similar. In each case, a serine residue, a histidine residue, and an aspartic acid residue are positioned in space
in nearly identical arrangements. As we will see, this is the case because chymotrypsin and subtilisin use the same
mechanistic solution to the problem of peptide hydrolysis. At first glance, this similarity might suggest that these
proteins are homologous. However, striking differences in the overall structures of these proteins make an evolutionary
relationship extremely unlikely (Figure 7.18). Whereas chymotrypsin consists almost entirely of β sheets, subtilisin
contains extensive α -helical structure. Moreover, the key serine, histidine, and aspartic acid residues do not occupy
similar positions or even appear in the same order within the two sequences. It is extremely unlikely that two proteins
evolving from a common ancestor could have retained similar active-site structures while other aspects of the structure
changed so dramatically.
7.3.5. Comparison of RNA Sequences Can Be a Source of Insight into Secondary
Structures
A comparison of homologous RNA sequences can be a source of important insights into evolutionary relationships in a
manner similar to that already described. In addition, such comparisons provide clues to the threedimensional structure
of the RNA itself. As noted in Chapter 5, single-stranded nucleic acid molecules fold back on themselves to form
elaborate structures held together by Watson-Crick base-pairing and other interactions. In a family of sequences that
form such base-paired structures, base sequences may vary, but base-pairing ability is conserved. Consider, for example,
a region from a large RNA molecule present in the ribosomes of all organisms (Figures 7.19). In the region shown, the E.
coli sequence has a guanine (G) residue in position 9 and a cytosine (C) residue in position 22, whereas the human
sequence has uracil (U) in position 9 and adenine (A) in position 22. Examination of the six sequences shown in Figure
7.20 (and many others) reveals that the bases in positions 9 and 22 retain the ability to form a Watson-Crick base pair
even though the identities of the bases in these positions vary. Base-pairing ability is also conserved in neighboring
positions; we can deduce that two segments with such compensating mutations are likely to form a double helix. Where
sequences are known for several homologous RNA molecules, this type of sequence analysis can often suggest complete
secondary structures as well as some additional interactions.
I. The Molecular Design of Life 7. Exploring Evolution 7.3. Examination of Three-Dimensional Structure Enhances Our Understanding of Evolutionary Relationships
Figure 7.13. Conservation of Three-Dimensional Structure. The tertiary structures of human hemoglobin ( α chain),
human myoglobin, and lupine leghemoglobin are conserved. Each heme group contains an iron atom to which
oxygen binds.
I. The Molecular Design of Life 7. Exploring Evolution 7.3. Examination of Three-Dimensional Structure Enhances Our Understanding of Evolutionary Relationships
Figure 7.14. Structures of Actin and the Large Fragment of Heat Shock Protein 70 (Hsp-70).
A comparison of the
identically colored elements of secondary structure reveals the overall similarity in structure despite the difference
in biochemical activities.
I. The Molecular Design of Life 7. Exploring Evolution 7.3. Examination of Three-Dimensional Structure Enhances Our Understanding of Evolutionary Relationships
Figure 7.15. A Self-Diagonal Plot For the TATA-Box-Binding Protein From the Plant Arabidopsis. Self-diagonal
plots are used to search for amino acid sequence repeats within a protein. The central diagonal is the sequence aligned
with itself. Red dots indicating a correspondence of amino acids appear where two or more amino acids in a row match.
Lines of dots, highlighted in pink, parallel to the central diagonal suggest an internal repeat.