Bhushan B. Handbook of Micro/Nano Tribology, Second Edition
Подождите немного. Документ загружается.

© 1999 by CRC Press LLC
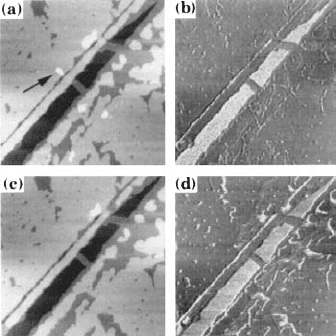
height, which demonstrates that the movement of these particles does not change the normal orientation
of the aliphatic chains. From this observation the shear strength at the interface between the substrate
and the LB film can be determined. The contact area is given by the geometric dimensions of the sheared
island. In the case of Figure 6.23 the island area is 4900 nm
2
. The lateral force to shear the island is 5 nN.
A shear strength of τ = 1 ± 0.2 MPa is deduced.
Another class of boundary lubricants are fluorocarbons. Direct comparison of fluorocarbons and
hydrocarbons by SFFM on a nanometer scale provides a very effective way to study the lubricating
properties of these compounds. In one particular study, a 1:1 molar mixture of arachidic acid
(C
19
H
39
COOH), AA, and partially fluorinated ether carboxylic acid (C
9
F
19
C
2
H
4
–O–C
2
H
4
COOH), PFCEA,
complexed to a polymeric counterion (polyvinylpyridine), was deposited by LB technique. Monolayers
are formed on oxidized silicon (Meyer et al., 1992b) while bilayers are formed on hydrophobized silicon
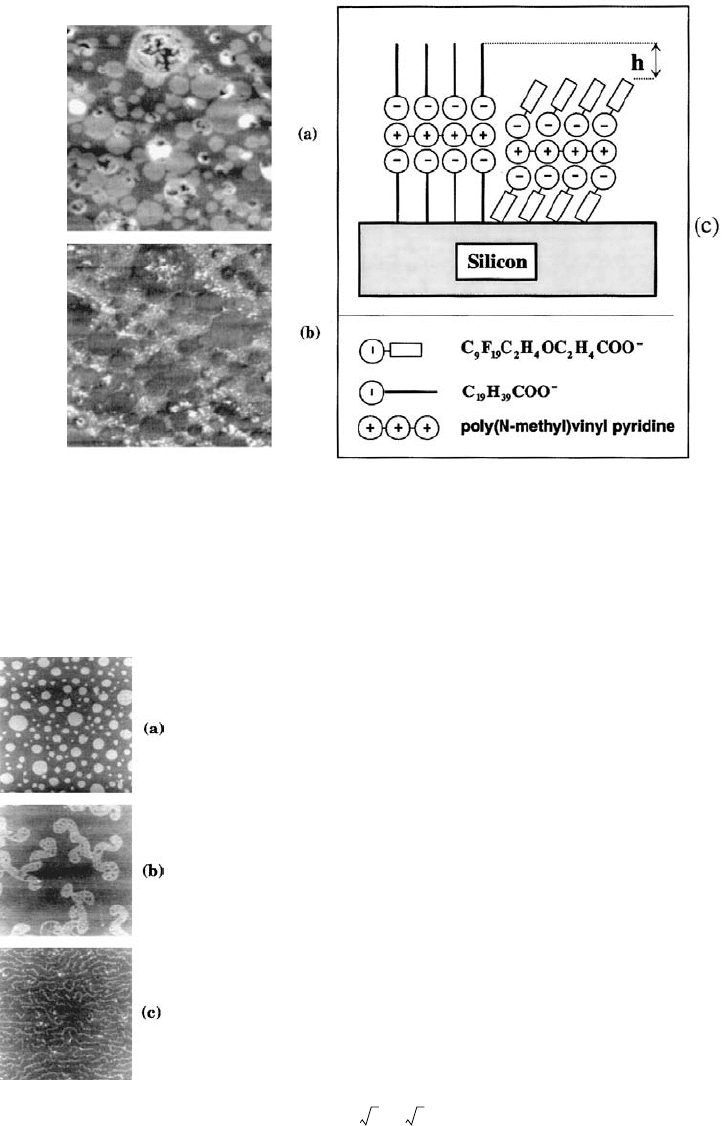
(100) (Overney et al., 1992). Figure 6.24 shows a (2 × 2 µm
2
) area of a mixed bilayer of AA and PFECA.
Circular domains are surrounded by a sealike, flat region. The step height is 1.6 nm, which corresponds
to approximately twice the difference between the longer hydrocarbons and the fluorocarbons (≈1 nm).
The deviation from the expected value is possibly related to a certain tilt of the fluorocarbons which
increases the step height. Therefore, the higher, circular domains are assigned to the hydrocarbons, while
the surrounding flat regions are formed of fluorinated bilayers. Within the circular domains, holes and
grooves of 5 nm depth are observed, which is consistent with the height of a bilayer of AA. The holes
reach all the way to the silica substrate, confirmed by the large frictional forces recorded on these regions.
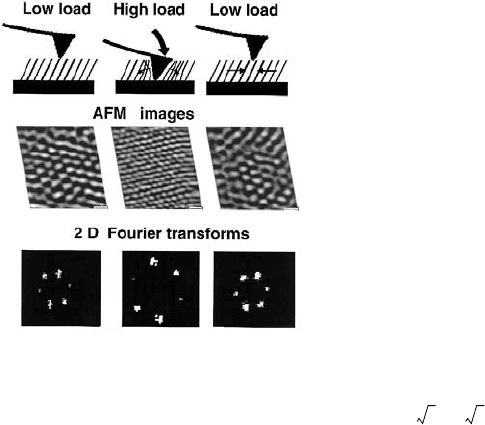
By contrast, the fluorinated regions are free of holes. With higher forces, we observe that particles of
hydrocarbons are pulled out and sheared out of the scanning area while the fluorocarbons remain
undeformed. Control films of pure AA and pure PFECA show the same tendency. The hydrocarbon films
have many defects and are easily deformed while the fluorinated films are rather uniform and cannot be
broken by the probing tip. The deformation conditions can be controlled by adjusting normal force and
scan speed. Therefore, nanometer lithography can be performed and “smileys” can be drawn, as shown
in Figure 6.25
The lateral force measurements indicate high friction on the substrate, intermediate friction on the
fluorocarbon and small friction on the hydrocarbon domains. The ratio is approximately 10:4:1. At first
sight the larger friction on the fluorinated regions is surprising. From compounds such as Teflon (PTFE),
reduced friction is expected. However, it is known from surface force apparatus measurements that the
shear strength on fluorinated LB films is increased compared to the hydrogenated films (Briscoe and
Evans, 1982). Nevertheless, fluorinated films are good boundary lubricants. They combine intermediate
friction with high resistance to rupture.
Finally, another interesting study on boundary lubrication is due to Salmeron et al. (1995). This group
prepared a alkythiol monolayer on an Au(111) surface. From electron-, helium-, and X-ray diffraction
FIGURE 6.23 Topographic , (a) and (c), and friction (b) and
(d), images of a double bilayer of Cd–arachidate. Scan size is
2
× 2 µm
2
, the loading force is 4 nN for the upper images and
16 nN for the lower ones. The total vertical scale in the topo-
graphic image is 24 nm and in the friction image 14 nN. No
damage is observed in the upper images at low loading forces.
At higher loading, however, small islands and flakes are
sheared away. For example, the island indicated by the arrow
in image (a) is not observed in (c). (From Meyer, E. et al.
(1992), Phys. Rev. Lett. 69(12), 1777–1780. With permission.)
© 1999 by CRC Press LLC
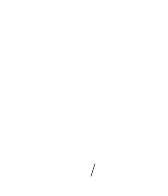
studies it is known that these thiols arrange in a × r30° structure with respect to the gold substrate.
This structure was also found by SFFM, which is noteworthy, since it shows that the structure of the
thiols remains stable in spite of the high tip–sample interaction which is typical for SFM and SFFM. As
the loading force was increased over a certain threshold value, which was of the order of a few hundred
FIGURE 6.24 SFFM images of a bilayer of a 1:1 mixture of PFECA and AA; the scan size is 4 × 4 µm
2
. The circular
islands in the topographic image (a) correspond to the hydrocarbons (AA) and the surrounding “sea” is composed
of fluorocarbons (PFCEA). The friction image (b) shows low friction on the hydrocarbon phase, medium friction
on the fluorocarbon phase, and high friction on the substrate. The ratio of the friction force on the different materials
is 1:4:10 and friction forces are in the nN range. (c) shows a schematic diagram of the arrangement of AA and PFCEA
on the hydrophobized silicon substrate. (From Overney, R. M. et al. (1992), Nature 359, 133–135. With permission.)
FIGURE 6.25 SFFM images of a monolayer of a 1:1 mixture of PFCEA and AA; the
scan size is 2.4
× 2.4 µm
2
. The topographic image (a) shows the circular islands of AA
which are also seen in Figure 6.24. If the forces applied with the SFFM tip are high
enough, “smileys” can be written. Image (b) shows the corresponding friction force
image. (From Meyer, E. et al. (1992), Thin Solid Films, 220, 132–137. With permission.)
3 3
© 1999 by CRC Press LLC
nanonewtons, a transition takes place and the Au(111) lattice of the underlying surface is imaged (see
Figure 6.26). This transition is reversible: as the force was lowered about 100 nN below the critical force
of the first transition, the image corresponding to the × r30° structure was recovered. The exact
values for the critical forces corresponding to the transitions varied from experiment to experiment and
depended mainly on the tip radius. Moreover, for tip radii larger than about 100 nm, these transitions
were not observed. The pressure at which the transitions occur was approximately constant, with a value
of about 1 GPa for the transition thiols–Au(111). This is a huge pressure, much higher than that at which
bulk gold yields and only slightly lower than the observed yield pressure of nanoscale gold contacts.
These observations are explained qualitatively as follows. At the critical pressure, the thiol chains are
pushed aside by the tip, but the head groups still remain chemically bound to the gold–substrate (see
Figure 6.26). Therefore, around the tip the thiol molecules are more densely packed, which results in a
radial inward pressure. This pressure can lift the tip again and restore the original configuration if the
pressure is reduced. A more-detailed analysis is found in Salmeron et al. (1995).
Summarizing, we have discussed some applications of SFFM that are relevant for a better understand-
ing of lubrication. Adsorbed water can act as a lubricant also on a nanoscale. Films of one molecular
height are found to be effective lubricants. The observation that one bilayer of lubricant causes about
the same reduction of friction as two or more layers is of interest for the fundamental understanding of
boundary lubrication. Thiol monolayers on gold show stability up to very high pressures.
6.3.3 Nanocontacts
The experiments discussed previously made use of the imaging capabilities of the SFFM. SFFM and SFM,
however, are not limited to the acquisition of images. Essentially, an SFM and quite generally a scanning
probe microscope can be operated in two modes, the well-known imaging mode where the sample is
scanned, and a nonimaging mode where the decay of the interaction is studied by varying the tip–sample
distance over a fixed location. The latter mode is sometimes referred to as the spectroscopic mode. In
this section, we will discuss the application of this mode to study the dependence of friction on the
normal force. For tribological studies, this mode is experimentally more complicated than in other cases,
since the tip evidently has to move in order to measure a friction force. Different experiment techniques
have been developed to measure friction at a point while moving the tip. On the one hand, several friction
images of the same region may be taken at different loads. By taking the friction value corresponding to
the same point in the different images, a friction vs. load curve is obtained. With this technique, friction
vs. load curves can be constructed at every point of the image (Meyer et al., 1992a). This method is
especially convenient if the sample is inhomogeneous and the variation of friction on different regions
of the sample is to be studied. Another method is to assume that the sample is homogeneous over a
certain area and take one friction image in which the loading force is increased or decreases for each new
FIGURE 6.26 SFM study of a C
18
alkanethiol monolayer at low
load (about 30 nN, left images), high load (about 300 nN, middle
images), and again low load (right images). The top images show
a schematic setup of the tip–sample system and the images in the
middle the acquired topographic signals. The lower images are two-
dimensional Fourier transforms of the corresponding topographic
images showing the relation between the alkanethiol monolayer and
the Au(111) lattices. (From Salmeron, M. et al. (1995), in Forces in
Scanning Probe Methods, pp. 593–598, NATO ANSI Series Kluwer,
Dordrecht. With permission.)
3 3

© 1999 by CRC Press LLC
scan line (Hu et al., 1995). In this case from each line a friction value is obtained as the average friction
force along the line. The whole “image” therefore gives a friction vs. load curve. This method gives a
higher signal-to-noise ratio, since all the points along a line are averaged to obtain one data point on the
friction vs. load curve. Finally, modulation techniques (Yamanaka and Tomita, 1995; Colchero et al.,
1996a) as well as histogram techniques (Marti, 1993; Lüthi et al., 1995) have also been proposed.
In macroscopic friction, the relation between friction and load is usually linear and is expressed through
the well-known friction coefficient: F
fric
= µ · F
n
. On the other hand, it is known experimentally that the
true contact area is also proportional to the loading force (Bowden and Tabor, 1964). Moreover, for
certain statistical distribution of roughness, this relation can be shown to be theoretically correct for
elastic contacts (Greenwood, 1992a,b). Therefore, on a macroscopic scale the linear relations
between loading force F
n
, friction force F
fric
, and contact area A hold. For low loads, we know from
different continuum models that for single asperity contacts, the relation between contact area and
loading force is not linear (see Section 6.4.2). The question arises, whether for nanoscale contacts the
last proportionality — F
fric
∝ A — is correct. This seems to be the case and correspondingly the friction
vs. load curve increases in a nonlinear way. Therefore, the notion of friction coefficient is no longer well
defined. Instead, it appears that shear strength is the fundamental parameter which describes friction in
nanoscale contacts (see discussion below).
The importance of studying frictional behavior with varying load was recognized already in the first
SFFM experiments. Mate et al. (1987) found a linear relation between friction and load for a tungsten
tip on graphite, in contrast to what has just been discussed. Essentially, the same behavior was found on
other surfaces in a series of early SFFM experiments. Putman et al. (1995) studied the friction vs. load
curve in various environments. In ambient conditions they found a nonlinear relation, whereas in an N
2
or an Ar atmosphere, where the liquid film covering tip and sample is reduced, a linear behavior is found.
Putman et al. propose that this dependence of friction on environmental conditions is due to the surface
roughness of the tip and to contaminants: in ambient conditions with about 55% relative humidity, the
liquid film and possibly also other contaminants may smooth the tip surface, so that the tip forms a
single contact with the sample. If the liquid film is absent, the contact may be due to microasperities
which lead to the same behavior as in macroscopic friction. The linear behavior of friction vs. load curves
is therefore considered to be an artifact. In a way, the tip–sample contact in this case is still “macroscopic,”
that is, at many ill-defined contacts and not at one single and well-defined contact. This study shows the
importance of having a well-defined tip.
To separate the dependence of the friction on the area from intrinsic properties of the tip–sample
contact, it is useful to rewrite the friction as (Schwarz et al., 1996)
(6.13)
where S
0
is a frictional force per area, A
c
is the contact area, R is the tip radius, and E* is an effective
modulus of elasticity which is defined in Equation 6.16. The last relation follows assuming a Hertzian
contact and a normal force F
n
which is corrected for the adhesion between tip and sample: F
n
= F
load
+
F
ad
, with F
load
external loading force and F
ad
the adhesion force between tip and sample. As discussed in
Section 6.4.2, other relations describing the load-area dependence can also be assumed. The frictional
force per unit area can be interpreted as the shear strength of the tip–sample junction, according to the
FF
FA
FA
n fric
n
fric
∝
∝
∝
FSAS
RF
E
c
n
fric
=⋅ =⋅π⋅
⋅
00
23
*
,
© 1999 by CRC Press LLC
macroscopic model of friction by Bowden and Tabor (1964). If this shear strength is assumed constant,
then the friction is only determined by the contact area. Another simple relation is
where p is the pressure on the contact, which can be shown to follow from a thermally activated model
of the Erying type (Eyring, 1935; Briscoe and Evans, 1982). With this dependence, Equation 6.13 can be
written as
(6.14)
The first term is proportional to the contact area, while the second is proportional to the normal force,
as in the case of macroscopic friction. Note that this conceptually simple linear dependence on normal
force is due to a nontrivial dependence of the friction on the area and on the shear strength.
In their experiments Schwarz et al. (1996) investigated the friction of C
60
on a GeS substrate as a
function of load. Interestingly, they found a different behavior on these two materials. While the friction
vs. load curve on the C
60
followed excellently an F
2/3
dependence, the friction vs. load curve on the GeS
substrate was approximately linear. For a good fit to the experimental data on the GeS substrate, however,
the friction had to be described by both factors of Equation 6.14, which implies a complex relation.
In a similar experiment, Carpick et al. (1996a,b) found that the friction vs. load curve of a Pt tip on
mica was described almost perfectly assuming a constant shear strength and a load–area relation as
predicted by the JKR theory (see Section 6.4.2, Equation 6.20) of elastic contacts. To avoid possible
contamination, the experiments were performed in UHV, including the cleaving of the mica to expose
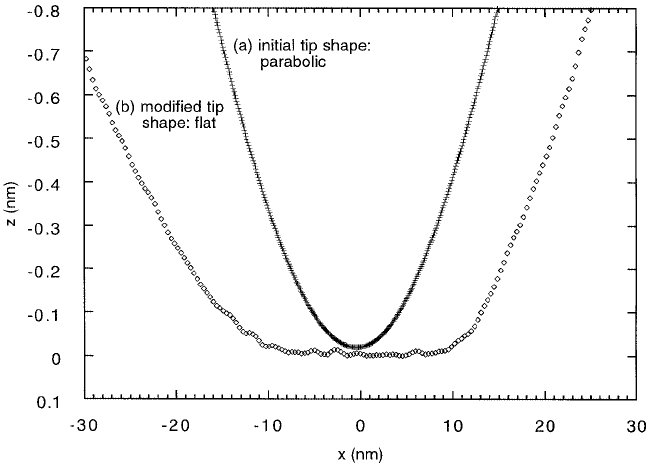
a fresh surface. To ensure a well-defined tip shape, the tip was imaged using a faceted SrTiO
3
(305)
surface, as proposed by Sheiko et al. (1993), and found to be paraboloidal to a very good approximation.
To acquire one friction vs. load curve, images were taken by varying the load for every line, as discussed
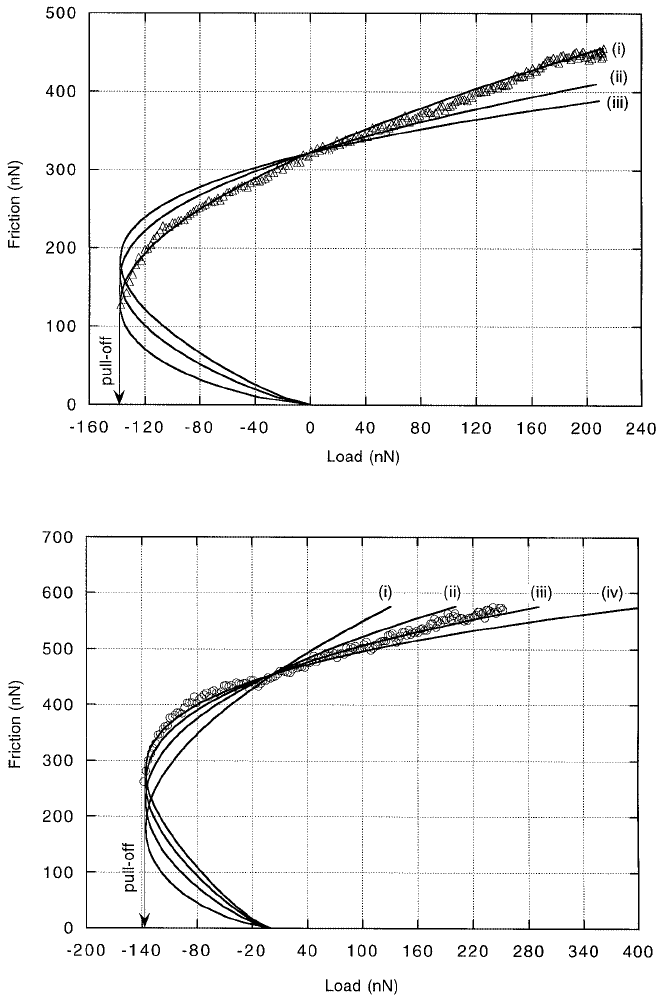
above. Typical friction vs. load curves are shown in Figure 6.27. The nonlinear behavior is evident. The
experimental data points have been fitted to a contact area vs. load curve as predicted by the JKR theory.
Since the agreement between the fit and the data is very good, the shear strength of the contact can be
assumed to be constant, so that the dependence on friction is determined only by the contact area.
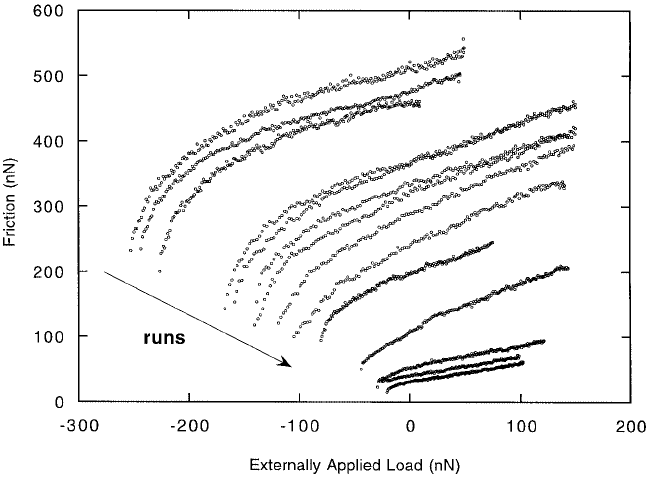
Another result of these experiments was that adhesion and friction decreased by more than an order
of magnitude during the experiments, that is, as more and more curves were acquired (Carpick et al.,
1996b). The authors checked that this decrease was not due to wear of the tip, which in any case would
increase the radius of curvature and thus also adhesion as well as friction. Every friction vs. load curve
could be fitted by a JKR curve as described above (see Figure 6.28). From this, the authors deduce that
the decrease in friction is due to changes in the chemistry of the interface, which appears in the JKR
equation through the surface energy (see Equation 6.20). Since the experiments were performed in UHV,
not many mechanisms can explain this behavior. The authors propose either progressive graphitization
of hydrocarbon residues on the tip, or adsorption of K from the mica on the tip as possible explanations.
Nevertheless, it is quite surprising that even under UHV conditions, where contaminant layers are absent,
the friction of the tip–sample junction can be affected in such a dramatic way.
To investigate the effect of tip shape on the friction vs. load curve, Carpick et al. deliberately blunted
the tip and showed that unlike in the previous experiment the corresponding friction vs. load curve did
not follow the JKR area–load relation for a spherical tip in contact with a flat sample (Carpick et al.,
1996a). As shown in Figure 6.27, an appropriate extension of the JKR theory for a tip with a general
shape y(r) = c · r
n
, however, could be fitted almost perfectly to the experimental data. The best fit
corresponded to the exponent n which was deduced from the measured tip shape by imaging a faceted
SrTiO
3
(305) surface. Therefore, although tip shape determines the friction vs. load curve in a nontrivial
way, if the tip shape is known its contribution can be taken into account.
Sp S p
()
=+⋅
0
α ,
FaFbF
nnfric
=⋅ +⋅
23
.
© 1999 by CRC Press LLC
Similar results have been reported recenty by Schwarz et al. (1997). They show that even though the
absolute friction scales with the tip radius, its fundamental behavior does not vary for tip radii between
10 and 125 nm. In these experiments they also find a shear strength which is independent of pressure.
The experiments described above were limited to the study of the frictional behavior of the tip–sample
contact. Experiments have also been performed to investigate other properties of tip–sample contacts
with scanning probe methods. More specifically, the formation of nanonecks has been investigated by
FIGURE 6.27
A
B
© 1999 by CRC Press LLC
STM by measuring the current as a sharp tip is indented into a sample surface. The conductance of these
necks has been shown to vary in integer steps of the quantum resistance (Agraït et al., 1993; Pascual et al.,
1993). This can be explained in terms of the number of conductance channels which fit in the minimum
cross section of the tip–sample contact. Other experiments have been performed to study the physics of
tip–sample contact not only with STM but also in combination with SFM (Rubio et al., 1996; Stalder,
1996). These studies suggest that during neck formation very strong pressures, compressive as well as
tensile, act in the neck and that substantial atomic rearrangement occurs, as predicted by molecular
dynamics simulations. Moreover, on a nanoscale materials seem to be much harder than on a macroscopic
scale (Agraït, 1996), which is in accordance with other studies (Bhushan and Koinkar, 1994) and can be
explained by the absence of defects in small nanometric volumes. These studies on the formation of
nanonecks have had up to now no direct consequences on atomic-scale tribology; we believe, however,
that both topics are very strongly related and that in the near future similar experiments will be done
which are indeed directly connected to tribology on a nanoscale.
6.3.4 Quartz Microbalance Experiments in Tribology
In SFM and SFFM the interaction between tip and sample is usually very strong and correspondingly
the pressures are very high. To study tribological processes at very low interaction and pressures, the
SFFM is at the moment not the ideal instrument. In this regime, the quartz microbalance (QCM) has
been applied successfully to study energy dissipation on an atomic scale. A QCM is essentially a crystalline
piece of quartz glass. Since this material is piezoelectric, if it is cut and segmented appropriately, it can
FIGURE 6.27 A: Friction vs. load curve of a Pt tip on a mica surface taken under UHV conditions. The curve
marked (i) corresponds to an area vs. load curve as predicted from the JKR theory for a spherical tip. B: Friction vs.
load curve of a Pt tip on mica after blunting of the tip. The curves shown corresponds to area vs. load curves according
to JKR theory for increasingly flatter tip profiles: curve (i) is for a spherical or paraboloidal tip (z(r) ~ r
2
), curve (ii)
for z(r) ~ r
4
, curve (iii) for z(r) ~ r
6
, and curve (iv) for z(r) ~ r
8
. Each of these curves has been least-square fitted
to the experimental data, the best fit being for the shape measured experimentally and shown below. C: Experimentally
determined tip profiles (see text) showing the initial and final tip shape which agree very well with the corresponding
friction vs. load curves. (From reference Carpick, R. W. et al. (1996), J. Vac. Sci. Technol. B 14(2), 1289. With
permission.)
C
© 1999 by CRC Press LLC
be oscillated mechanically by applying a harmonic signal of correct frequency. Commonly a QCM is
used in vacuum chambers to measure evaporation rates: when material is deposited on the QCM, due
to the increment in mass its resonance shifts and from this shift the mass can be calculated (Lu and
Czanderna, 1984).
To study tribological processes, Krim and co-workers (Krim et al., 1991; Daly and Krim, 1996) use a
QCM which is driven in transverse mode, the motion of the QCM being then parallel to its surface.
Since a QCM is essentially a harmonic oscillator, three parameters determine its behavior: the resonance
frequency, a driving amplitude, and the quality factor Q of the resonance, which is a measure of how
much energy is lost during one oscillation. Typical values for the resonance frequency f
0
, driving ampli-
tude a
0
, and the Q-factor in the experiments to be described are f
0
≈ 8 MHz, a
o
≈ 20 nm, and Q ≈ 10
5
,
respectively.
A metal film — usually Au or Ag — is evaporated prior to the experiment as the substrate for the
friction measurements. The surface roughness of these films was measured by STM, X-ray reflectivity,
and liquid nitrogen adsorbtion measurements. Since the estimated sliding distance of the films on the
substrate is of the order of 2 nm and therefore considerably smaller than the typical grain size, the effect
of surface roughness is assumed to be small. Experiments are performed in a vacuum chamber in a liquid
nitrogen bath. A noble gas — Kr or Xe — is brought into the chamber and adsorbs under equilibrium
conditions onto the metal surface on the QCM. At 77.4 K these films are known to adsorb as one- or
two-monolayer-thick films. The first monolayer adsorbs first as a liquid, which then solidifies as the
partial pressure of the gas is increased and the monolayer is compressed.
During an experiment, a film is deposited by slowly increasing the partial pressure of the gas, while
the shift in resonance frequency and the variation of the Q-factor is measured. The shift in resonance
frequency δf is proportional to the (areal) mass density ρ (unit: Kg/m
2
) deposited on the QCM, and the
FIGURE 6.28 Series of friction vs. load curves of a Pt tip in contact with mica taken under UHV conditions. As
more and more curves are acquired, the pull-off force as well as the friction force decreased. Each of these curves
can be fitted to a JKR curve. The reduction of adhesion and friction observed in this experiment is not due to a
change in tip shape as in the previous figure, but due to a reduction in surface energy and shear stress which is caused
probably by variations of the structure or chemistry of the interface. (From reference Carpick, R. W. et al. (1996),
Langmuir 12(3), 3334–3340. With permission.)
© 1999 by CRC Press LLC
variation of the Q-factor is a measure of the energy dissipated by the presence of the film. From these
measured quantities, the so-called slip time,
of the film is calculated (Krim and Widom, 1988). This slip time can be interpreted as a characteristic
time until friction stops the relative motion of the film, i.e., a damping time. Since the total mass is
proportional to the frequency shift, the slip time can be considered to be normalized with respect to the
number of atoms which have been adsorbed. Assuming a friction force proportional to the sliding velocity
of the film (Stokes law), it can be shown that 1/τ is proportional to the mean energy dissipated per atom
(Krim et al., 1991). The friction itself can be written in terms of the shear stress S needed to slide the
film over the surface:
where ρ is the areal mass density and v the velocity of the film. This relation implies a friction which is
proportional to velocity and therefore of Stokes-type as is typical for gas or liquid flow. In fact, the
coefficient ρ/τ can be interpreted as interfacial viscosity. The velocity dependence of the friction has been
confirmed experimentally (Krim et al., 1991).
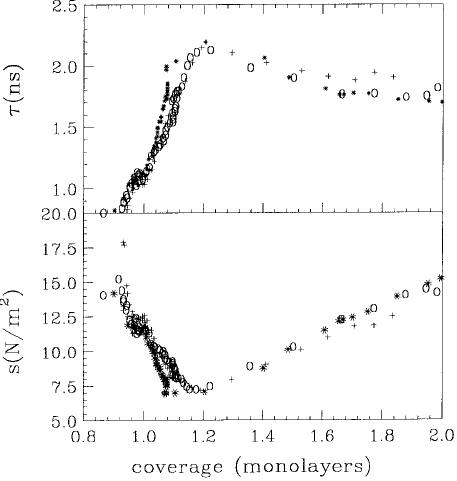
Figure 6.29 shows the result of an experiment where xenon is adsorbed on a silver (111) surface (Daly
and Krim, 1996, 1997). The slip time τ decreases until the first monolayer is completed. As this monolayer
is compressed and solidifies, the slip time increases; therefore, the friction of the film decreases (not
shown). The same behavior is observed for Kr on Ag and Au (Krim et al., 1991). This is interesting and
counterintuitive because it means that, unlike in macroscopic friction, a solid noble gas film on a metal
substrate slides easier than a liquid one. The films are thus “slippier when dry” (Krim, 1996). Similar
results have been obtained theoretically by Cieplak et al. (1994), who attribute the friction to phonon
processes within the film–substrate system (see also Solokoff, 1990). Other possible contributions to the
friction are due to the electronic resistance felt by the electrons in the metals as they are influenced by
the moving film (Levitov, 1989; Persson, 1991, 1993). The experiments by Krim and co-workers, including
some recent results (Daly and Krim, 1996, 1997), seem to indicate that phonon processes are mainly
responsible for the friction observed. This is in accordance with friction in SFFM, which can also be
interpreted in terms of phonon creation (see Section 6.4.3.3). The underlying mechanism would then
be similar even though the range of shear stress is almost ten orders of magnitudes different.
6.4 Modeling of an SFFM
In the preceding sections, many experiments have been described which we believe are relevant to the
processes governing friction on an atomic scale. We have tried to explain most results with simple
arguments along the way. No deeper knowledge of theoretical work in nanotribology has been assumed.
In this section, the attempt will be made to explain some of the addressed experiments in more detail
and to describe basic concepts involved in SFM and SFFM. Since SFM, SFFM, and nanotribology in
general are part of a still very young field, many phenomena are still far from being fully understood,
both from an experimental as well as from a theoretical point of view. The fundamental question in
tribology is, of course, how energy is dissipated. Essentially, two different mechanisms have been pro-
posed, one involves phonic and the other one electronic excitation. Very much has also been learned
from molecular dynamics simulations as well as from first principles calculations. To study tribological
phenomena, these latter approaches are very difficult and complex, due to the large number of atoms
τ
δ
δ
=
π
()
1
4
1 Q
f
,
Sv=⋅
ρ
τ
© 1999 by CRC Press LLC
involved in tribological processes: while the main interaction might involve only a few atoms on each of
the sliding surfaces, the elastic deformation reaches much farther into the two interacting bodies and
finally, the volume into which elastic waves — that is, phonons — can be scattered is even larger.
Therefore, very different length scales are typically involved in tribological processes even if interaction
is through a small, well-defined nanometer contact. Similar arguments lead to the conclusion that also
very different timescales can be involved. Recently, mixed atomistic and continuum models have been
proposed (Tadmor et al., 1996), but the situations treated up to now with this approach are very simple.
Molecular dynamics and surface physics are treated in detail in this book in Chapters 11 and 3 by Harrison
et al. and by Ferrante and Abel, respectively. Essentially, the scope of this section is to describe the processes
encountered in SFFM. In particular, we will try to address the following main questions in SFFM:
What is the reason for the high apparent resolution?
What is the mechanism for the stick-slip motion? and
How and where is energy dissipated?
We will limit the present section to simple models which, although much less precise, still explain some
fundamental aspects of friction on an atomic scale (Zhong and Tománek, 1990; Tománek et al., 1991;
Colchero and Marti, 1995; Colchero et al., 1996b; Gyalog et al., 1995). These models can be considered
an extension of a molecular model of friction proposed by Tomlison (1929).
6.4.1 Resolution in SFFM
Mostly, the total interaction of tip and sample in SFM can be calculated by adding all the interactions
between infinitesimal volumes of tip and sample. Here, a similar approach will be presented, which
however will assume that the interaction takes place between the surfaces of tip and sample (for a similar
FIGURE 6.29 Top: Slip time vs. coverage for a xenon film deposited on a silver surface for three different surfaces.
One monolayer has been defined as 5.970 atoms/nm
2
, the spacing of the compressed monolayer, and the slip time
is normalized with respect to this point. Bottom: Corresponding shear stress for the xenon film on the silver surfaces
as a function of coverage. This shear stress is the force per unit area required to slide the film at a constant speed of
1 cm/s (the order at which the films are moving). (From Daly, C. and Krim, J. (1996), Phys. Rev. Lett. 76(5), 803–806.
With permission.)