Bhushan B. Handbook of Micro/Nano Tribology, Second Edition
Подождите немного. Документ загружается.

© 1999 by CRC Press LLC
then bends again in the new scan direction — the signal polarity therefore changes sign — until the
critical force is reached. Then the whole stock-slip process starts again but with opposite polarity. We
note that the area enclosed by the lateral force curve has the dimension of energy and, in fact, this area
represents the energy dissipated during each scanning cycle. A more precise description of stick-slip
behavior is given in Section 6.4.3.3.
If the sample is scanned slowly in the direction perpendicular to the fast scan which corresponds to
the acquisition of the lateral force curves, then two-dimensional maps of the lateral force are obtained,
as shown in Figure 6.7. These two figures illustrate the two usual ways of representing data in SFFM.
From the lateral force curve the friction is directly read off: the friction corresponds to half the height
of the lateral force curve. Two-dimensional images, on the other hand, show the variation of the friction
on different spots on the sample. Most conveniently, two-dimensional images with the data corresponding
to the back-and-forth scan are acquired simultaneously; then all data is available and one can choose
between the most convenient representation.
The amazing and puzzling feature about the two figures shown is the fact that they show a variation
of the lateral force that corresponds to the atomic periodicity. For a tungsten tip with a typical radius of
50 nm on graphite (E
HOPG
5GPa) and loading forces of up to 100 µN, Equation 6.16 leads to a contact
radius of almost 100 nm, corresponding to a contact of more than 100,000 unit cells. One possible
explanation for this evident misfit between contact area and apparent resolution is that imaging is due
to a flake of surface material which adheres to the tip and is dragged over the surface. Since the periodicity
of the “tip”-flake and the sample is equal, this would lead to a coherent interaction and thus to the
observed atomic periodicity. This explanation is very plausible for the present experiment and generally
for experiments involving layered surface materials and high loads. Similar experiments performed by
the same group on mica, which is also a layered material, showed again atomic resolution of the friction
force (Erlandson et al., 1988).
These first experiments had two major difficulties. First, the normal force could not be controlled
directly but had to be estimated. Second, the cantilevers used had a high force constant. The rapid
development of SFM led, on the one hand, to microfabricated cantilevers with integrated tips (Albrecht,
1989; Albrecht et al., 1990; Akamine et al., 1990; Wolter et al., 1991) and, on the other hand, to new
detection schemes, in particular to the optical beam deflection method (Meyer and Amer, 1988, 1990b;
Alexander et al., 1989; Marti et al., 1990). Historically, it is interesting to note that both developments —
and not only the second as is commonly assumed — were equally important for the success of SFFM.
In fact, a year before the successful application of the optical beam deflection method for measuring
lateral forces two of the authors had already tried this technique with the first microfabricated cantilevers.
However, since these first cantilevers lacked the tip which induces the bending moment that causes the
cantilever to twist, no reasonable signal corresponding to lateral forces was detected.
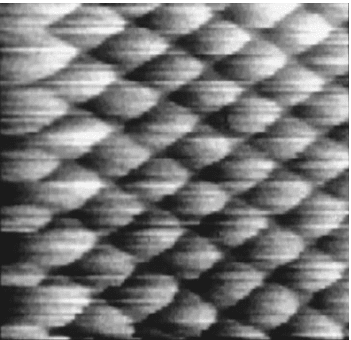
FIGURE 6.7 Two-dimensional map of the lateral force
recorded as the tip is moved 2 nm from left to right. The
spatial variation of the lateral force has the periodicity of
the HPOG surface. (From Mate, C. M. et al. Phys. Rev. Lett.
59, 1942–1945. With permission.)
© 1999 by CRC Press LLC
The optical beam deflection method in combination with microfabricated cantilevers and integrated
tips not only allowed the simultaneous measurement of normal and lateral forces, it also increased the
lateral force resolution by more than one order of magnitude. Figure 6.8 shows an image corresponding
to the topographic signal measured simultaneously with the lateral force taken at an estimated loading
force of about 20 nN. As in the previously described experiment, the lateral force signal shows the typical
stick-slip behavior. Surprisingly, the slip motion occurs near a minimum in the topographic signal and
not near its maximum, which is what is predicted by usual models. One possible explanation of this
behavior is that a delay in the topographic signal is introduced due to the finite response time of the
feedback loop.
A detailed study of the relative phase between the topographic and the lateral force signal is due to
Ruan and Bushan (1994b). In this work topographic and lateral force images of a HPOG surface were
acquired simultaneously. The surface was imaged with commercial microfabricated Si
3
N
4
cantilevers
under ambient conditions. The corresponding raw data as well as the Fourier filtered images are seen in
Figure 6.9. From the filtered images, the relative displacement of the two images is easily determined: the
lattices corresponding to topographic and lateral force signals are shifted by about one third unit cell.
To explain this phenomenon, the authors argue that the lateral force signal is not necessarily always due
to stick-slip motion and to dissipative phenomena. In fact, the lateral force can be decomposed in a
conservative and a nonconservative component. The latter component is due to energy dissipation and
is proportional to the area enclosed by the lateral force curve (see Figure 6.6 or 6.32). Only this noncon-
servative component can be considered a friction force. The conservative component, on the other hand,
is not related to energy dissipation. For example, if lateral forces act on the tip in noncontact SFM in
such a way that no stick-slip is observed and correspondingly no energy is dissipated, then this lateral
force would be truly conservative.
If stick-slip occurs, then the slip distance is smaller than the interatomic distance, but of this order.
From the data shown in Figure 6.9 the lateral displacement of the tip during slip is calculated to be
0.01 nm and thus much less than the 0.1 nm between maxima and minima in the images shown, which
can be considered a typical slipping distance. From this the authors conclude that the lateral force signal
measured is not simply due to the stick-slip motion of the tip. The authors propose that the signal
observed is due to a conservative interatomic interaction which results in an atomic-scale variation of
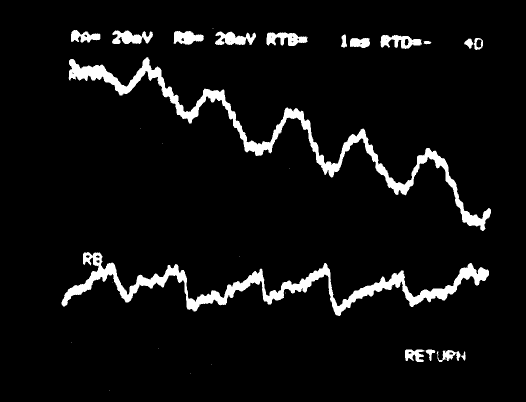
FIGURE 6.8 Oscilloscope traces corresponding to the topography (upper trace) and to the lateral force (lower trace)
taken as the tip scans over a mica surface. Both traces were acquired simultaneously. The corrugation is about 0.2
nm for the topography and 1 nN for friction. (From Marti, O. et al. (1990), Nanotechnology 1, 141–144. With
permission.)
© 1999 by CRC Press LLC
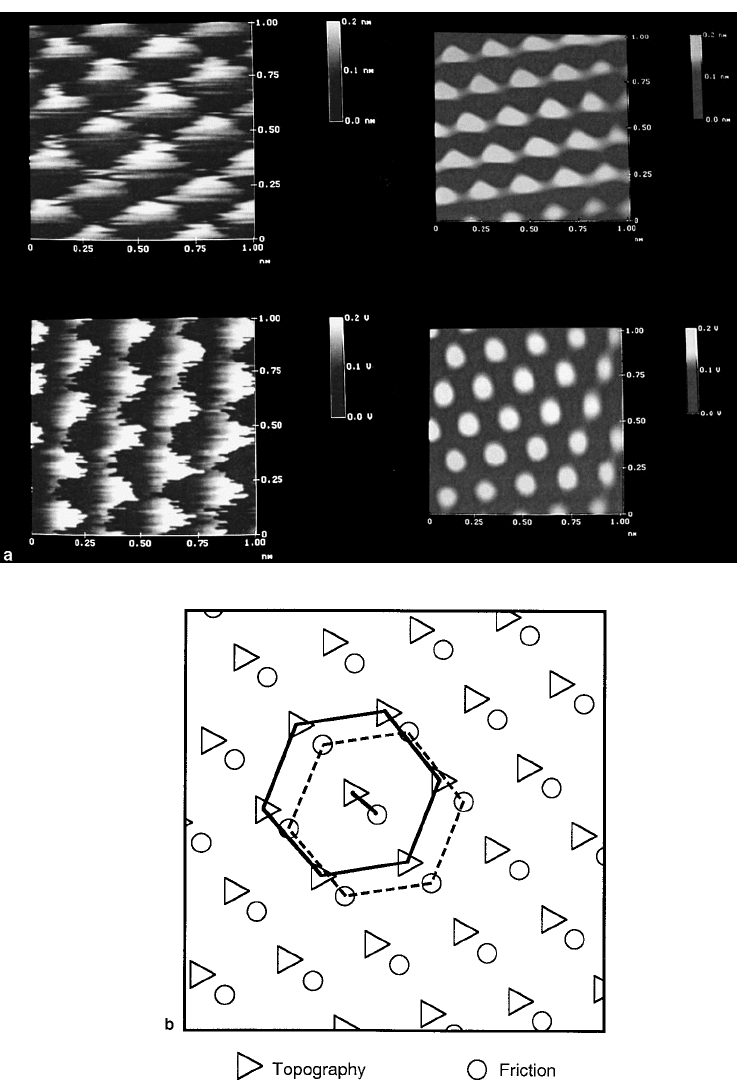
FIGURE 6.9 Set of atomically resolved images taken on HOPG with an Si
3
N
4
cantilever and a microfabricated tip.
The left images are raw data and the right images have been Fourier filtered to show the different positions of the
maxima in the topographic and the friction images. The bottom image shows the relative positions of these maxima,
which are shifted with respect to each other. (From Ruan, J. and Bhushan, B. (1994), J. Appl. Phys. 76, 5022–5035.
With permission.)

© 1999 by CRC Press LLC
the lateral force. By using Fourier expansion of the interaction potential, the normal and lateral forces
between tip and sample are calculated (Ruan and Bhushan, 1994b). For one lateral dimension (x-axis)
the argument elaborated on in this work can be summarized as follows: for a surface potential of type,
which describes, on the one hand, the atomic corrugation of the surface and, on the other, the decrease
of the normal force for increasing tip–sample distance, normal and lateral forces are calculated as
Therefore, minima and maxima of the normal and lateral forces are shifted by one quarter lattice spacing
with respect to each other. In the constant-force mode, topographic image is obtained by adjusting the
position of the sample to maintain a constant force. Hence, minima and maxima of the normal force
and of the topography coincide and are both shifted with respect to the lateral force. This explains
qualitatively the relative phase between the topographic image and the lateral force in the case of purely
conservative forces. For a detailed understanding of the lateral force and its relation to the normal force
and the topography, the exact shape of the interaction potential has to be known and other phenomena
such as the elasticity and deformation of the tip–sample contact (see Section 6.4.3.5) have to be taken
into account.
Two-dimensional images of the mica surface are shown in Figure 6.10. The images correspond to the
topography, the lateral force, and the normal force (from left to right). Essentially all images have the
sixfold symmetry of the hexagonal mica lattice, even though in the topographic image clearly some
directions are more pronounced. The lateral force image shows the typical stick-slip behavior and the
increase in lateral force at the beginning of each line discussed above. It is interesting that an effect due
to the friction force can be observed also in the topographic image. In fact, at the beginning of each line
some atoms seem to be “stretched.” This stretching is about one lattice constant long (0.52 nm). In
principle, two effects can be responsible for this stretching: bending and torsion of the macroscopic
cantilever at the beginning of the lateral force curve — this was discussed above — or the deformation
of the microscopic tip–sample contact (Colchero, 1993). In the case of the images shown, the displacement
of the cantilever was estimated to be only 0.1 nm and is thus too slight to explain the observed effect.
Therefore, the second option seems more probable. We would like to stress that this stretching is not
unique to the images shown but, on the contrary, quite common and is even seen in scanning tunneling
microscopy, where it is also explained by a sticking effect of the tip–sample contact (Albrecht, 1989).
Another interesting feature is seen in the image corresponding to the normal force, which shows rather
sudden peaks with the lattice periodicity. To understand this, we first note that the topographic image
and the normal force image are complementary: if the feedback system does not appropriately correct
the height of the piezo (topographic signal), then the cantilever will be deflected (normal force signal).
Images taken in the constant-height mode show no contrast in the topographic image, in this case all
information is in the normal force image. Images taken in the constant-deflection mode, on the other
hand, should show no contrast in the normal force image, all information being in the topographic
image. Since feedback systems are never ideal, in this second case usually a small amount of structure is
visible also in the normal force image. However, in the case of the normal force image shown in Figure 6.10
the magnitude of the variation as well as its shape cannot be explained only by assuming as low feedback.
This is seen as follows: if a tip scans over a corrugated surface assumed to be approximately harmonic,
then the tip will “see” a harmonic variation of the surface height. Due to the finite bandwidth of the
VxzV kxe
x
kz
z
surf
, cos ,
()
=
()
⋅
−
0
F
V
z
kV kxe
F
V
x
kV kxe
zzx
kz
xxx
kz
z
z
=−
∂
∂
=⋅
()
⋅
=−
∂
∂
=⋅
()
⋅
−
−
surf
surf
0
0
cos ,
sin .
© 1999 by CRC Press LLC
FIGURE 6.10 Two-dimensional images of the mica surface taken in air with an Si
3
N
4
cantilever and a microfabricated tip. Atomic resolution of the lattice
periodicity on mica is seen in all three images. The upper images represent raw data (in the case of the topographic image a plane has been substracted) and
the lower images have been Fourier filtered to enhance the atomic periodicity. The left images correspond to the topography, the center ones to the lateral
force, and the right ones to the normal force. The scan range is about 5 nm.
© 1999 by CRC Press LLC
feedback loop, the topographic and the normal force signal correspond to low-pass and high-pass
filteredimages of the real surface. Therefore, both images should again be harmonic. Their amplitudes
and their respective phase will depend on the time constant of the feedback system. The topographic
and the normal force images shown, however, have a different structure. While the topographic image
is indeed rather smooth — which can be explained by filtering due to the feedback system — the normal
force image shows sudden peaks. These peaks are explained by an effect of the stick-slip motion. In fact,
if we assume that the tip sticks to some point on the surface until the lateral force exceeds some critical
value, whereupon the system becomes unstable and jumps to a new position, then it seems reasonable
that the normal force varies as the tip jumps into the new equilibrium position. This has important
consequences for the correct interpretation of images: if stick-slip occurs, the tip jumps over part of the
unit cell which accordingly is not imaged. Moreover, since the lattice spacing of the unit cell is reproduced
in the images, this further implies that the part of the unit cell which is imaged is stretched. A more
elaborate explanation for these sudden jumps has been proposed by Fujisawa et al. (1993) and will be
discussed in the next section. However, this different explanation does not modify the main message:
when stick-slip is observed, which is equivalent to a nonzero friction force and thus to energy dissipation,
then only a fraction of the unit cell is imaged, since the tip rapidly jumps over the other part of the unit
cell (Colchero, 1993). A more detailed description of this process will be presented in Section 6.4.3.3.
At this point again the question can be raised whether or not in the present case atomic resolution is
possible taking into account the finite contact radius. Taking again Equation 6.16 and assuming an Si
3
N
4
tip of about 30 nm radius, we estimate a contact radius of 2.5 nm, which is roughly the size of the image
shown and therefore again much larger than the periodicity resolved. Therefore, in this context, the high
resolution still has to be explained. Moreover, the above considerations regarding imaging within the
unit cell, although in principle important, are rather academic at the present point.
6.3.1.2 Two-Dimensional Stick-Slip
In the preceding discussion the frictional force was assumed to act only in the direction of the (fast)
scan. This is analogous to macroscopic friction, where the friction force is parallel to the relative velocity
of the sliding bodies. According to the simple model discussed above, the tip sticks to potential minima
on the surface until the lateral force built up due to the scanning motion of the tip exceeds the force
needed to shear the tip–sample junction. The potential minima were assumed to lie along the scanning
direction. A surface is, however, a two-dimensional structure and accordingly the potential minima do
not have to lie necessarily on the line defined by the scan, that is, the line which the tip would follow if
no friction forces act on the tip. We will call this line the scan line. Depending on the symmetry of the
surface, the minima of the surface potential can be arranged in a very complex way. The tip, on the other
hand, can be deflected in principle in any direction, as was discussed in detail in Section 6.2.1.1. Therefore,
if the tip is scanned along an arbitrary line over a surface, the tip will not only stick to points exactly on
the scan line — in fact, for most scan lines there might not be any sticking points exactly on the scan
line — but will “look” for the most favorable sticking points off the scan line. Since the tip is then deflected
from the scan line, this induces lateral forces which are perpendicular to the direction of motion of the
tip and thus to the usual friction force. Therefore, for a real two-dimensional surface and a real SFFM
setup the tip motion is expected to be much more complex than the one-dimensional stick-slip motion
described usually. This two-dimensional stick-slip motion has been studied by Fujisawa et al. (1993) in
detail and published in a long series of papers (for a review, see Morita et al., 1996).
The first question that arises in this context is how to detect this two-dimensional motion. With the
optical beam deflection method it is possible to detect simultaneously bending and torsion of a cantilever.
A lateral force causes a torsion of the cantilever if this force acts along the x-axis (see Figure 6.1 for the
convention used) and a bending if this force is along the y-axis (see Section 6.2.1.1). In the latter case,
the friction force can be separated from the normal force by taking the difference of the back and the
forward scan. Finally, we recall that in the case of typical rectangular cantilevers the force constants for
displacements along the x-axis and the y-axis are of similar magnitude, namely,
© 1999 by CRC Press LLC
where c is the force constant for bending due to a normal force (see Equations 6.3, 6.5, and 6.8) and the
convention is used that the long axis of the cantilever is along the y-direction. Therefore, with the optical
beam deflection method and with appropriate cantilevers it is possible to detect simultaneously lateral
forces in both directions parallel to the sample (see Section 6.2.1.1).
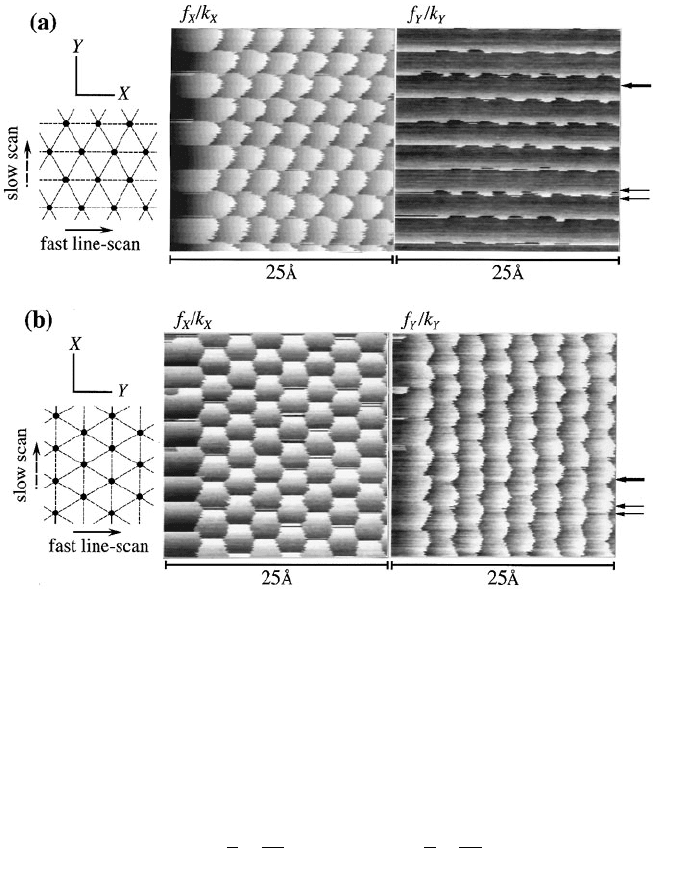
Figure 6.11 illustrates the two-dimensional stick-slip behavior for an Si
3
N
4
tip on an MoS
2
surface,
which is a layered material with a lattice periodicity of 0.274 nm. The upper images (Figure 6.11a)
correspond to the usual setup in SFFM where the fast scan is along the x-axis. The left image shows the
torsion of the cantilever — this is the image which is usually acquired as the friction image — and the
right image the bending of the cantilever. The lower images (Figure 6.11b) were taken with the fast scan
along the y-direction. Again, the left image shows the torsion and the right image the bending of the
cantilever. The fast scan in all images is from left to right. The first and the last images are easily
understood: they reflect the typical one-dimensional stick-slip behavior. While the first image is measured
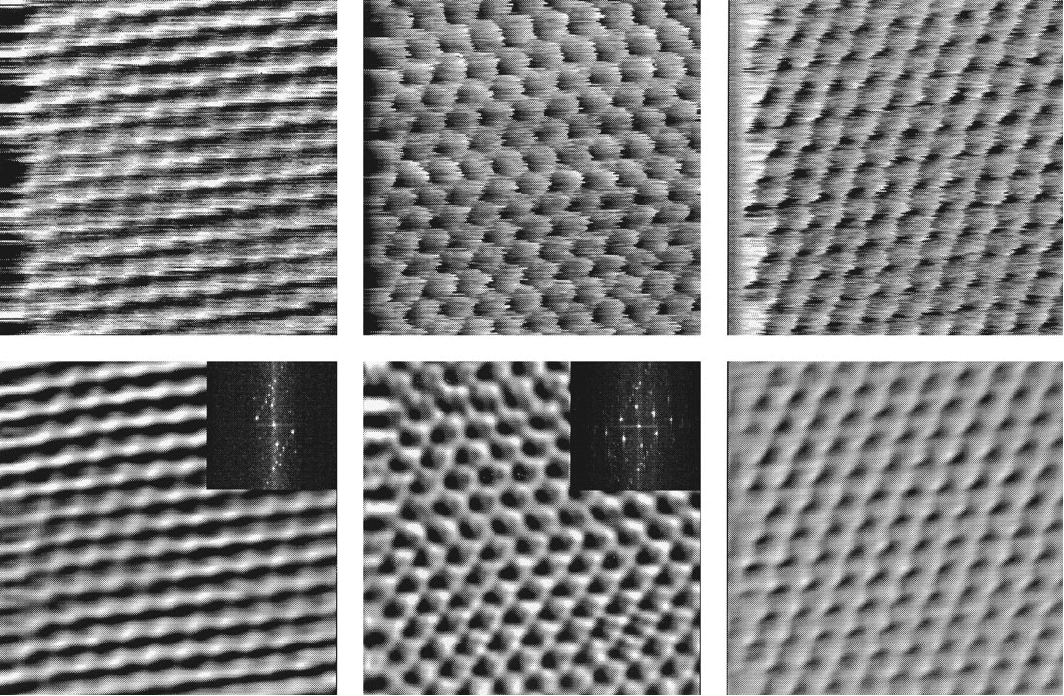
FIGURE 6.11 Images illustrating the two-dimensional stick-slip behavior taken with an Si
4
N
3
tip on an MoS
2
surface.
The images labeled f
x
/k
x
correspond to a twisting of the cantilever and the images labeled f
y
/k
y
to a bending. For the
upper images (a), the fast scan is perpendicular to the cantilever (this is the usual imaging mode), and for the lower
ones (b) the fast scan is parallel to the cantilever (y-axis). The cantilever is aligned along the y-direction (see Figure 6.1
for the convention used). The thick arrows mark the positions of the sections corresponding to the lateral force curve
shown in Figure 6.14, and the thin arrows to lines from which the sections shown in Figure 6.12 were obtained.
(From Morita, S. et al. (1996), Surf. Sci. Rep. 23, 1–41. With permission.)
c
l
l
cc
l
l
c
xy
tors
tip tip
and
1
2
1
3
22
⋅
⋅=⋅
⋅ ,
© 1999 by CRC Press LLC
in the usual torsion mode, the last image is measured by scanning along the cantilever. The other two
images cannot be explained within the one-dimensional stick-slip behavior. In particular, note the square-
wave shape of the third image.
To understand the two-dimensional stick-slip motion in detail, one should remember that the surface
can be described by a two-dimensional potential with a symmetrical arrangement of minima and maxima.
If no external forces act on an ideally sharp tip, then the last tip atom will move to the energetically most
favorable position which is a minimum of the tip–sample potential and the whole tip will correspondingly
be caught in this minimum. To move the tip from this minimum, a shearing force is needed. We consider
first two special cases in which the tip is scanned parallel to the symmetry axes of the crystal which
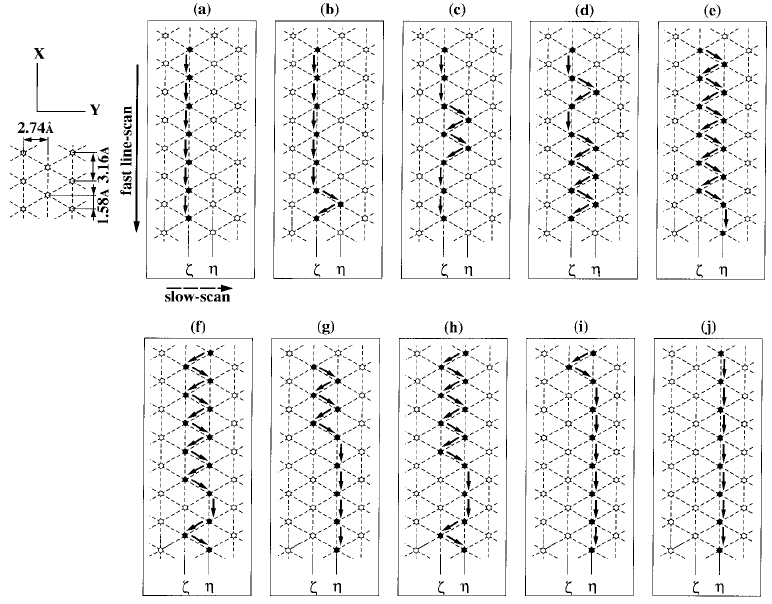
contains the potential minima (see Figure 6.13). In the first case, the tip is moved on a line going through
these minima (for example, the lines ζ or η in Figure 6.13), and thus in an energy “valley.” The tip will
then stick in the nearest minimum until the shearing force built up during the scanning motion is high
enough so that the tip jumps into the next minimum along the scan line. Since the tip is caught in an
energy valley, only forces parallel to the scan line are measured and the stick-slip behavior is that of one-
dimensional stick-slip. Such a scan line is marked with a thick arrow in Figure 6.11a. The measured
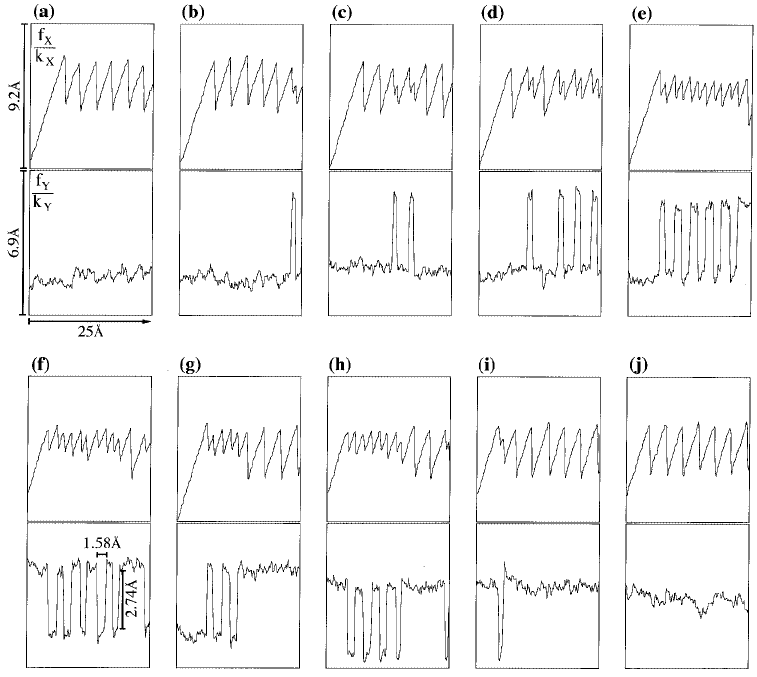
deflection of the cantilever corresponding to such a line scan is shown in Figure 6.12a and j, as well as
FIGURE 6.12 Signals corresponding to the line scans between the two thin arrows in Figure 6.11a. The signals
labeled f
x
/k
x
correspond to the twisting of the cantilever and the signals labeled f
y
/k
y
to its bending. Curves (a) and
(j) can be considered to show the “classical” one-dimensional stick-slip behavior: the cantilever is only twisted as the
tip is scanned perpendicular to the cantilever (x-axis) in an energy valley. (From Morita, S. et al. (1996), Surf. Sci.
Rep. 23, 1–41. With permission.)
© 1999 by CRC Press LLC
in Figure 6.14a. Now let us consider a second case, where the tip is assumed to move between the lines
containing the potential minima (for example, a scan line halfway between the positions ζ and η in
Figure 6.13). The tip can then be considered to move over the maxima of the surface potential and the
minima lie on both sides of the scan line. If the cantilever is soft enough in the direction perpendicular
to the scan line, the tip will move to the nearest minimum off the scan line which induces a force
perpendicular to the scan direction. As the tip is scanned but still sticks to this point, a lateral force is
built up oriented along the scan direction (x-axis). This force increases linearly with the scanned distance,
while the lateral force perpendicular to scan line remains constant. When the (total) lateral force built
up during the scanning motion is high enough, the tip snaps into the nearest minimum, which now is
on the other side of the scan line. This behavior leads to a lateral force signal which is triangular-shaped
in the case of the component along the scan line and rectangular-shaped in the case of the component
perpendicular to this line (see Figure 6.12e and f). The intermediate cases where the tip is scanned neither
through the potential minima nor through the potential maxima are a combination of the two cases
discussed. Figure 6.12a to j shows the signals corresponding to scan lines between the thin arrows in
Figure 6.11a, and Figure 6.13a to j the motion of the tip reconstructed from these signals. Interestingly,
a region exists around the lines containing the potential minima where the tip is caught in the valleys
containing the potential minima, so that no jumps perpendicular to the scan line are observed. This is
seen in Figure 6.11, for example, around the position marked with the thick arrow (and also the corre-
sponding signals in Figure 6.14).
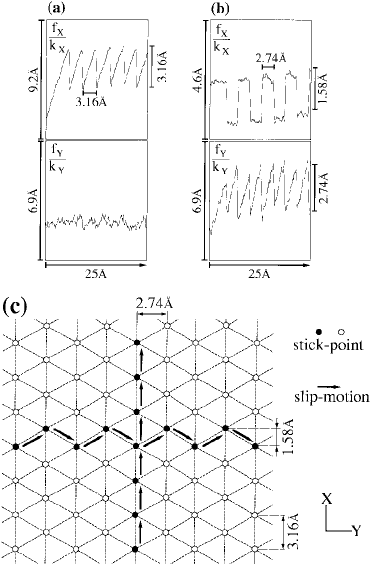
The cases described above assumed scanning parallel to the symmetry axis of the surface containing
the stick points. If the scan is perpendicular to this direction, essentially the same behavior is observed.
However, then the trivial case — scanning through the stick points — does not occur; therefore a
FIGURE 6.13 Two-dimensional stick-slip motion of the tip reconstructed from the signals shown in Figure 6.12.
(From Morita, S. et al. (1996), Surf. Sci. Rep. 23, 1–41. With permission.)
© 1999 by CRC Press LLC
rectangular-shaped signal is always observed in the direction perpendicular to the scan line. This is seen
in Figure 6.14, which shows the signals for two different orthogonal scan lines and the corresponding
paths reconstructed from the measured motion of the tip.
In the images shown, the axes of the crystal, of the motion of the tip, and of the cantilever were aligned
with respect to each other. More specifically, the x-axis of the cantilever was parallel to the symmetry
axis of the surface containing the stick points and this axis in turn defined one of the two perpendicular
fast-scan directions. If the scan is not aligned with respect to the crystal axis, the two-dimensional stick-
slip is even more complex than described above (Figure 6.15). In this case, the square wave signal
corresponding to the jumping of the tip between points on both sides of the central scan line is not flat
as in the images before, but has a slope. This is seen as follows: let us assume that the tip sticks to some
point and that the sticking points are a long the x-axis. If the tip is now moved along a scan line which
is not parallel to the x-axis of the cantilever, then the tip will be moved away from the sticking point not
only in the x-direction, but also in the y-direction. This will induce lateral force components F
x
and F
y
which increase linearly with the scanned distance until the total lateral force built up during the scanning
motion is high enough to induce a slip into the next sticking point. Moreover, the values of the lateral
force corresponding to the stick-slip points are not all equal as in the previous case. However, they can
be calculated from the exact geometry of the experimental setup (Gyalog et al., 1995; Morita et al., 1996).
In conclusion, although the general two-dimensional stick-slip behavior can be very complex, it can
be understood within a simple model of the surface assuming that the potential minima of the two-
dimensional surface potential correspond to sticking points to which the tip adheres. It is evident that
FIGURE 6.14 (a) and (b) Friction signals measured in the two acquisition channels corresponding to twisting of
the cantilever (f
x
/k
x
) and to bending of the cantilever (f
y
/k
y
) shown for two different orthogonal scan lines. (c) Motion
of the tip reconstructed from the measured deflection of the cantilever. The signals shown correspond to the scan
lines at the positions marked by the thick arrows in Figure 6.11a and b. (From Morita, S. et al. (1996), Surf. Sci. Rep.
23, 1–41. With permission.)