Bowker M., Davies P.R. (Eds.) Scanning Tunneling Microscopy in Surface Science, Nanoscience and Catalysis
Подождите немного. Документ загружается.

On the Pd(1 1 1) surface, Wintterlin and coworkers [59] have shown that CO
oxidation goes through a different reaction pathway at low temperatures. Similar
titration experiments were performed by exposing the Pd(1 1 1) surface precovered
by (2 2)-O overlayer to 2 10
8
Torr CO at 143 K (Figure 3.14). Using STM to
follow the same area of the Pd(1 1 1) surface, these authors found that CO does not
react with surface oxygen at this temperature. Instead, CO molecules slowly occupy
the surface sites of Pd(1 1 1) and compresses the (2 2) oxygen domains into the
(2 1)-O phase. This phase was imaged with a stripe pattern and exhibited an
oxygen density twice that of the (2 2)-O structure. The reaction kinetics of CO
titration was then measured on these (2 1)-O islands between 144 and 185 K. The
(2 1)-O phase shows a superior reactivity over the (2 2)-O phase that does not
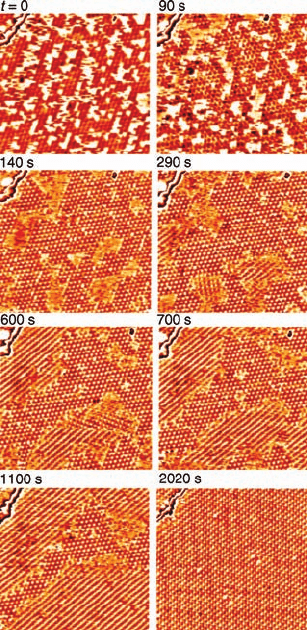
Figure 3.12 Series of STM images, recorded
during reaction of adsorbed oxygen atoms
with coadsorbed CO molecules at 247 K, all
from the same area of a Pt(1 1 1) crystal.
Before the experiment, a submonolayer of
oxygen atoms was prepared and CO was
continuously supplied from the gas phase
(P
CO
¼5 10
8
mbar). The times refer to the
start of the CO exposure. The structure at the
upper left corner is an atomic step of the Pt
surface. Image sizes, 180 Å 170 Å; V
t
¼0.5 V;
I
t
¼0.8 nA. (Reprinted with permission from
Ref. [58]. Copyright 1997, The American
Association for the Advancement of Science.)
74
j
3 In Situ STM Studies of Model Catalysts
react with CO up to 180 K. More interestingly, the removal of oxygen islands
accelerated when the surface coverage of (2 1)-O islands decreased to below
0.3 ML (Figure 3.15a). Below 0.3 ML, unlike the previous study on the Pt(1 1 1)
surface, the titration reaction rate with the (2 1)-O islands on Pd(1 1 1) shows a
linear relation with the surface area of oxygen, instead of the perimeter of oxygen
islands, as shown in Figure 3.15b and c. The authors speculated that a transient
occupation of CO on the oxygen island causes all O atoms to be accessible for the
reaction. There was no direct evidence for the existence of this kind of mixed O/CO
phase based on the STM images or other spectroscopic studies. Nonetheless, this
study unambiguously illustrated the superior reactivity of compressed oxygen
islands, especially when they become very small.
The adsorption of oxygen atoms often induces the reconstruction of metal surfaces
as is the case of (1 1 0) surfaces of fcc metals. It is expected that CO titration on such
surfaces would also involve the local transformation of metal substrates. Indeed,
accompanying the oxygen-induced reconstruction, the mobility of surface oxygen is
considerably reduced so that they can be resolved by STM at room temperature. For
this reason, the CO titration experiments using STM were initiated on (1 1 0) surfaces
of fcc metals in the early 1990s. CO oxidation was first visualized on a Rh(1 1 0)
surface by Leibsle et al. [60] where a pronounced reaction anisotropy was observed.
The experiments were carried out by titrating the oxygen precovered Rh(1 1 0)
surface with CO. Chemisorption of oxygen on Rh(1 1 0) forms several reconstructed
phases, which, in turn, were imaged as striped patterns along the ½1
10direction.
By monitoring the surface changes during CO exposure, STM images revealed
that oxygen was removed on the elongated stripes of the added rows in the
½1
10direction. Later, similar one-dimensional reactivity was also found on other
fcc(1 1 0) systems, such as Cu [61–63], Ni [64], and Ag [65, 66].
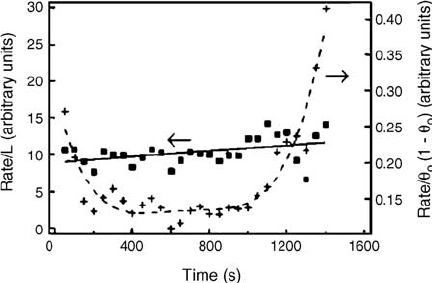
Figure 3.13 Reaction rates, determined from
the change in the size of the (2 2) area
between successive panels of the data of
Figure 3.12, normalized to (squares) the
length of the boundary between oxygen and
CO domains (the full line is a linear fit) and
(crosses) divided by q
O
(1 q
O
), which is equal
to q
O
q
CO
if q ¼1 implies maximum coverage
of the respective phase (the broken line is only
to guide the eye). (Reprinted with permission
from Ref. [58]. Copyright 1997, The American
Association for the Advancement of Science.)
3.3 Visualizing the Pathway of Catalytic Reactions
j
75
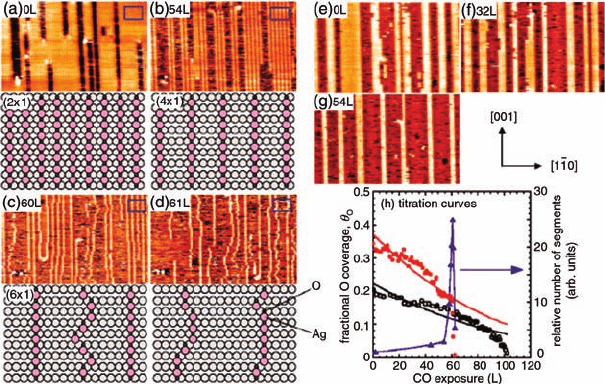
While most in situ studies on the one-dimensional reactivity of fcc(1 1 0) metals
remain qualitative, recent studies on the reactivity of oxygen-induced added rows of
Ag(1 1 0) have provided quantitative measurement of one-dimensional reactivity.
Nakagoe et al. [65, 66] conducted CO titration experiments on the added row-
reconstructed Ag(1 1 0)(n 1)-O surfaces, where one-dimensional AgO chains
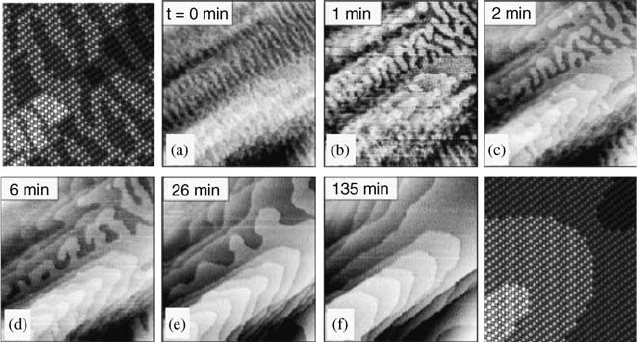
arrange periodically along the [0 0 1] direction. Figure 3.16 shows two series of in situ
STM images, where Ag(1 1 0)(2 1)-O surfaces were exposed to 1 10
8
Torr CO at
room temperature. As a function of time, Figure 3.16a–g depicts the continuous
segmentation of AgO chains on the clean or carbon-containing Ag(1 1 0)(2 1)-O
surfaces. Figure3.16h plots the remaining coverage of surface oxygen as a function of
CO exposure. Clearly, the reaction rate accompanying the segmentation of AgO
chains is significantly accelerated. The authors have gone further to study the
structure fluctuation at various temperatures. Below 230 K, the AgO chains were
found to be straight while the removal of AgO chains only occurs at the end of the
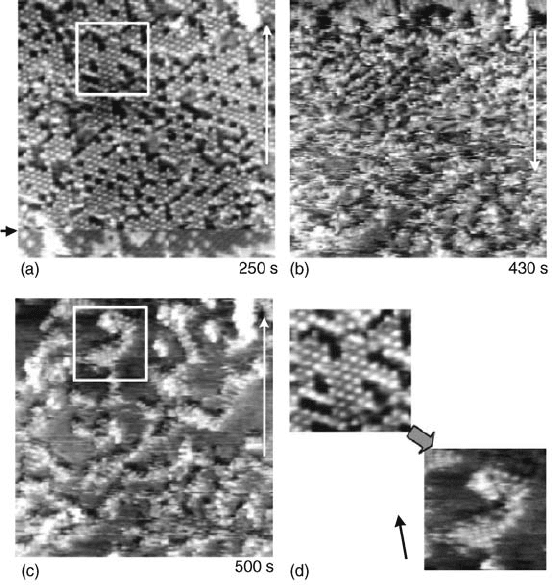
Figure 3.14 Series of STM images recorded
during CO dosing on the (2 2)-O-covered
Pd(111)surface.T ¼143 K,P
CO
¼2 10
8
Torr,
all images are from the same area. Indicated
is the time elapsed since the start of the CO
dosing. V
t
¼0.3 V, I
t
¼2.2 nA, 240Å 240 Å.
The two close-ups in (d) show details from the
marked areas in frames (a) and (c). (Reprinted
with permission from Ref. [59]. Copyright 2005,
The American Physical Society.)
76
j
3 In Situ STM Studies of Model Catalysts
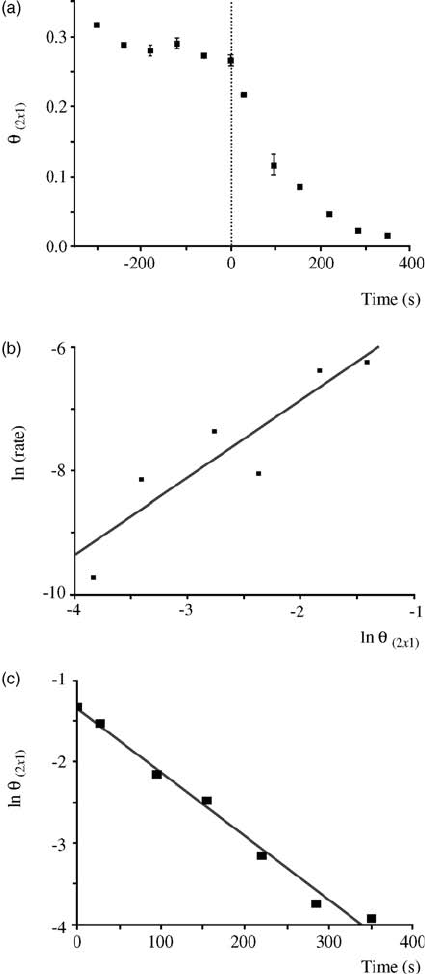
Figure 3.15 (a) Time evolution of the (2 1)-O coverage;
(b) plot of ln[dq
(21)
/dt] versus ln q
(21)
for the data from (a) for
t 0; (c) plot of ln q
(21)
versus t for the data from (a) for t 0.
(Reprinted with permission from Ref. [59]. Copyright 2005,
The American Physical Society.)
3.3 Visualizing the Pathway of Catalytic Reactions
j
77
chains and exhibits zero-order kinetics to CO exposure. The Arrhenius plot gives an
activation barrier of 41 kJ mol
1
and a prefactor of 1.7 10
3
cm
2
s
1
. The results
below 230 K agree with the previous study by Wintterlin et al. on Pt(1 1 1), where the
reaction takes place at the periphery of oxygen domains. On the contrary, at room
temperature, the reaction rate is drastically accelerated as the AgO chains become
segmented and the shape of the AgO chains begins to fluctuate. It is clear there is a
direct correlation between the surface structure and the reaction kinetics, although
such correlation cannot be quantitatively described by the first- or second-order
kinetic models.
The nonlinear kinetics of CO titration on oxygen precovered surface has been
found to take place not only on the oxygen-reconstructed one-dimensional wires
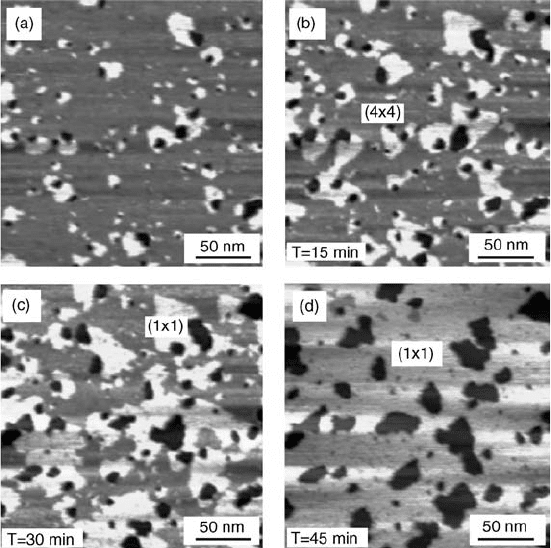
but also on the two-dimensional surface oxides. Klust and Madix [67] have recently
studied the reduction of the Ag(1 1 1)-p(4 4)-O surface by CO titration. The Ag
(1 1 1)-p(4 4)-O surface was prepared by exposing Ag(1 1 1) to NO
2
at 500 K. The
reduction of this surface was monitored at room temperature by STM in the presence
of 10
8
mbar CO (Figure 3.17). With time, the surface areas covered by p(4 4)-O
continue to shrink while the bright (1 1) islands continue to grow on top of the p
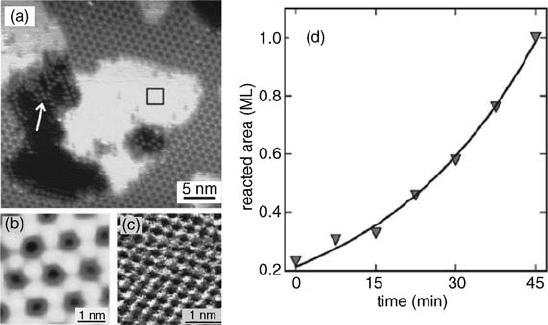
(4 4)-O overlayer. Figure 3.18a–c illustrates the atomic structures of p(4 4)-O
phase, the oxygen-free (1 1) Ag islands, and the remnant dots of Ag surface oxide.
The authors found that the reaction rate does not correlate with the perimeter of the
Figure 3.16 Two series of STM images of
37 nm 27 nm continuously taken at RT under
a nominal CO pressure of 1 10
8
Torr for
clean (a–d) and C-containing (e–g) Ag(1 1 0)
(2 1)-O surfaces (I
t
¼0.2 nA, V
tip
¼1.4 V).
Schematic models of the regions are also shown
for (a–d). (h) Titration curves obtained for both
clean (red solid circles) and C-containing
(empty circles) Ag(1 1 0)(2 1)-O surfaces.
Thick red and black curves are the least square
fits obtained by assuming second-order
kinetics. The relative number of segments for
the clean surface is also plotted (blue triangles
and curve). (Reprinted with permission from
Ref. [65]. Copyright 2003, The American Physical
Society.)
78
j
3 In Situ STM Studies of Model Catalysts
boundary layers but increases more rapidly with CO exposure (Figure 3.18d). The
nonlinear increase in the reaction rate approximately scales with the reacted area and
led the authors to speculate that CO reacts with undercoordinated oxygen atoms,
either at the boundary between the Ag surface and the p(4 4)-O phase or with
oxygen atoms released onto the Ag surface. Due to the invisibility of such species,
speculation of this kind is difficult to verify.
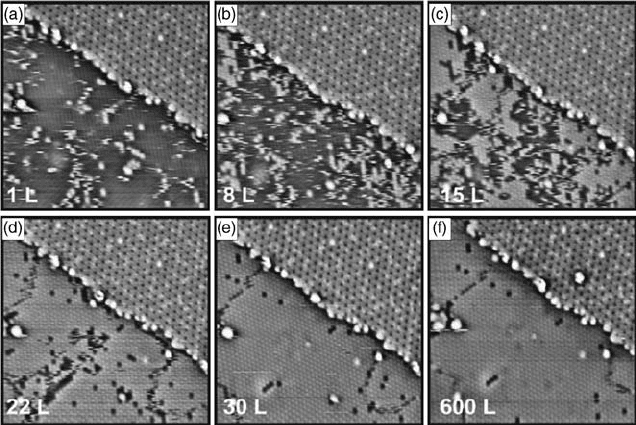
In situ CO titration experiments have also been conducted on multicomposition
systems, that is, inverse model catalyst. Schoiswohl et al. [68] in their studies
compared the CO titration reaction on three surfaces: clean Rh(1 1 1) surface, Rh
(1 1 1) surface covered with large 2D V
3
O
9
islands (mean size >50 nm), and Rh(1 1 1)
surface coveredwith small 2D V
3
O
9
islands (meansize <15 nm). Prior to CO titration,
the three surfaces were exposed to 10
7
mbar O
2
to form a (2 1)-O phase at room
temperature. In situ STM was used to follow the titration reaction in the presence of
10
8
–10
7
mbar CO. CO titration on the clean Rh(1 1 1) surface or the Rh(1 1 1)
surface with large V
3
O
9
islands exhibits similar reaction kinetics. Figure 3.19 shows
Figure 3.17 Evolution of the Ag(1 1 1)-p(4 4)-
O surface during exposure to CO at room
temperature. The images show the same
surface area exposed to increasing amounts of
CO during imaging. (a) Shows the surface
before CO exposure and (b), (c), and (d) at 15,
30, and 45 min after exposure start, respectively.
Image (d) shows the finalstate of the surface, no
changes were observed after 45 min exposure to
CO. (Reprinted with permission from Ref. [67].
Copyright 2007, The American Institute of
Physics.)
3.3 Visualizing the Pathway of Catalytic Reactions
j
79
the adsorption of CO on the Rh(1 1 1)-(2 1)-O surface occupies the on-top sites and
reacts with half of the oxygen in the (2 1)-O phase, leading to the formation of a
coadsorbed (2 2) O þ CO phase. The islands of (2 2) O þ CO phase grow at the
expense of the (2 1)-O layer upon CO exposure. The titration reaction stops at
approximately 30 L of CO and removes half of the surface oxygen atoms. Further
removal of the adsorbed oxygen is kinetically inhibited on these two surfaces at room
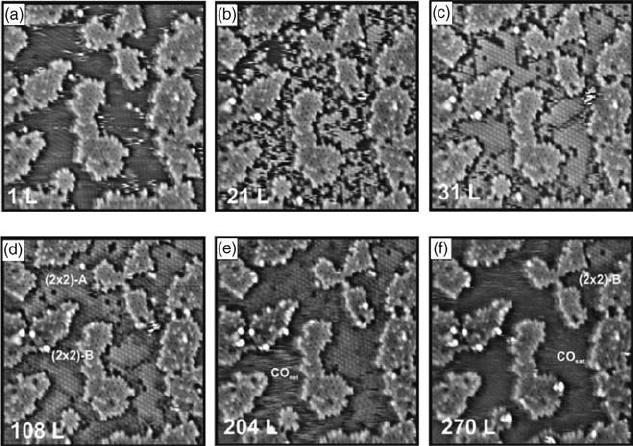
temperature. In contrast, CO titration reaction on the Rh(1 1 1) surface covered with
small V
3
O
9
islands is significantly accelerated and could proceed further to remove all
chemisorbed oxygen atoms on the Rh(1 1 1) surface (Figure 3.20). The fuzzy edges of
the V
3
O
9
islands in Figure 3.20 suggest participation of the periphery of small V
3
O
9
islands in CO oxidation via promotion of the CO oxidation reaction at the metal-oxide
phase boundary.
In summary, in situ STM studies of CO titration on the oxygen precovered metal
surfaces have demonstrated atomic details of CO oxidation on metal surfaces and
have shown excellent agreement with macroscopic kinetic measurements. Moreover,
in situ studies have revealed an interesting but not well-understood, nonlinear
behavior of reaction kinetics. The accelerated reaction rate observed takes place
only when surface oxygen islands, either compressed oxygen islands or surface oxide
islands, are reduced to the nanometer size. The nonlinear reactivity of these
nanoislands is in stark contrast with the large adsorbate layer and requires further
investigations.
Figure 3.18 (a) Ag(1 1 1) islands and pits
surrounded by the Ag(1 1 1)-p(4 4)-O
structure. The white arrow points to the
remnants of the surface oxide that are occasion-
ally observed in the pits. The atomically resolved
STM images show (b) the Ag(1 1 1)-p(4 4)-O
surface and (c) a small area of the (1 1)
structure obtained on the island shown in (a)
that appeared during CO oxidation. The black
square on the island shown in (a) marks
the approximate scan area of image (c).
(d) Development of the reacted surface area
during the titration reaction. The curve shows
an exponential function fitted to the data.
(Reprinted with permission from Ref. [67].
Copyright 2007, The American Institute of
Physics.)
80
j
3 In Situ STM Studies of Model Catalysts
3.4
Metal Surfaces at High Pressures
The above studies show that the chemisorptions on metals could often alter the
composition and structure of metal surfaces. To bridge the pressure gap, in situ STM
has played a critical role in observing the dynamic behavior of catalytic surfaces from
UHV to atmospheric pressures.
The pioneering high-pressure STM study by McIntyre et al. [69] shows the Pt(1 1 0)
surface restructures in single-component gases of H
2
,O
2
, and CO at atmospheric
pressures and at 425 K. Hendriksen et al. [22, 23] took one step further to view this
surface using a flow-reactor STM under high-pressure CO or a CO/O
2
mixture. The
surfaceof Pt(11 0) exhibitsa(1 2)missing-rowreconstructionin UHV. The exposure
of CO liftsthisreconstruction even atlow pressures. Inthe presenceof 1 bar CO, in situ
STM shows the exposure of high-pressure CO not only lifts the (1 2) reconstruction
to a bulk-like (1 1) phase but also causes the coarsening of Pt(1 1 0) surface.
Figure 3.21 shows sequences of snapshots on the Pt(1 1 0) surface in 1.25 bar CO
at 425 K. The local rearrangement caused by the transition from the (1 2) to (1 1)
phase upon CO exposure leads to the fragmentation of Pt(1 1 0) terraces and a high
Figure 3.19 Series of STM images (25 nm 25 nm, V
t
¼1.5 V,
I
t
¼0.1 nA) recorded during dosing CO on the (2 1)O-Rh(1 1 1)
surface covered with large (mean size of 50 nm) V
3
O
9
islands:
(a) 1 L; (b) 8 L; (c) 15 L; (d) 22 L; (e) 30 L; (f) 600 L. A fraction of a
large V
3
O
9
island is seen in the upper right-hand side of the image.
(Reprinted with permission from Ref. [68]. Copyright 2005,
Elsevier.)
3.4 Metal Surfaces at High Pressures
j
81
density of surface steps(Figure 3.21a).Toreducethetotalsurface energy, coarseningof
the surface steps takes place (Figure 3.21b–f) whereas a much slower (1 1) phase
transition occurs upon CO exposure. With time the curved Pt islands are smoothed,
forming rounded large islands covered by CO on the Pt(1 1 0) surface.
The CO-covered Pt(1 1 0) surface was then exposed to a mixture of CO/O
2
gases,
with the ratio of CO/O
2
adjusted by flow meters. The pressure changes of CO, O
2
, and
the reaction product, CO
2
, were monitored by leaking the gases from the flow reactor
to a quadrupole mass spectrometer (QMS) attached to the flow-reactor STM. The
surface structure and reactivity of Pt(1 1 0) could be measured simultaneously with
the combination of STM and QMS.
Figure 3.22 plots the real-time pressure of CO, O
2
, and CO
2
, as well as the
corresponding snapshots of in situ STM images on Pt(1 1 0). The production of CO
2
starts right away with the presence of both CO and O
2
in the reactor. As the reaction
proceeds, two stages of reaction rates exist, as evidenced by the step increase in CO
2
pressure in Figure 3.22. At the stage of low reaction rate (see B, F, and H in
Figure 3.22), the corresponding STM images show no apparent change in the surface
structure, indicating the Pt(1 1 0) surface remains metallic. At the stage of high
reaction rate (see D and G in Figure 3.22, about three times higher than the
low reaction rate), the corresponding STM images suggest a roughened surface,
Figure 3.20 Series of STM images
(25 nm 25 nm, V
t
¼1.5 V, I
t
¼0.1 nA)
recorded during dosing CO on the (2 1)O-Rh
(1 1 1) surface covered with small (mean size of
15 nm) V
3
O
9
islands: (a) 1 L; (b) 21 L; (c) 31 L;
(d) 108 L; (e) 204 L; and (f) 270 L. Several small
irregular shaped V
3
O
9
islands phase are visible.
The areas labeled (2 2)-A, (2 2)-B, and CO
sat
correspond to the (2 2)-O þ CO, (2 2)-CO,
and CO saturation layer phases, respectively.
(Reprinted with permission from Ref. [68].
Copyright 2005, Elsevier.)
82
j
3 In Situ STM Studies of Model Catalysts
indicating the formation of surface Pt oxide. At the point of the step increase in
reaction rate (Figure 3.22C), the STM image suggests a modest and uniform increase
in surface roughness, which the authors assigned as a commensurate Pt oxide film.
Subsequent high-pressure surface X-ray diffraction (SXRD) studies by the same
group [70] verified the formation of this commensurate oxide film, which was
assumed to be responsible for the increased reaction rate. Further SXRD results
suggest that the thickness of this oxide film is one monolayer with a (1 2)
periodicity. It is worth noting that roughening of the oxide surface was observed
only during the CO oxidation reaction but not in 1 bar pure O
2
.
Combined with their kinetic measurements, the authors proposed CO from the
gas phase could directly react with oxygen atoms in the surface oxides, accounting for
relatively high reactivity of this phase for CO oxidation. This mechanism, termed as
Mars-Van Krevelen mechanism, challenges the general concept that CO oxidation
on Pt group metals is dominated by the Langmuir–Hinshelwood mechanism, which
proceeds via (1) the adsorption of CO and the dissociative adsorption of O
2
and
(2) surface diffusion of CO
ad
and O
ad
atoms to ultimately form CO
2
.
The authors further tested the Pt(1 1 1) and Pd(1 1 0) surfaces [71, 72] using in situ
STM and SXRD. All these single crystals show a similar kinetic behavior in CO
oxidation. The gradual roughening of the surface corresponds to the formation of
surface oxides and a higher CO oxidation rate. The structure insensitivity observed at
high pressure is in contrast with the results obtained in UHV, where the reactivity
shows a strong orientational dependence.
Figure 3.21 Series of STM snapshots
(140 nm 140 nm) taken on Pt(1 1 0), starting
immediately after introduction of 1.25 bar CO
in the reactor-STM at 425 K. The tiger skin
pattern in the first panel shows that the (1 2)
to (1 1) transition has divided the surface in
two levels, each 50%, and a high density of
steps. Subsequent images show the progressive
reduction of the step density by coarsening of
the step pattern. The elapsed time in minutes
is indicated in each panel. The two ball
models indicate the atomic-scale geometries
characteristic for the starting and end
situations. (Reprinted with permission from
Ref. [22]. Copyright 2005, Springer.)
3.4 Metal Surfaces at High Pressures
j
83