Carranza E. Geochemical anomaly and mineral prospectivity mapping in GIS
Подождите немного. Документ загружается.

Spatial Data Models, Management and Operations 47
unique conditions map assigns a unique attribute (e.g., geo-object class or ID) to
polygons with unique combinations of attributes of the input maps. This type of intersect
operation is common in raster-based GIS software packages. The number of unique
conditions is usually less than but could be equal to the number of unique polygons. For
example, in Fig. 2-17 there are eight pairs of unique polygons and each pair has unique
combinations of attributes of the input maps. Thus, the attribute table associated with the
unique conditions map has four records less than the attribute table associated with the
unique polygons map. The reduced number of classes in a unique conditions map
compared to a unique polygons map, or the reduced number of records in the attribute
table associated with the former map compared to the latter map, is favourable in
speeding up modeling computations. This is a reason why the intersect operation that
results in a unique conditions map is usually preferred over the intersect operation that
results in a unique polygons map.
Of the different overlay operations, the intersect operation is widely used in the
analysis of at least two maps in order to obtain spatial information of interest. The
objective of overlay operations in the analysis of either a pair of maps or multiple maps
could be either (a) to combine maps according to certain conditions or rules or (b) to
examine spatial relationships between two different geological features. The conditions
or rules applied in combining a pair of maps represent a conceptual model of theoretical
relationships between factors of or controls on how and where certain geochemical
anomalies and mineral deposit-types occur (see Chapter 1).
SUMMARY
A GIS facilitates efficient capture, storage, organisation, management, query,
retrieval, transformation, analysis and integration of geoscience spatial data sets used in
mineral exploration. Such functionalities of a GIS, in turn, facilitate efficient modeling
of spatial geo-information such as geochemical anomalies and prospective areas. The
registration of spatial data to a common coordinate system, the representation of geo-
objects and their data attributes as either vector or raster data models, and the
organisation of spatial data attributes in relational databases all contribute to facility in
analysis and integration of various spatial data or geo-information as a series of data
layers. The way of analysing and integrating spatial data or geo-information in a GIS is
actually an extension of the traditional light table method employed by mineral
explorationists in the past. Spatial data operations on single or multiple data layers
provide efficient tools for analysis of inter-relationships between data, which are
important in modeling of geochemical anomalies and prospective areas. The various
functionalities of a GIS that are relevant in predictive modeling of geochemical
anomalies and prospective areas are demonstrated further in the succeeding chapters.
51
Chapter 3
EXPLORATORY ANALYSIS OF GEOCHEMICAL ANOMALIES
INTRODUCTION
Among the traditional methods for modeling of uni-element geochemical anomalies
(see Chapter 1), the estimation of threshold as the mean plus (or minus) twice the
standard deviation (hereafter denoted as mean±2SDEV) of a data set is based on classical
statistics and hypothesis testing. The application of classical statistics fundamentally
assumes that data consist of independent samples and have a normal distribution. These
assumptions also apply to probabilistic data analysis (e.g., testing significance or
probability levels of independence or normality). The assumptions in probabilistic and
classical statistical data analyses are rigorous and require that data have been collected
under rather carefully controlled conditions as in physical experiments. Whilst mineral
explorationists strive to collect precise and accurate geochemical data, there are several
uncontrollable factors that influence the values and variations of element contents in
Earth materials that they sample. Such factors include not only geogenic (e.g., metal-
scavenging by Fe-Mn oxides, lithology, etc.) and anthropogenic (i.e., man-induced)
processes but also sampling and analytical procedures. Thus, uni-element geochemical
data sets invariably contain more than one population, each of which represents a unique
process. In addition, because geogenic processes are spatially dependent on one another
and invariably explain the highest proportion of variations in uni-element contents in
geochemical samples, it follows that geochemical data are invariably not spatially
independent. Thus, many uni-element geochemical data sets invariably do not follow a
normal distribution model (e.g., Vistelius, 1960; Reimann and Filzmoser, 1999). Certain
transformations are usually applied to ‘normalise’ the values in a uni-element
geochemical data set (Miesch, 1977; Joseph and Bhaumik, 1997), but even then most, if
not all, transformed uni-element geochemical data sets only approximate a normal
distribution (e.g., McGrath and Loveland, 1992). If a geochemical data set contains more
than one population and does not follow a normal distribution model, then estimation of
threshold as the mean±2SDEV can lead to spurious models of geochemical anomalies.
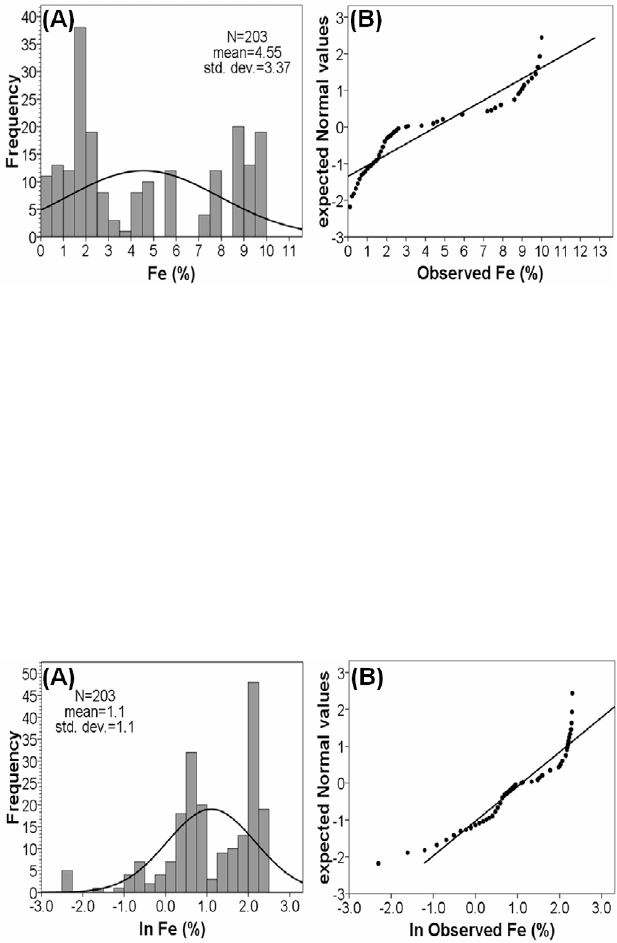
As an example here, Fig. 3-1 shows that the distribution of Fe concentrations in soil
displayed in Fig. 1-1 clearly deviates from normality and consists of at least two
populations (Fig. 3-1). Based on the given statistics in Fig. 3-1, the threshold estimated
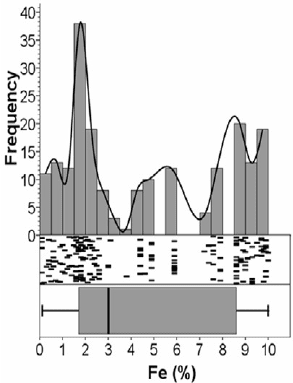
as mean+2SDEV of the data is greater than the maximum value in the data. The log
e
-
transformed soil Fe values also do not approximate a log-normal distribution model and
highlight the presence of at least two populations (Fig. 3-2). Based on the given statistics
Geochemical Anomaly and Mineral Prospectivity Mapping in GIS
by E.J.M. Carranza
Handbook of Exploration and Environmental Geochemistry, Vol. 11 (M. Hale, Editor)
© 2009 Elsevier B.V. All rights reserved
.
52 Chapter 3
in Fig. 3-2, the estimated threshold as (anti-log of the) mean+2SDEV of the log
e
-
transformed data is less than the maximum data value, but the value of the (anti-log of
the) mean–2SDEV of the log
e
-transformed data is negative. Clearly, the application of
classical statistics should be avoided in characterising empirical density distributions and
mapping spatial distributions of uni-element geochemical data sets that do not follow a
normal distribution model.
In the late 1970s, Tukey (1977) introduced the paradigm of exploratory data analysis
Fig. 3-1. (A) Histogram depicting the empirical density distribution of soil Fe (%) values (see Fig.
1-1) and the bell-shaped estimated density distribution curve based on a normal distribution
model. (B) Normal Q-Q plot of soil Fe (%) values versus expected values based on a normal
distribution model. If the soil Fe values have a normal distribution, the points should fall exactly
on the line.
Fig. 3-2. (A) Histogram depicting the empirical density distribution of log
e
-transformed soil Fe
(%) values (see Fig. 1-1) and the bell-shaped estimated density distribution curve based on a
normal distribution model. (B) Normal Q-Q plot of log
e
-transformed (ln) soil Fe (%) values versus
expected values based on a log-normal distribution model. If the log
e
-transformed soil Fe (%)
values have a normal distribution, the points should fall exactly on the line.
Exploratory Analysis of Geochemical Anomalies 53
(EDA), which was then considered as an unconventional and informal approach to
analyse and interpret univariate data that do not follow a normal distribution model.
Since the early 1980s, the EDA approach has gained attention in analysis and modeling
of uni-element geochemical anomalies (e.g., Campbell, 1982; Smith et al., 1982;
Howarth, 1983a, 1984; Garrett, 1988; Kürzl, 1988; Rock, 1988b; Chork and
Mazzucchelli, 1989; Cook and Fletcher, 1993; Yusta et al., 1998; Bounessah and Atkin,
2003; Reimann et al., 2005; Reimann and Garrett, 2005; Grunsky, 2006). This chapter
(a) reviews the concept and methods of EDA that are relevant in modeling of uni-
element geochemical anomalies and (b) demonstrates a GIS-based case study application
of EDA in modeling of significant geochemical anomalies.
EXPLORATORY DATA ANALYSIS
EDA is not a method but a philosophy of or an approach to robust data analysis
(Tukey, 1977). It consists of a collection of descriptive statistical and, mostly, graphical
tools intended to (a) gain maximum insight into a data set, (b) discover data structure, (c)
define significant variables in the data, (d) determine outliers and anomalies, (e) suggest
and test hypotheses, (f) develop prudent models, and (g) identify best possible treatment
and interpretation of data. Whereas the sequence of classical statistical data analysis is
problem→data→model→analysis→conclusions and the sequence of probabilistic data
analysis is problem→data→model→prior data distribution analysis→conclusions, the
sequence of EDA is problem→data→analysis→model→conclusions. Thus, classical
statistical data analysis and probabilistic data analysis are confirmatory approaches to
data analysis (being based on prior assumptions of data distribution models), whilst
EDA, as its name indicates, is an exploratory approach to data analysis.
The goal of EDA is to recognise ‘potentially explicable’ data patterns (Good, 1983)
through application of resistant and robust descriptive statistical and graphical tools that
are qualitatively distinct from the classical statistical tools. From a statistical point of
view, a statistic is resistant and robust (Huber, 1981; Hampel et al., 1986) (a) if it is only
slightly affected either by a small number of gross errors or by a high number of small
errors (resistance) and (b) if it is only slightly affected by data outliers (robustness). The
descriptive statistical and graphical tools employed in EDA are based on the data itself
but not on a data distribution model (e.g., normal distribution), yet they provide resistant
definitions of univariate data statistics and outliers.
Graphical tools in EDA
The emphasis in EDA is interaction between human cognition and computation in
the form of statistical graphics that allow a user to perceive the behaviour and structure
of the data. Among the several types of EDA graphical tools (Tukey, 1977; Velleman
and Hoaglin, 1981; Chambers et al., 1983), the density trace, jittered one-dimensional
scatterplot and boxplot are most commonly used in uni-element geochemical data
analysis (Howarth and Turner, 1987; Kürzl, 1988; Reimann et al., 2005; Grunsky, 2006).
These three EDA graphics, which can be readily stacked on one another (Fig. 3-3), are
54 Chapter 3
often used together with a histogram. That is because the visual impression one obtains
about univariate data behaviour and structure from a histogram alone is influenced by
the choice of number of classes for constructing a histogram. The combination of the
three EDA graphics with a histogram provides better insight to univariate data behaviour
and structure than from a histogram alone. Unlike a histogram, the three EDA graphics
can readily indicate any ‘abnormalities’ in a univariate data set.
A density trace is similar to a histogram, but it describes the empirical density
distribution of univariate data in a much more realistic manner and its shape does not
change significantly with change in the number of classes. The appropriate number of
classes for constructing a histogram can be controlled by constructing a jittered one-
dimensional scattergram, in which the univariate data are plotted at random positions
across a narrow band (usually with a range of 0-1) orthogonal to the univariate data axis.
Because a jittered one-dimensional scattergram is not based on classes of univariate data,
it provides additional pieces information about data (i.e., structure, behaviour, local
densities, gaps, outliers) that should be portrayed by a histogram and density trace. A
boxplot displays information about the characteristics (e.g., central tendency, spread,
etc.) of the empirical density distribution of a univariate data set, such that it is probably
the most useful of the EDA graphical tools applied in geochemical data analysis and so it
is given special attention here.
Boxplot and 5-number statistics of univariate data
A boxplot is created by first ordering data values from the minimum to the
maximum, or vice versa (Fig. 3-4). The median value is then determined by counting
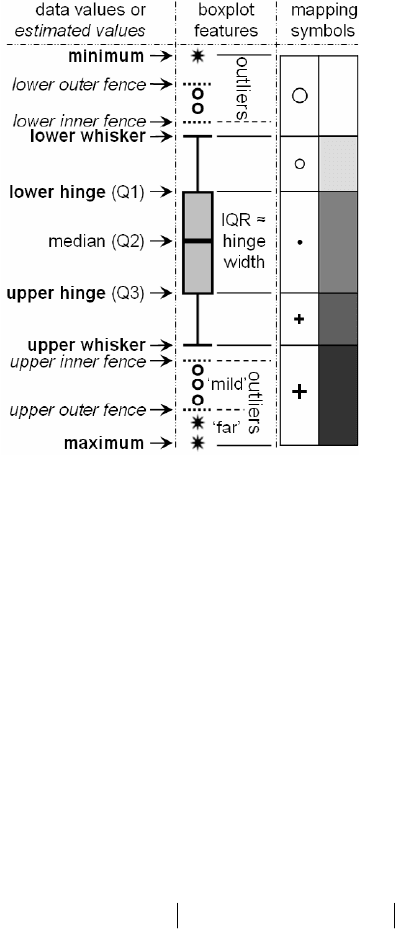
Fig. 3-3. Histogram and EDA graphics (density trace, jittered one-dimensional scatterplot,
boxplot) depicting the empirical density distribution of the soil Fe data in Fig. 3-1.
Exploratory Analysis of Geochemical Anomalies 55
half way through the data values from the minimum to the maximum or vice versa,
thereby dividing the univariate data set into two equal parts. By counting half way from
the minimum to the median and from the maximum to the median, the lower hinge (LH)
value and the upper hinge (UH) value are determined, respectively. The lower hinge,
median and upper hinge, thus, divide a data set into four approximately equal parts
known as quartiles. Values from the minimum to the lower hinge represent the 1
st
quartile (Q1) of a data set, values from the lower hinge to the median value represent the
2
nd
quartile (Q2), values from the median to the upper hinge represent the 3
rd
quartile
(Q3) and values from the upper hinge to the maximum represent the 4
th
quartile (Q4). A
box is then drawn between the lower and upper hinges. The box is then divided usually
by a line at the median value. The absolute difference between the values at the lower
and upper hinges represents the inter-quartile range (IQR) or hinge width:
hingeupperhingelowerIQRwidthhinge −== . (3.1)
A lower inner fence (LIF) and a lower outer fence (LOF) are defined at 1½×IQR and
3×IQR, respectively, away from the lower hinge towards the minimum value.
Algebraically, values (X) at the LIF and the LOF can be defined, respectively, as:
Fig. 3-4. Boxplot features representing characteristics of a univariate data set. Text in italics
represents estimated values based on the inter-quartile range (IQR) or hinge width. Text in bold
represents data values at which a univariate data set may be divided into five robust classes. Each
class is represented by EDA-mapping symbols or grey-scale colours as shown here.
56 Chapter 3
)5.1( IQRXX
LHLIF
×−= (3.2)
)3( IQRXX
LHLOF
×−= (3.3)
An upper inner fence (UIF) and an upper outer fence (UOF) are also defined at 1½×IQR
and 3×IQR, respectively, away from the upper hinge toward the maximum.
Algebraically, values (X) at the UIF and the UOF can be estimated, respectively, as:
)5.1( IQRXX
LHUIF
×+= (3.4)
)3( IQRXX
LHUOF
×+= (3.5)
For log-transformed data, the fences are defined using log-transformed values in either
equation (3.4) or (3.5).
The lower whisker (LW) and the upper whisker (UW) are drawn from each of the
hinges toward the most extreme data values within the inner fences. Algebraically,
values (X) of the LW and the UW can be determined, respectively, as:
()
][min
LIFLW
XXXX >= , and (3.6)
()
][max
UIFUW
XXXX <= . (3.7)
where the values in brackets are those within the inner fences and the hinges. For log-
transformed data, the log values of the inner fences must be anti-logged for use in either
equation (3.6) or (3.7). Data values beyond the inner fences are considered outliers. Data
values between the inner and outer fences are considered ‘mild’ outliers, whilst data
values beyond the outer fences are considered ‘far’ or extreme outliers, i.e., very unusual
values (Kotz and Johnson, 1985, pp. 136-137). Mild and extreme outliers beyond the
inner fences are marked by different symbols (e.g., open circles and asterisks,
respectively (Fig. 3-4)).
A boxplot thus defines the 5-number summary statistics (minimum, LH, median, UH
and maximum) and describes the most important characteristics of a univariate data set,
namely (Tukey, 1997; Hoaglin et al., 2000): (a) location or central tendency; (b) spread;
(c) skewness; (d) lengths of tails; and (e) outliers. As the box represents approximately
50% or two quartiles of a univariate data set, it means that at most 25% of data can be
outliers but these values do not significantly affect the median and the hinges. In
addition, because the inner fences are defined by the IQR or the hinge width, they are not
seriously affected by outliers. These imply that the boxplot (or box-and-whiskers) plot is
resistant and robust against extreme outliers in a univariate data set.

Exploratory Analysis of Geochemical Anomalies 57
Classification of uni-element geochemical data
Based on a boxplot, an exploration uni-element geochemical data set can usually be
divided into five robust classes (Fig. 3-4): (1) minimum–LW; (2) LW–LH; (3) LH–UH;
(4) UH–UW; and (5) UW–maximum. The UIF is usually considered the threshold
separating background values and anomalies (e.g., Bounessah and Atkin, 2003; Reimann
et al., 2005), although the UOF can also be used as the threshold (e.g., Yusta et al.,
1998). However, an estimated value representing the UIF (equation (3.4)) may not be
actually part of an exploration uni-element geochemical data set, so that outliers beyond
the UW represent anomalies. Thus, data values in the UH–UW class (at most 25% of a
data set) can be considered high background, data values in the LH–UH class (at most
50% of a data set) are background, data values in the LW–LH class (at most 25% of a
data set) are low background and data values in the minimum–LW class are extremely
low background.
Aside from the boxplot-defined threshold (e.g., UIF or UW), a threshold can be
defined from the EDA statistics as median+2MAD. The MAD is the median absolute
deviation, which is estimated as the median of absolute deviations of all data values from
the data median (Tukey, 1977):
])([
ii
XmedianXmedianMAD −= (3.8)
where the values in brackets are absolute differences between values X
i
and median of
such values. The MAD is analogous to the SDEV in classical statistics, so the EDA
median+2MAD threshold is also analogous to the classical mean+2SDEV threshold.
Standardisation of classified uni-element geochemical data
When dealing with individual uni-element geochemical data sets showing presence
of multiple populations (e.g., as shown in Fig. 3-3), analysis of only the whole of a uni-
element geochemical data set is inadequate for recognition of anomalies that may be
associated with individual populations in the data. It is imperative to subdivide a uni-
element geochemical data set into subsets representing the various populations present.
The empirical data distribution of a geochemical data set as depicted in a boxplot or in a
cumulative probability plot (Tennant and White, 1959; Sinclair, 1974) and in equivalent
Q-Q (quantile-quantile) or Normal Q-Q plots (Figs. 3-1 and 3-2) can be useful in
graphical examination of multiple populations and in defining breaks or inflection
points, at which to subdivide a uni-element geochemical data set into subsets
representing those populations. Alternatively, if populations present in a uni-element
geochemical data set are considered to be strongly related to certain geogenic variables
(e.g., lithology) that have also been recorded during the geochemical sampling, then
individual uni-element geochemical data sets may be subdivided into subsets according
to such variables.
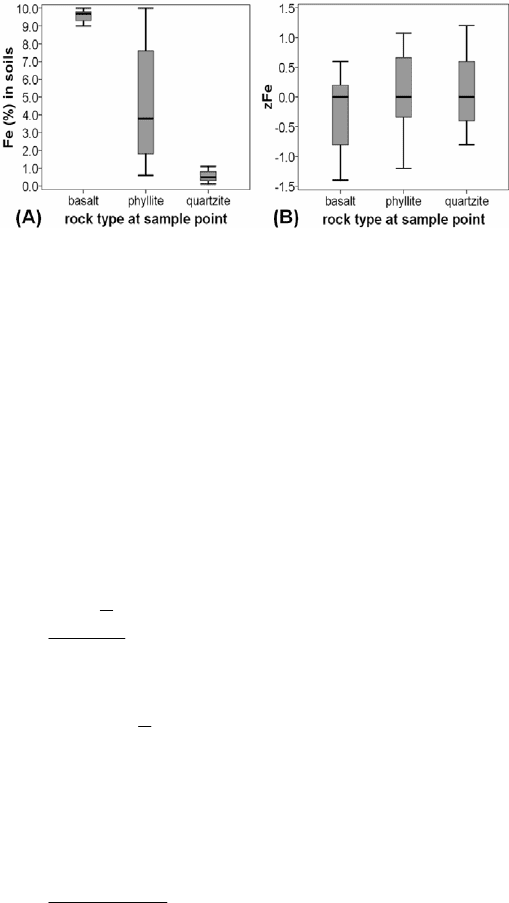
For example, Fig. 3-5A shows boxplots of subsets of the soil Fe data according to
rock type at the sample sites. Comparing and contrasting these boxplots of subsets of the
58 Chapter 3
data with the boxplot of the whole data (Fig. 3-3) would lead one to make the following
conclusions. If presence of multiple populations in the data set is not recognised (or
ignored) and if such populations are not analysed individually, then the Fe data values
associated with basalt could all be misclassified and mapped as high background whilst
the Fe data values associated with quartzite could all be misclassified and mapped as low
background. Such misclassifications based on analysis of a whole uni-element
geochemical data set could lead to mapping of false positive and false negative
geochemical anomalies (or Type I and Type II errors, respectively).
For proper and uniform classification of different populations that may be present in
a uni-element geochemical data set, a suitable standardisation algorithm is required. A
standardisation algorithm based on classical statistics is defined as:
j
jij
ij
SDEV
XX
Z
−
=
(3.9)
where Z
ij
represents the standardised data values for population j, X
ij
the original values i
in population j,
j
X the arithmetic mean of X
ij
values and SDEV
j
the standard deviation
of X
ij
values. Because the mean and standard deviation in classical statistics are not
resistant to outliers, the standardisation algorithm in equation (3.9) should be avoided
accordingly. Yusta et al. (1998) proposed the following standardisation algorithm based
on EDA statistics:
j
jij
ij
IQR
medianX
Z
−
=
. (3.10)
The standardisation algorithm in equation (3.10) makes each population j in a
geochemical data set comparable to one another and consequently makes classes of the
Fig. 3-5. Boxplots of subsets of the soil Fe data (shown in Fig. 1-1) based on rock type at sampling
sites. (A) Original data values. (B) Data values standardised according to equation (3.10).

Exploratory Analysis of Geochemical Anomalies 59
different populations in a uni-element geochemical data set comparable (Fig. 3-5B). The
MAD can be used in lieu of IQR in equation (3.10), thus:
j
jij
ij
MAD
medianX
Z
−
=
. (3.11)
The EDA standardised values according to equation (3.11) are thus analogous to the
classical standardised values according to equation (3.9).
In order to compare anomalies associated with different populations in a uni-element
geochemical data set, the boxplot-defined threshold and the IQR defined for each
population j can be used for standardisation (cf. Yusta et al., 1998):
j
jij
ij
IQR
thresholdX
Z
−
=
. (3.12)
The standardisation via equation (3.12) should make use of the same type of boxplot-
defined threshold values (e.g., the boxplot UW). Alternatively, the median+2MAD and
the median can be used for standardisation:
j
jij
ij
median
MADmedianX
Z
)2( +−
=
. (3.13)
The standardisation algorithms in either equation (3.10) or equation (3.11) would
allow representation of uni-element geochemical data from different sampling media in
the same maps in order to, for example, compare spatial distributions of the same
elements in rocks and soils. Equation (3.12) or equation (3.13) could be used, for
example, to compare anomalies of the same (pathfinder) elements in different sampling
media. Standardisation of various uni-element geochemical data sets via either equation
(3.10) or equation (3.11) can be an important step prior to modeling of multi-element
signatures through application of multivariate analytical techniques, which require
proper estimation of the multivariate covariance (or correlation) matrix.
Mapping of classified uni-element geochemical data
EDA-mapping symbols (Tukey and Tukey, 1981; Kürzl, 1988; Reimann, 2005), such
as those shown in Fig. 3-4, have been proposed to represent data in robust-class intervals
defined by a boxplot. A boxplot can be conveniently used as a map legend explaining the
symbols of classes of data values. For point-symbol representation of uni-element
geochemical data (say, for stream sediment samples), circles and crosses are used
because they can be readily perceived to signify low and high values, respectively. Thus,
extremely low background values, which are usually more infrequent than anomalies in
an exploration uni-element geochemical data set, are represented by large open circles;