Claverie J-M., Notredame C. Bioinformatics for Dummies
Подождите немного. Документ загружается.

an overview of a complete BLAST output with its four distinctive sections. If
you understand everything in this output, we think you can call yourself a
bioinformaticist and let others suspect you have magic powers!
An overview of the BLAST output
You’ll find four sections in the output of most BLAST servers. These sections
always appear in the same order, shown in Figure 7-7, and include
1.
A graphic display: Shows you where your query is similar to other
sequences. Depending on the server you use, this display can change a
lot. It may also be absent on some servers.
2.
A hit list: The name of sequences similar to your query, ranked by
similarity.
3.
The alignments: Every alignment between your query and the reported
hits.
4.
The parameters: A list of the various parameters used for the search.
Each of these elements contains a lot of information. Knowing what matters
in each of these displays can be very useful to your research.
Figure 7-7:
Schematic
represen-
tation of the
main compo
nents of a
BLAST
output (does
not include
the parame-
ters section
at the
bottom).
210
Part III: Becoming a Pro in Sequence Analysis
13_089857 ch07.qxp 11/6/06 3:58 PM Page 210
The graphic display
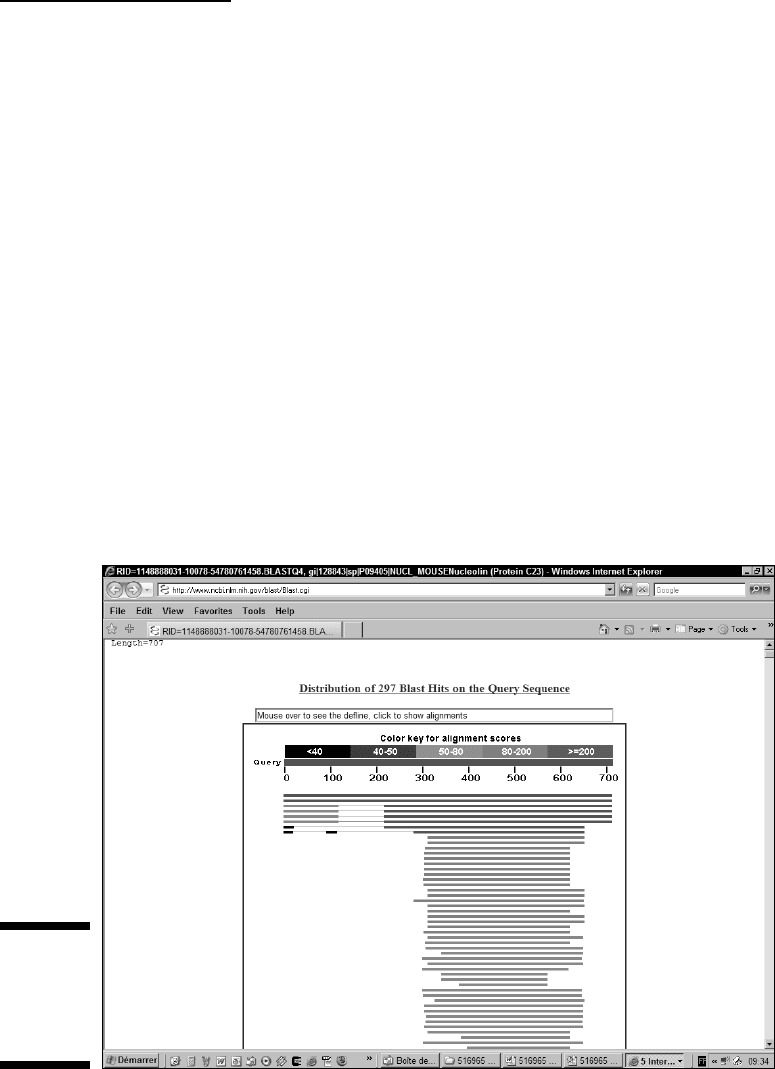
The display in Figure 7-8 helps you visualize your results. Your query
sequence is at the top. Each bar represents the portion of another sequence
that’s similar to your query sequence — and the region of your sequence in
which this similarity occurs. Red bars indicate the most similar sequences;
pink bars indicate matches that are a bit less good; green bars indicate
matches that are not impressive at all. The blue and the black bars indicate
matches that have the worst scores.
Red, pink, and green matches are usually the good ones. Black hits are the
bad hits: proteins that have so little in common with the query that their
alignment probably means nothing from a biological point of view. (They
come from the twilight zone.)
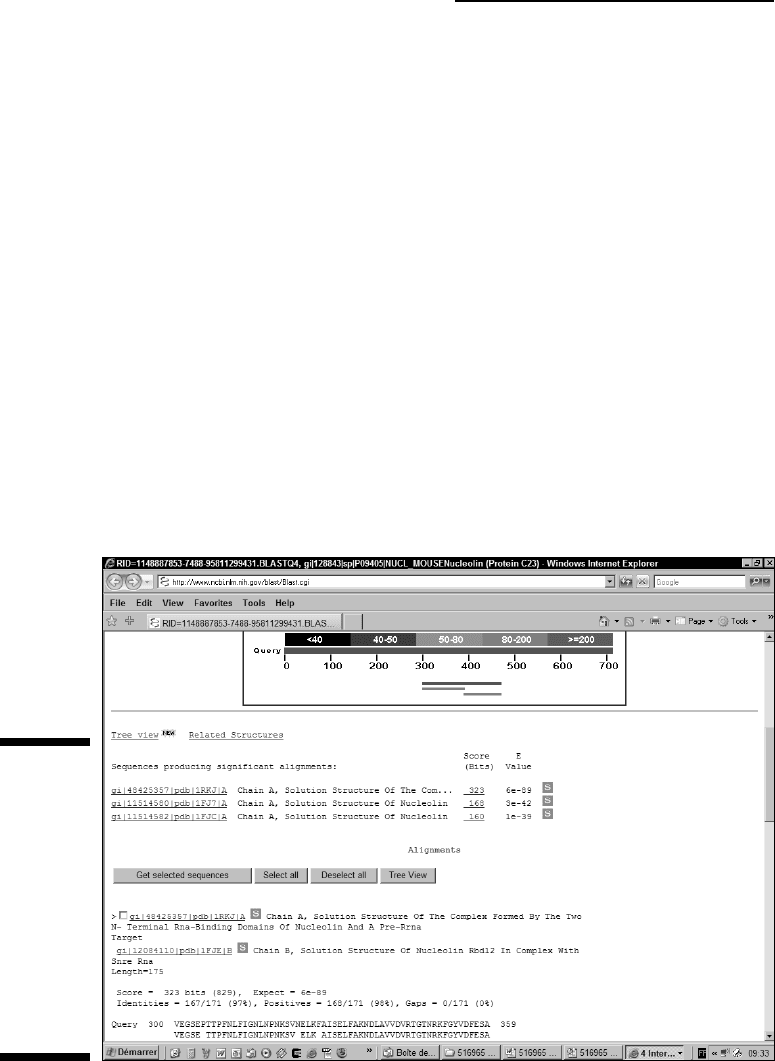
The nice thing about this display is that it can help you see that some matches
do not extend over the complete length of your sequence. It is a useful tool to
discover domains. For instance, here in Figure 7-8, the top hits are proteins
homologous to the nucleolin. Near the bottom, the shorter hits correspond to
the domain in the nucleolin that binds RNA. These hits indicate proteins that
also contain this RNA binding domain but are otherwise unrelated to the
nucleolin.
Figure 7-8:
The NCBI
BLAST
graphic
display.
211
Chapter 7: Similarity Searches on Sequence Databases
13_089857 ch07.qxp 11/6/06 3:58 PM Page 211

This display from the NCBI is active: If you pass the mouse pointer over a bar,
the name of the corresponding sequence appears in the little window at the
top; if you click this bar, the browser takes you to the corresponding align-
ment within this same page. (Please note that the graphical display you get
from EMBnet is not active.)
When two colored lines are linked by a thin black line, as happens on the
third line in Figure 7-8, it means that the same protein matches your query in
two separate locations. (Please note that the thin black line is what you see
with NCBI; on the EMBNet server, you’ll see a dashed black line.) These matches
are independent, but they could probably be joined to form a longer match.
The hit list
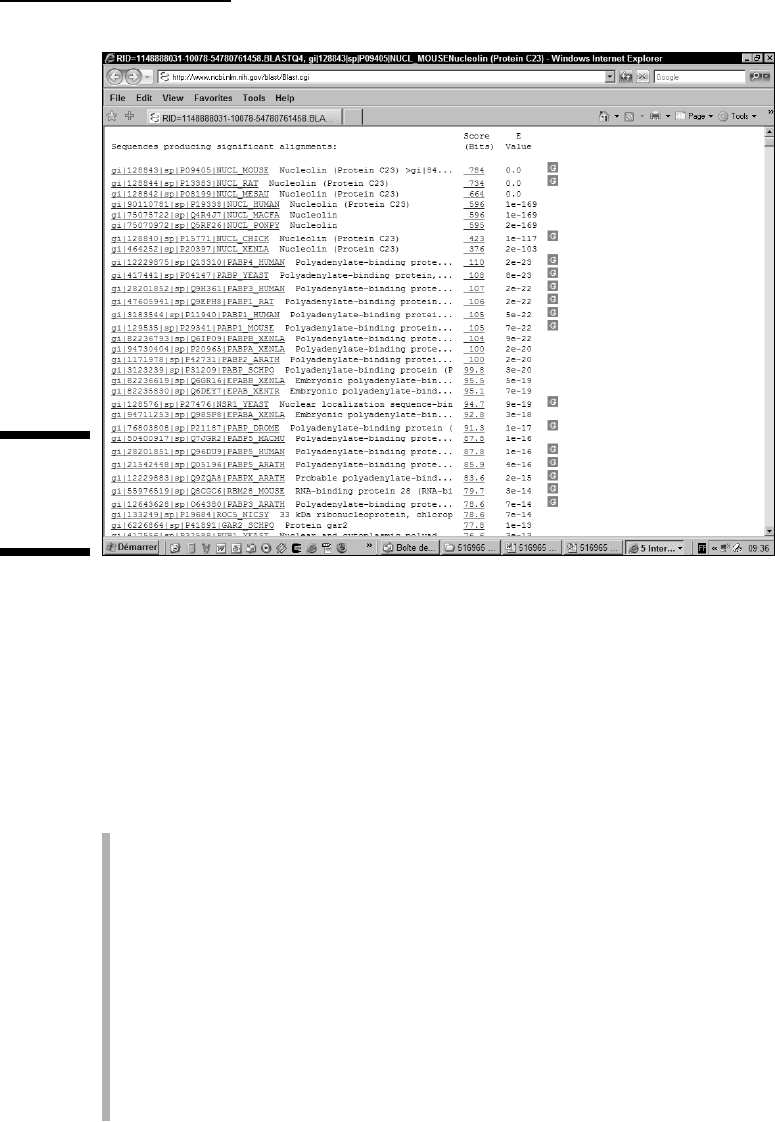
Most BLAST users consider the hit list (like the one shown in Figure 7-9) their
favorite part of the BLAST output. It immediately tells you whether your
sequence looks like something that’s already in the database — and whether
you can trust it as a good hit. Each line contains four important features:
The sequence accession number and the name: This hyperlink takes
you to the database entry that contains this sequence. In this entry, you
may find very important annotated information describing the sequence.
A Swiss-Prot link (|sp|
in Figure 7-9) may tempt you with potentially
useful information.
Description: A description that comes from the annotation lets you
know at a glance whether this finding could be interesting for you. Of
course, you never have a guarantee that this annotation is correct; we
recommend that you carefully check the complete annotation before get-
ting overly excited.
The bit score: A measure of the statistical significance of the alignment.
The higher the bit score, the more similar the two sequences. Matches
below 50 bits are very unreliable.
The E-value (the expectation value): By estimating the number of times
you could have expected such a good match only by chance (given the
database), the E-value provides you with the most important measure
of statistical significance. (See the nearby sidebar, “E-values, similarity,
and homology.”) The lower the E-value, the more similar the sequences
and the more confidence you can have that this hit is really homologous
to your query. For instance, sequences identical to your query have
E-values very close to 0. Matches above 0.001 are often close to the twi-
light zone.
Genomic link: Now that so many complete genomes are available, you
probably want to know about the genomic location of potential matches.
Whenever such information is available, it is indicated by a purple G.
Just click the G and you’ll find out everything you need to know about
this gene.
212
Part III: Becoming a Pro in Sequence Analysis
13_089857 ch07.qxp 11/6/06 3:58 PM Page 212
The alignments
No matter what we say about E-values and statistical significance, a number
is only a number. When it comes to telling the real story, biologists only trust
alignments. Biologists are convinced that alignments cannot lie, and this is
mostly true — if you know how to look at them.
BLAST displays the alignments for a BLAST search just below the hit list, as
shown in Figure 7-10. In every BLAST alignment, you can find the following
features.
The name(s): The first item is the name. Sometimes there is more than
one sequence name; this happens whenever several sequences align
identically to those in the query. For instance, if the database contains
several sequences that are identical to the ones in the query, all these
matches will be reported as a single hit in the alignment section. This
may even happen with so-called Non-Redundant databases!
The percentage of identity: This gives you a concrete substitute for the
E-value. Remember the magic number: An identity of more than 25 percent
is good news. (The
identity is the number of identical residues divided
by the number of matched residues — gaps are simply ignored.) The
Positives field gives you a measure of the fraction of residues that are
either identical or similar — represented with a
+ on the actual align-
ment. The
Gaps field shows residues that were not aligned.
Figure 7-9:
The NCBI
BLAST
hit list.
213
Chapter 7: Similarity Searches on Sequence Databases
13_089857 ch07.qxp 11/6/06 3:58 PM Page 213

214
Part III: Becoming a Pro in Sequence Analysis
E-values, similarity, and homology
A high level of similarity between two
sequences often indicates that the two have
evolved from a common ancestor and have
the same overall 3-D structure. Biologists call
these sequences
homologues.
In practice,
homologue sequences often have similar bio-
chemical functions.
If you are studying a protein, the most desirable
object in the universe is a very well-character-
ized protein sequence that’s clearly homolo-
gous to your protein. People search databases
in hopes of finding this special sequence.
That’s all very fine, but how do you show that
your two sequences are homologous? Think of
homologous sequences as relatives in a family.
We all know that relatives tend to look alike, but
we also know that two persons with the same
eye color aren’t necessarily siblings. On the
other hand, if they have the same type of hair,
the same facial features, and so on, we can be
tempted to conclude that they are true relatives.
It works the same way with sequences.
How similar must sequences be in order to be
considered homologous? The answer is clear:
More than
25 percent
of the amino acids pres-
ent for proteins — and more than
70 percent
of
the nucleotides present for DNA — must be
similar. Above this limit, you can be almost sure
that two proteins have the same structure and
the same common ancestor. Below that limit
lies the twilight zone — that spooky identity
range where nobody can really be sure whether
the observed similarity means anything.
Warning:
Be careful! The
25-percent
and
70-
percent
limits only work for sequences that
contain more than 100 amino acids or nucle-
otides. You might frequently get near-perfect
identity between short segments (10 residues,
for instance) of totally unrelated proteins or
DNA sequences.
Everybody loves percent identities because
they are so easy to spot visually. Unfortunately,
they are not always a good indicator. For
instance, they tell you nothing when many
similar — but not identical — amino acids are
aligned together. Moreover, how do you tell the
difference between 60 matched residues
spread over a 100-residue segment, and 120
matches spread over a 200-residue segment?
The longest is probably more meaningful, but
the percent identity says nothing about this.
Gurus invented E-values so we’d have a crite-
rion more objective than percentage-of-similar-
ity. E-values (short for
expectation values
) are a
powerful tool for comparing pairwise align-
ments with different similarities and different
lengths. They also help you decide how much
you can trust your conclusion on homology.
With E-values, you know when you can get
excited or when you should wait and see.
The E-value has a very concrete meaning: It is
the number of times your database match may
have occurred just by chance. We consider a
match that’s very unlikely to occur just by
chance to be a very good match; that’s why
results associated with the
lowest
E-values are
the best. We say they’re the most
significant
because we know we can trust them enough to
infer homology.
In theory, alignments associated with E-values
lower than one should all be trusted. In practice,
this is not true because BLAST uses an approx-
imate formula for computing the E-values and
strongly underestimates them. In the sequence
world, a similarity with an E-value above 10-
4
(0.0001) is not necessarily interesting. If you
want to be certain of the homology, your E-value
must be lower than 10-
4
.
BLAST isn’t the only program that uses E-
values. You may come across them almost any
time you compare two sequences — even if you
use programs that compare sequences and
domains. The principle is always the same.
13_089857 ch07.qxp 11/6/06 3:58 PM Page 214
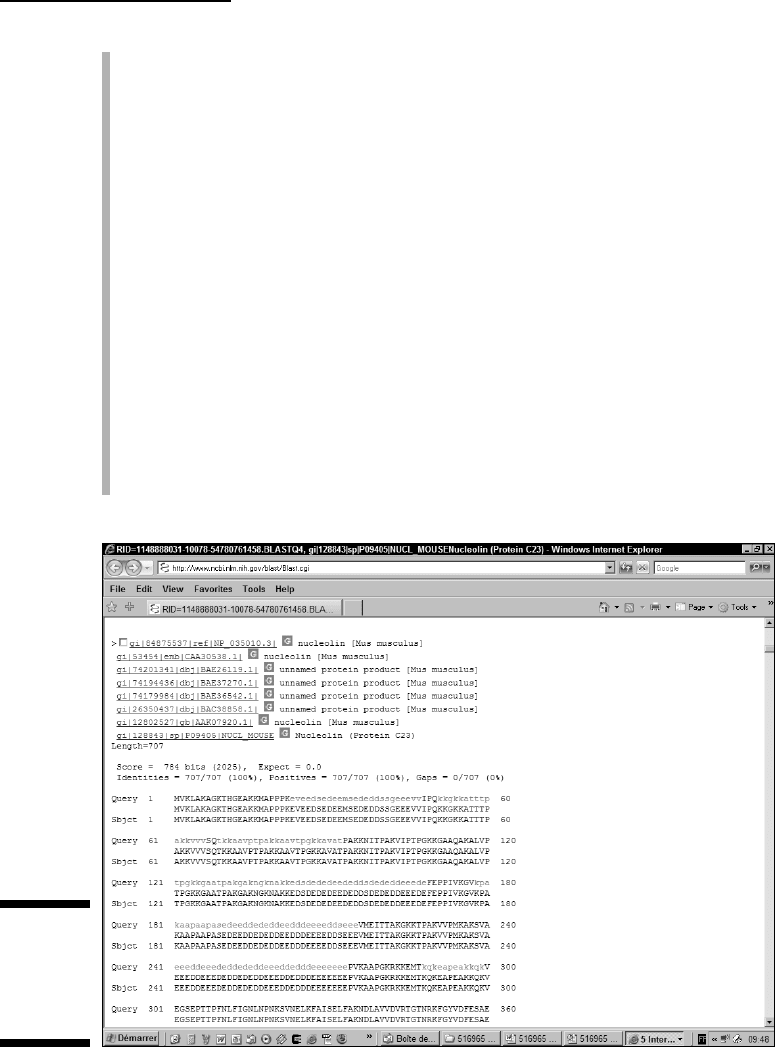
Length: This is the length of the alignment, which indicates how long the
two segments of your sequences are that BLAST has aligned. It is the
best way to see whether a hit means something. Sometimes, very short
alignments can come up with high E-values and not be very meaningful.
The top sequence: Your query.
The bottom sequence: The “hit” — here referred to as the “subject.”
The line in between the sequences: Between the two sequences is a
line that contains a (
+) sign for similar amino acids, a letter for identical
residues, or a space for mismatches.
The XXXXX regions: In your query, BLAST inserts Xs automatically to
mask the regions that contain many identical residues. Gurus call these
regions the low-complexity segments. They can cause trouble in the
search; the Xs tell BLAST to ignore the corresponding segments. The
masking occurs only in the query sequence.
The numbers: Numbers to the right side of the sequences indicate the
coordinates of the match on your query sequence and on the hit
sequence. BLAST makes local alignments that may contain only a por-
tion of the query and the hit.
Figure 7-10:
Pairwise
alignments
reported by
BLAST.
215
Chapter 7: Similarity Searches on Sequence Databases
13_089857 ch07.qxp 11/6/06 3:58 PM Page 215
A good alignment should not contain too many gaps and should have a few
patches of high similarity — rather than isolated identical residues spread
here and there. This criterion is especially useful if the alignment is close to
the twilight zone.
Note that sometimes more than one alignment is reported within a hit. This
happens when the query and the hit sequence could be aligned in several
locations. On the graphic display, a thin black line (NCBI) or a dashed line
(EMBnet) connects these independent alignments.
The parameters
You don’t need to worry much about the meaning of the information that
comes at the bottom of the result page. If you’ve changed the default parame-
ters of BLAST, this part keeps track of it for you, making sure that you can
reproduce this search if you need it.
Nobody can guarantee that you can reproduce a result exactly, even if you
use the same BLAST server. The upgrade of any of the components in the
server can modify the results of the search. Components that may be
upgraded include
The databases
The BLAST program itself
The default parameters of the server
In real life, you have no control over these parameters. They always end up
changing with time. At least the information returned at the bottom of the
search may offer a clue about what
could be going wrong.
BLASTing DNA sequences
If you think that BLASTing a DNA sequence is like BLASTing a protein sequence,
you’re right — and you’re not right at the same time. While it’s true that the
principle is the same and that in practice BLASTing DNA requires operations
similar to BLASTing proteins, BLASTing DNA does not always work so well. It
is faster and more accurate to BLAST proteins (blastp) rather than nucleotides.
If you know the reading frame in your sequence, you’re better off translating
the sequence yourself and BLASTing with a protein sequence (see the corre-
sponding section, “BLASTing protein sequences,” earlier in this chapter). If
you don’t know the reading frame, then you must choose one of the following
BLAST programs (see Table 7-2) that deal with nucleotides.
216
Part III: Becoming a Pro in Sequence Analysis
13_089857 ch07.qxp 11/6/06 3:58 PM Page 216

Table 7-2 Different BLAST Programs Available
for DNA Sequences
Program Query Database Usage
blastn DNA DNA Very similar DNA sequences
tblastx TDNA TDNA Protein discovery and ESTs
blastx TDNA Protein Analysis of the query DNA sequence
T is for translated. It means that you hand over a DNA sequence to BLAST, and
BLAST translates this sequence into its six frames (three on one strand and
three on the other one). Where there is a Stop codon, BLAST replaces it with
an X. The six-frame translation means you needn’t worry about the DNA strand
you give to BLAST. The program tries each possible frame for you anyway.
Choosing the right flavor of BLAST for your DNA sequence
Although the list of programs in Table 7-2 with all the weird acronyms can
look complicated, don’t let it intimidate you — and remember that nothing
ever breaks in the cyberlab! Just ask yourself the questions in Table 7-3, in
the order listed, to determine which is the best program to use.
Table 7-3 Choosing the Right Flavor of BLAST for DNA
Question Answer
Am I interested in non-coding DNA? Yes: Use blastn
.
Never forget that blastn is
only for closely related DNA sequences
(more than 70 percent identical).
Do I want to discover new proteins? Yes: Use tblastx.
Do I want to discover proteins Yes: Use blastx.
encoded in my query
DNA sequence?
Am I unsure of the quality of my DNA? Yes: Use blastx if you suspect your DNA
sequence is the coding for a protein but
that it may contain sequencing errors.
Blastx can correct sequencing errors for you. If you aren’t sure of your pro-
tein sequence, blastx may reveal its similarity to a better-sequenced piece of
DNA. If you find that your sequence contains an unexpected frameshift, don’t
get immediately excited. Sequencing errors cause most of the observed
frame shifts — but double-check in the lab to be sure.
217
Chapter 7: Similarity Searches on Sequence Databases
13_089857 ch07.qxp 11/6/06 3:58 PM Page 217

Making the right choices for BLASTing DNA
From a server’s point of view, there’s no real difference between BLASTing a
protein and BLASTing a DNA sequence. The outline is exactly the same, and
you can follow blindly the steps in the “BLASTing protein sequences” section,
earlier in the chapter. Simply remember the following points:
Pick the right database: Choose a database that’s compatible with the
BLAST program you want to use. Unless you use blastx, it must be a
DNA sequence database. Most BLAST servers do not check to make sure
that you did this properly and, consequently, let you wait forever for
results that never come.
Restrict your search: Database searches on DNA are slower. When pos-
sible, restrict your search to the subset of the database that you’re inter-
ested in. For instance, if you’re interested in the Drosophila (fruit fly),
search only the Drosophila genome.
Shop around: Don’t hesitate to shop around to find a BLAST server that
contains the database you’re interested in.
Use filtering: Genomic sequences are full of repetitions. Be sure to filter
out at least some of them.
The BLAST way of doing things
People who do bioinformatic analysis know there is almost nothing you can’t
do with BLAST!
Whatever biological question you’re asking, chances are that
BLAST can give you some ideas before you start using more complicated pro-
grams or spend time designing costly experiments. In Table 7-4, we give you
four examples. For each of these applications, there is an exhaustive and
complicated
good solution — and then there’s the BLAST way: Quick and effi-
cient, it can be enough in most cases. (Of course, if you have too much time
on your hands, you can always go for the hard way.)
Table 7-4 Asking Biological Questions with BLAST
What You The BLAST Way The Complicated Alternative
Need to Do
Finding genes Cut your genome sequence Run gene-prediction soft-
in a genome into little (2-to-5-kilobyte) ware, sequence mRNAs
overlapping sequences.
Use blastx to BLAST each
piece of genome against
NR (the Non Redundant
protein database). This
works better if you have
no introns (bacteria).
218
Part III: Becoming a Pro in Sequence Analysis
13_089857 ch07.qxp 11/6/06 3:58 PM Page 218

What You The BLAST Way The Complicated Alternative
Need to Do
Predicting a protein Use blastp to BLAST your Conduct domain analysis or
function protein sequence against wet-lab experiments
Swiss-Prot. If you get a
good hit (more than 25 per-
cent identity) over the
complete length of the
protein, you’ve solved
your problem and you
know that your protein
has the same function as
the Swiss-Prot protein.
Predicting a protein Use blastp to BLAST your Conduct homology modeling,
3-D structure protein against PDB (the X-ray, or NMR analysis of
database of protein struc- your protein
ture). If you get a good hit
(an identity of more than
25 percent), you know
that your protein and this
good hit have a similar
3-D structure.
Finding protein Use blastp (or its more Clone new family members
family members powerful cousin PSI- using PCR techniques
BLAST) and run it against
NR (the non-redundant
protein family). After you
have all the members of
the family, you can make
a multiple sequence align-
ment (see Chapter 9) and
draw a phylogenetic tree.
Controlling BLAST: Choosing
the Right Parameters
As they say, power is nothing without control. This saying summarizes fairly
well how you can get the best out of BLAST: by controlling it. In this section,
we show you the main parameters in BLAST, what they do, and how you can
change them to suit your needs.
219
Chapter 7: Similarity Searches on Sequence Databases
13_089857 ch07.qxp 11/6/06 3:58 PM Page 219