Claverie J-M., Notredame C. Bioinformatics for Dummies
Подождите немного. Документ загружается.

• Do not give bogus e-mail addresses to the server! As soon as it
times out, the server decides to return your results by e-mail. You
cannot control this and if your e-mail was bogus, you will never
know what your tree looked like! In our experience, it never took
more than a few minutes before receiving the e-mail.
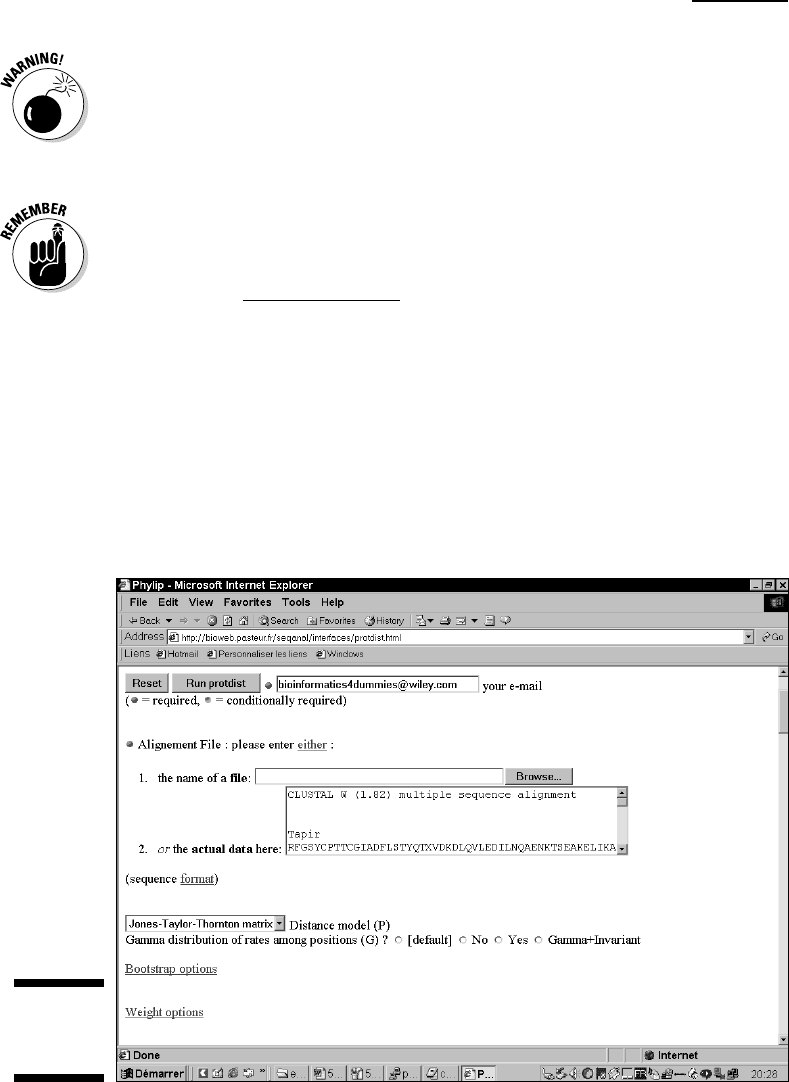
4. Paste your multiple alignment into the Sequence window, as shown in
Figure 13-8.
Do not forget to copy the header line that starts with CLUSTALW along
with your alignment.
5. Click the Bootstrap options link.
You are brought to the Bootstrap Options section of the Web page.
6. Select the Perform a Bootstrap Before Analysis check box, as shown
in Figure 13-9.
Bootstrapping your data is a way of assessing the quality of your tree;
see the “What is bootstrapping?” sidebar for details.
7. Set the seed to some odd number such as 1 or 3.
The seed controls the generation of random numbers during the boot-
strap. Different seeds lead to different results.
Figure 13-8:
Protdist
server.
390
Part IV: Becoming a Specialist: Advanced Bioinformatics Techniques
20_089857 ch13.qxp 11/6/06 4:03 PM Page 390
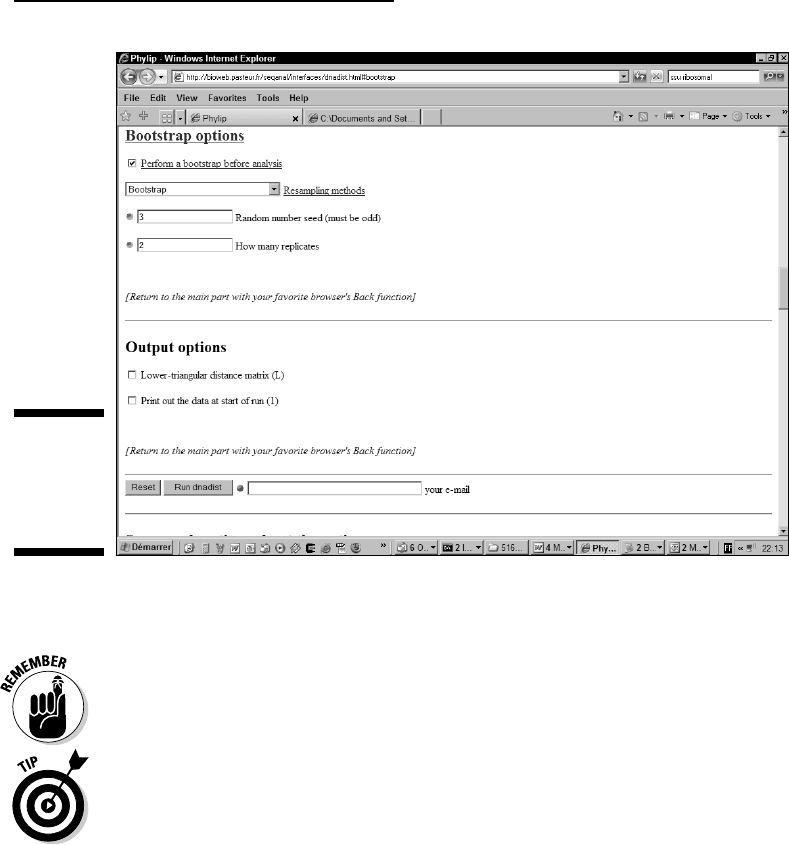
8. Keep the number of replicates to 100.
The number of replicates is the number of bootstrap cycles that you do.
Normally, this number should be at least 100.
Remember how many replicates you request as you will need to re-enter
this figure later!
For real analysis, you need at least 100 replicates, but if you only want to
get a feeling of how the server works, you may try values as small as 2.
If you do so, it will be fine for the computation but don’t expect the boot-
strap to be biologically meaningful! For the purposes of this tutorial,
we will use 2, so that the results get computed interactively, but if you
require a large number of replicates, the server usually prefers returning
the results by e-mail.
9. Scroll back to the top of the page and click the Run Protdist button.
Eventually, you’ll see results similar to what’s shown in Figure 13-10. If
your browser times out, the server will send you an e-mail that contains
a URL. If you open this URL, you’re taken to a page of results similar to
what’s shown in Figure 13-10.
Figure 13-9:
The
Bootstrap
options of
protdist.
391
Chapter 13: Building Phylogenetic Trees
20_089857 ch13.qxp 11/6/06 4:03 PM Page 391
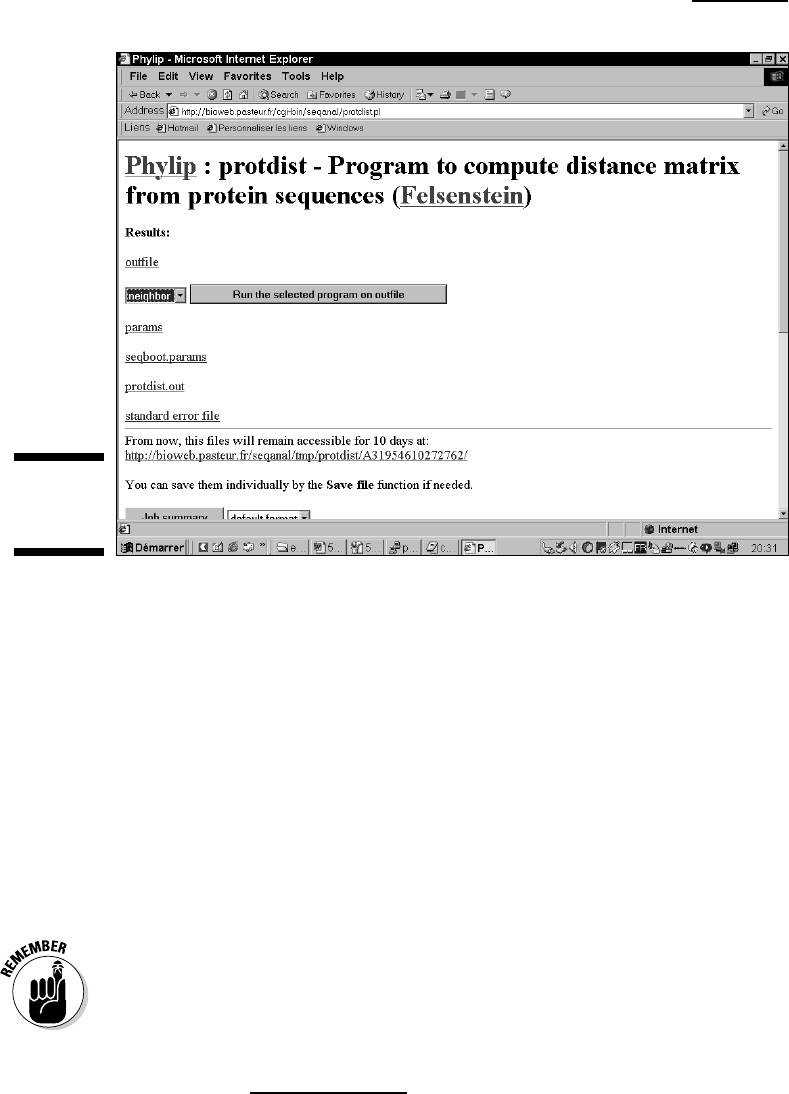
10. Choose Neighbor from the first drop-down menu on the result page.
Neighbor is a program that turns your distance matrix into a Neighbor
Joining tree.
If you want, you can use another tree-reconstruction method (such as
Fitch, which uses the mean-least-square method). These days, people
usually agree that NJ provides a very good trade-off between available
methods.
11. Click the Run the Selected Program on Outfile button.
The Neighbor page appears.
12. Select the type of tree you want to produce on the line that says
Distance Method. (Neighbor Joining should be selected by default.)
Neighbor Joining and UPGMA are related methods, but Neighbor Joining
produces trees that are much more accurate.
UPGMA produces rooted trees, where the root is an attempt to guess the
position of the common ancestor (See Figure 13-14).
Neighbor-Joining does not try to guess where the common ancestor lies
and produces unrooted trees that you can root later.
13. Select the Bootstrap options link.
Figure 13-10:
Protdist
results.
392
Part IV: Becoming a Specialist: Advanced Bioinformatics Techniques
20_089857 ch13.qxp 11/6/06 4:03 PM Page 392
This takes you to a lower section of the page where you will enter some
information related to the bootstrap we did in Figure 13-9.
This section is NOT identical to the Bootstrap section visited in Steps 5,
7, and 8. In Steps 5, 7, and 8 you declared how many Bootstrap cycles
you wanted to do. Now that the work is done, you must remind the pro-
gram how many cycles it has done!
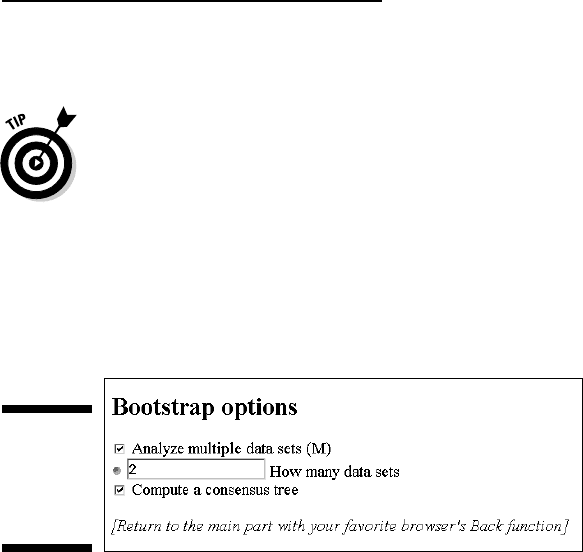
14. Select the Analyze Multiple Data Sets option.
15. Indicate the number of data sets you’re providing, as shown in
Figure 13-11.
Enter 100 if you have entered 100 in Step 8, or any number you have
used in that step.
16. Set the Random Seed to an odd number (such as 1 or 3), and check the
Randomize box.
No need to use the same number as in Step 7.
17. Check the Compute a Consensus Tree check box.
This option tells Neighbor to return the tree that has the best agreement
with the replicate data sets you are providing.
This option makes sense only if you are using the bootstrap and have
chosen values larger than 1 in Steps 8 and 15 (multiple datasets).
18. Scroll down to the Other Parameters section and choose an outgroup.
Here are some handy tips about outgroups:
• Choosing an outgroup only matters if you selected Neighbor
Joining in Step 10.
• You can specify which outgroup you want to use according to its
position in the multiple alignment, and Neighbor uses this out-
group as a root.
• In your tree, the
root represents the common ancestor of all the
sequences. (Remember, however, that living fossils do not exist!)
This outgroup is not the real root, but the real root is necessarily
between the outgroup and its closest node.
Figure 13-11:
The
Bootstrap
option of
Neighbor.
393
Chapter 13: Building Phylogenetic Trees
20_089857 ch13.qxp 11/6/06 4:03 PM Page 393
Depending on the server and the default options, ClustalW sometimes
changes the order of your sequences when it aligns them. It is, however,
the order in the multiple alignment that prevails when you specify your
outgroup. We therefore suggest that you take a look at your alignment to
ensure that you’re choosing the right outgroup.
19. Scroll to the top of the page and click the Run Neighbor button.
Your results appear in a new page as a series of hyperlinks.
20. Open the consensus tree files.
The two first files on the output list are the consensus tree files. They’re
hyperlinked, so you can simply click them to display their contents.
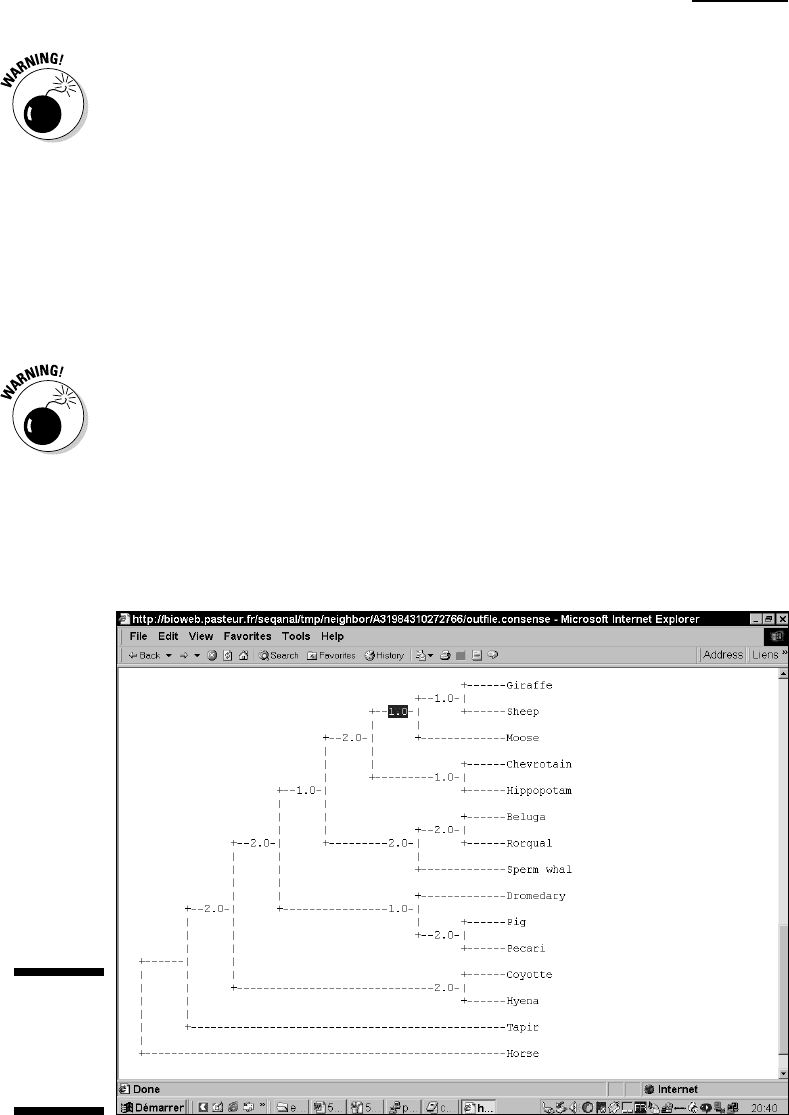
outfile.consense (see Figure 13-12) contains a text version of your
consensus phylogenetic tree.
The consensus tree is always unrooted. The number above each branch
indicates its stability, with 50 meaning more stable and 20 meaning less
stable.
outtree.consense is the same tree but in the Newick format.
21. Open the normal trees.
Neighbor also outputs the trees it used to build the consensus in
outfile and outtree.
Figure 13-12:
A con-
sensus tree
output by
Neighbor.
394
Part IV: Becoming a Specialist: Advanced Bioinformatics Techniques
20_089857 ch13.qxp 11/6/06 4:03 PM Page 394

• outfile contains a text representation of your trees. It contains
as many trees as you requested replicates for in Steps 8 and 16.
• If you checked Neighbor Joining in Step 12, the trees are rooted
with the outgroup.
• If you requested UPGMA, the trees have been automatically rooted.
•
outtree contains the trees in Newick format.
22. Save and re-display your output.
It is difficult to display a tree with bootstrap values using online tools.
If you want to keep these values, the best thing to do is to save the
outfile.consense file into a tree. (This is a standard text file that you
can save by using your browser’s File
➪Save As option.)
If you want to redisplay your tree using another graphic format, the
most convenient thing to do is to save the file
outtree.consense and
to turn it into a GIF or a PDF file with the Phylodendron server. (See the
last part of this section for more on how to do this.)
395
Chapter 13: Building Phylogenetic Trees
What is bootstrapping?
Just because your computer can produce a
tree doesn’t necessarily mean that the tree is
correct. Many things can go wrong in the tree’s
construction — including faulty data or an
incorrect alignment. In most cases, your tree
will be globally correct but contain a few inac-
curate branches. This is where
bootstrapping
comes in handy. Tree bootstrapping is a way to
check whether your tree is biologically mean-
ingful by assessing its
robustness
— that is,
checking whether every portion of the align-
ment equally supports your tree. The logic
behind bootstrapping is that you measure the
solidity of each branch in your tree so as to
determine whether you can trust it when you
draw your conclusions.
Bootstrapping is a multiple-step process. The
program starts by sampling columns in your ini-
tial alignment. The purpose is to generate a
bootstrap alignment
in which some columns are
missing and others are duplicated. Here’s how
it’s done:
1. Choose a column at random from the initial
multiple alignment obtained with your
sequences.
This column is the first column of your
boot-
strap alignment.
2. Select a new column in the initial align-
ment and copy it to extend the bootstrap
alignment.
By
extend
here, we mean making the align-
ment one column longer than the column
you just copied from the initial alignment.
3. Repeat Step 2 until your bootstrap align-
ment contains as many columns as your
initial alignment.
Note that some of the columns are either
never selected or appear several times in
the final bootstrap alignment. This is
random sampling.
(continued)
20_089857 ch13.qxp 11/6/06 4:03 PM Page 395

396
Part IV: Becoming a Specialist: Advanced Bioinformatics Techniques
For instance, here is how you could use an
initial alignment to generate two bootstrap
alignments:
Initial Alignment
Column 1 2 3 4 5 6 7 8 9
seq1
A B C D E F G H I
seq2
A A B B C B A C A
seq3
C C A C B A C A B
Bootstrap Alignment 1
1 1
8 1 2 5 1 8 2
A A H A B E A H B
A A C A B C A C A
C C A C C B C A C
Bootstrap Alignment 2
1
4 5 6 6 3 4 1 7
A D E F F C D A G
A B B C C B B A A
C C B A A A C C C
Note that the first bootstrap alignment contains
Column #1 of the initial alignment four times.
This procedure generates many multiple align-
ments that look more or less like the original.
The purpose of all this is to check whether all
the columns in your initial alignment tell a simi-
lar evolutionary story (that should be the case).
During the next step, each random alignment is
turned into a distance matrix, and each matrix
is turned into a tree. To build the consensus
tree, Phylip takes the average of all the trees it
has generated from the bootstrap alignments.
To assess the quality of each branch in the
consensus tree, Phylip counts the number of
bootstrap trees that contain this branch.
Good branches are those that appear in every
bootstrap tree. They are the ones on which you
can strap your swing!
Take a look at the consensus tree back in Figure
13-12. On this consensus tree, every branch
comes along with a number between 1 and 2.
This value tells you how solid your branch is.
This value falls between 1 and 2 because, in
Steps 8 and 15, we chose to have 2 bootstrap
cycles. Neighbor generated 2 bootstrap trees
with these 2 bootstrap alignments, and it gener-
ated a consensus tree that’s the average of
these 2 bootstrap trees.
In a tree, a branch always separates your data
into two groups: sequences on the left and
sequences on the right side of the branch. The
numbers above the branches in the consensus
tree indicate how many branches exist in your
two trees that split the data in exactly the same
way as the branch you’re looking at.
For instance, if you look at the consensus
tree in Figure 13-12, you find that the branch
containing giraffe and sheep has a value of only
1. The reason for this is that in one of the boot-
strap trees, giraffe and moose are in the same
group — while in the other tree, giraffe is in the
same group as sheep (and moose is alone). In
theory, you could conclude that the tree indi-
cates some uncertainty on whether sheep and
giraffe are more closely related to one another
than each is related to moose. In practice, how-
ever, with only 2 bootstraps, you really can’t say
anything of the kind! You need at least 100 boot-
strap cycles before you start convincing farm-
ers to breed giraffes for their wool.
(continued)
Making a maximum likelihood tree with PhyML
Maximum likelihood trees are considered to be more accurate than other trees
because they produce the tree that is most likely (statistically speaking) to
explain your alignment. In other words, your alignment is a little story that
explains how, starting from one ancestral sequence, a series of mutations
20_089857 ch13.qxp 11/6/06 4:03 PM Page 396
leads to all the observed diversity. Maximum likelihood is an attempt to
ensure that the tree and the alignment tell exactly the same story.
It used to be that maximum likelihood trees were restricted to small datasets
because they take too much time to compute. However, thanks to a recent
breakthrough by Olivier Gascuel and Stéphane Guindon (Montpelier
University, France) it is now possible to compute these trees in a much more
realistic amount of time. We show you below how to use their PhyML server.
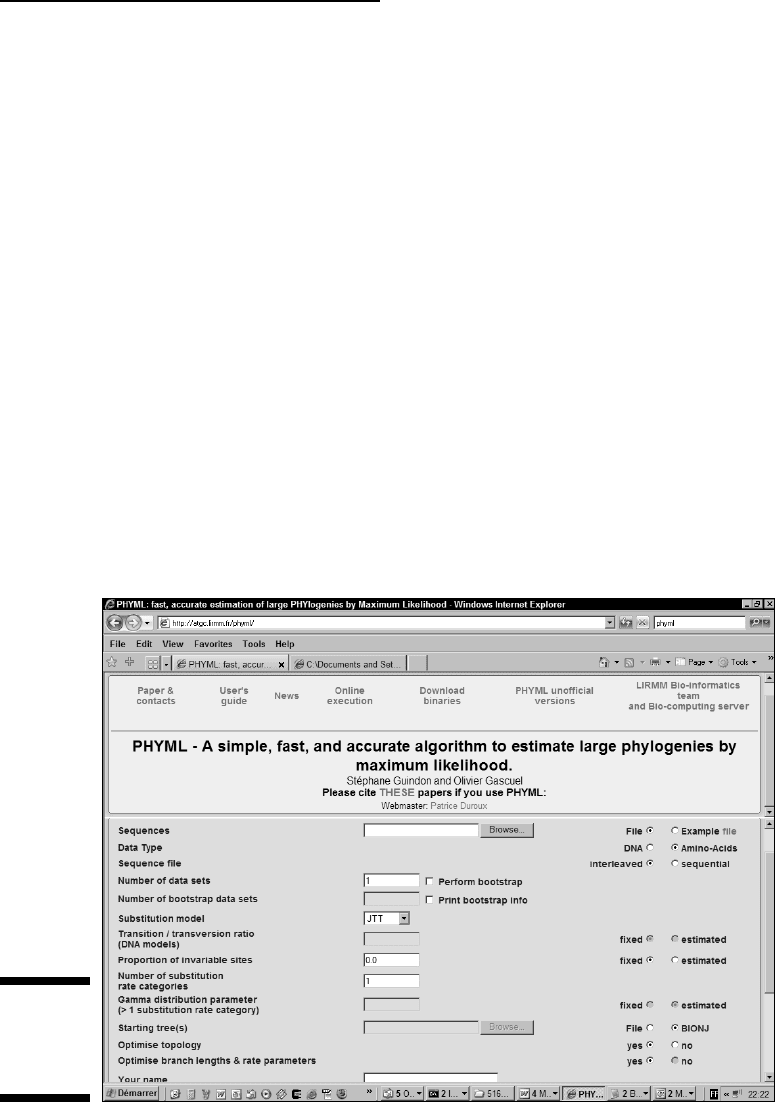
1. Open the dummy alignment at www.tcoffee.org/dummy_aln3.html.
This alignment is in Phylip format, the only format recognized by the
server.
2. Use the File➪Save As option of your browser to save the alignment as
a text file.
3. Point your browser to
atgc.lirmm.fr/phyml/.
4. Select the File radio button, as shown in Figure 13-13.
You can now upload your file with the Browse button.
5. Select the Amino Acids radio button.
Our alignment contains amino acids.
Figure 13-13:
Setting up
the PHYML
server.
397
Chapter 13: Building Phylogenetic Trees
20_089857 ch13.qxp 11/6/06 4:03 PM Page 397
6. Select the Interleaved radio button.
Our alignment is in Phyllips Interleaved. This simply means the align-
ment is split into blocks (see the Chapter 9 for explanations of the vari-
ous formats).
7. Check the Perform Bootstrap checkbox and then enter 100 in the
Number of Bootstrap Data Sets field.
Performing a bootstrap does take more time, but it is a crucial step if
you want to reliably estimate the biological meaning of your tree.
In practice, it’s better to require 1,000 bootstraps — but for this example
to run, we have set the value to 100.
8. Scroll down to fill in the Name and E-Mail Address fields.
9. Click Run.
When we did a trial run of this example, it took about half an hour for our
results to come via e-mail — so be prepared for a bit of a wait. When an
e-mail arrives, it contains a tree in Newick format that you can visualize using
Phylodendron (we explain how to do this later in this chapter.) The tree will
come with bootstrap values indicating how much trust you can have in each
node. The higher the bootstrap value, the more reliable the node.
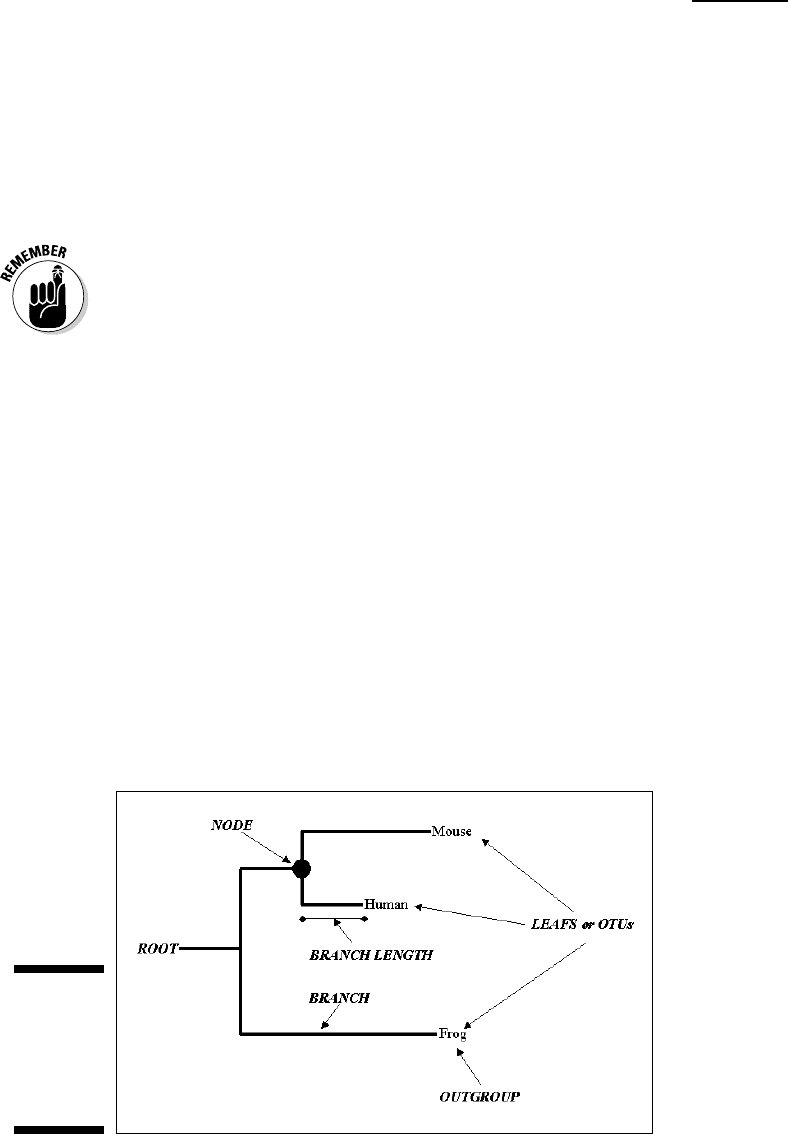
Knowing what’s what in your tree
When you work with phylogenetic trees, there’s always a bit of special vocab-
ulary involved. Figure 13-14 recapitulates the names of the various compo-
nents in your tree. Some of these names may sound a bit technical, but it’s
worth knowing their meaning because phylogenetic jargon is becoming more
and more common in mainstream publications.
Figure 13-14:
Various
components
of a
phylogenetic
tree.
398
Part IV: Becoming a Specialist: Advanced Bioinformatics Techniques
20_089857 ch13.qxp 11/6/06 4:03 PM Page 398

Leaves are known as OTUs (Operational Taxonomic Units). Each node repre-
sents an ancestral OTU. A
clade is a group of OTUs that includes several
sequences and their common ancestor nodes. The
root is the common ances-
tor of all the OTUs.
A
branch defines the relation between a clade or an OTU and the rest of the
tree. A tree can be
scaled (in which case the branch length means something
in terms of evolutionary time) or
unscaled (in which case only the topology of
the tree is informative).
The tree may be rooted or unrooted.
Unrooted trees do not identify evolution-
ary paths. If your tree is unrooted, you accept the possibility that any of the
nodes or OTUs could be closer to the common ancestor than to any of the
other OTUs. If you have an
outgroup, you know that the root must be inserted
in the branch between this outgroup and the other clades.
The root of a tree corresponds to the most ancient common ancestor. This
sounds good, but it is (unfortunately) meaningless in terms of the kinds of
trees we’re reconstructing here. The problem is that tree-reconstruction
methods have no way of telling the direction of evolution. They cannot be
used to determine where the most ancient node is. As a consequence, the
root you may observe on some trees is usually arbitrary — therefore mean-
ingless from a biological point of view. Biologists like to use what they call
unrooted trees, to avoid any confusion. Yet, if you need a root, the only
proper way to insert it into your tree is to use what gurus call an
outgroup —
an organism so distantly related to the others that it can safely be used as a
root. For instance, if you make a tree involving primates, you should include
the mouse (with the exception of Mickey Mouse, few mice are considered pri-
mates) so you can use it as an outgroup; likewise, if you are comparing mam-
mals, you should include a reptile, and so on.
Displaying your phylogenetic tree
Phylodendron is a powerful Web-based server that lets you turn a text file in
Newick format into a graphic display of your tree. You can control every
minute aspect of the display and generate images in any format you fancy. In
the following steps, we show you how to use Phylodendron to turn a phyloge-
netic tree into a GIF picture that you can include in any document:
1. Point your browser to iubio.bio.indiana.edu/treeapp/
treeprint-form.html
.
A similar service runs on the Spanish EMBnet node at www.es.embnet.
org/Doc/phylodendron/treeprint-form.html
.
2. Paste your tree in Newick format in the Input window.
399
Chapter 13: Building Phylogenetic Trees
20_089857 ch13.qxp 11/6/06 4:03 PM Page 399