Ekundayo E.O. Environmental monitoring
Подождите немного. Документ загружается.

Real-Time Monitoring of Volatile Organic Compounds in Hazardous Sites
231
The GPRS unit operates on the basis of a proprietary communication protocol over TCP/IP,
with DHCP. Dynamic re-connectivity strategies were implemented to provide an efficient
and reliable communication with the GSM base station. All the main communication
parameters like, IP address, IP port (server and client), APN, PIN code and logic ID can be
remotely controlled.
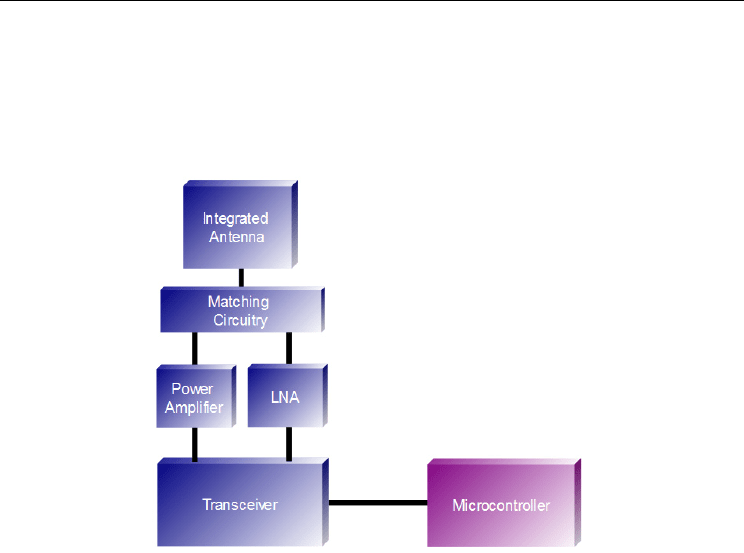
Fig. 5. Block diagram of the wireless interface
The system is based on an embedded architecture with high degree of integration among
the different subsystems. The unit is equipped with various interfaces including
LAN/Ethernet (IEEE 802.1) with TCP/UDP protocols, USB and RS485/RS422, in addition
to a wireless interface, which provides short range connectivity. The sensor acquisition
board is equipped with 8 analogue inputs, and 2 digital inputs. The SN unit is also
equipped with a Wireless Interface (WI), represented in Fig. 5, providing connectivity
with the EN units. The WI operates in the low-power, ISM UHF unlicensed band (868
MHz) with FSK modulation, featuring proprietary hardware and communication
protocols. Distinctive features of the unit are the integrated antenna, which is enclosed
in the box for improved ruggedness, and a PA and LNA for improved link budget.
The PA delivers some 17 dBm to the antenna, while the receiver Noise Figure was
reduced to some 3.5 dB, compared with the intrinsic 15 dB NF of the integrated
transceiver. As a matter of fact, a connectivity range in line-of-sight in excess of 500
meters was obtained.
This results in a reliable communication with low BER, even in hostile e.m. environments.
The energy required for the operation of the unit is provided by a 80 Ah primary source and
by a photovoltaic panel equipped with a smart voltage regulator. Owing to a careful low-
power design, the unit could be powered with a small (20 W) photovoltaic panel for
undiscontinued and unattended operation.
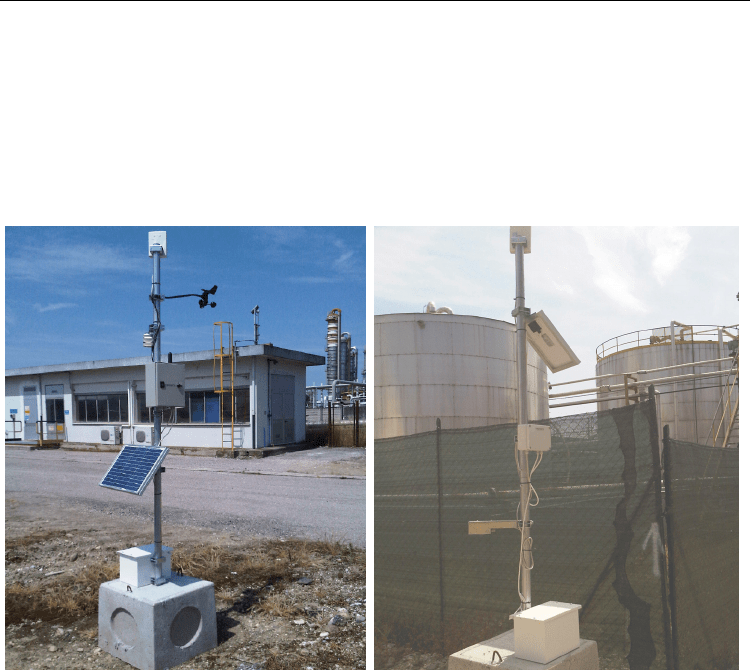
A picture of one of the SN unit installed at the Mantova plant is represented in Fig. 6, left.
The battery and photovoltaic panel are clearly visible; the GPRS unit is the grey box close to
Environmental Monitoring
232
the photovoltaic panel, and the WI is the white box on the top. The wind sensor and the
RHT sensor with the solar shield are also visible. A concrete plinth serves as base for the
unit, thus avoiding the need of excavations, which could be troublesome in the context of
the plant due to pollution and contamination issues.
A picture of an EN unit is represented in Fig. 6, right. The photovoltaic panel along with the
power supply and sensor board units are visible in the middle, while the VOC detector unit,
protected by a metallic enclosure, is visible at the bottom. Also in this case a concrete plinth
serves as the base for the unit.
Fig. 6. SN (left) and EN (right) units installed in proximity of the pipeline and of the
chemical plant
8.2 The EN unit
The block diagram of the EN is represented in Fig. 7; it consists of a WI, similar to that
previously described, and includes a VOC sensor board and a VOC detector. The WI unit is
visible on the pole-top. Additionally, that solution allows wired connectivity of multiple
VOC unit to the same EN, thus increasing modularity and flexibility of the architecture. The
acquisition/communication subsystem of the EN unit is based on an ARM Cortex-M3 32 bit
micro-controller, operating at 72 MHz, which provides the required computational
capability compatible with the limited power budget available.
To reduce the power requirement of the overall subsystem, two different power supplies
have been implemented, one for the micro-controller and one for the peripheral units;
accordingly, the microcontroller is able to connect/disconnect the peripheral units, thus
preserving the local energy resources. The VOC detector subsystem, in particular, is
powered by a dedicated switching voltage regulator; this provides a very stable and spike-
free energy source, as required for proper operation of the VOC detector itself.
Real-Time Monitoring of Volatile Organic Compounds in Hazardous Sites
233
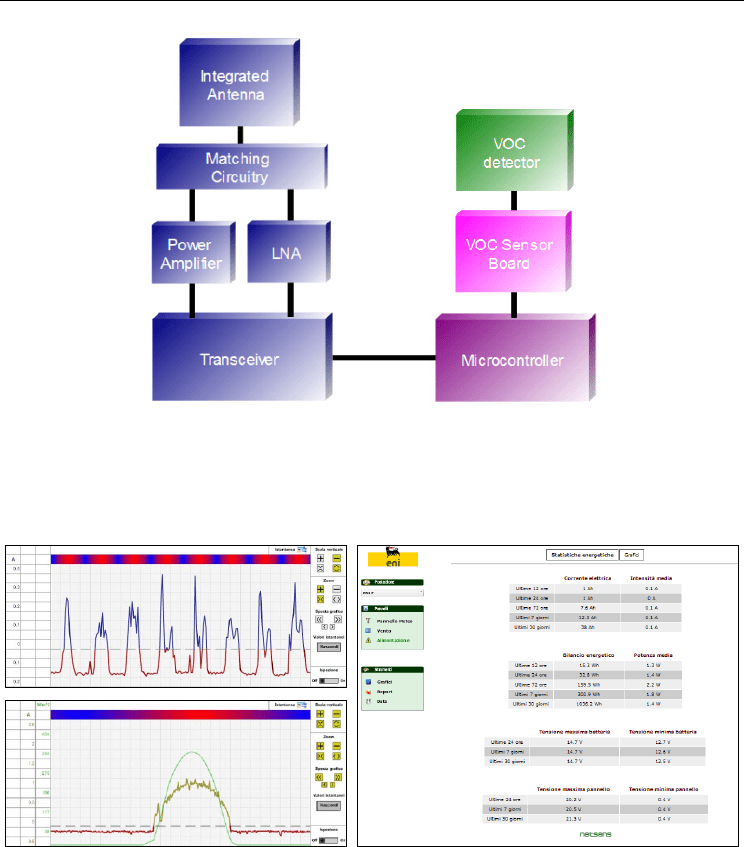
Fig. 7. Block diagram of the End Node Unit
The communication between EN unit and VOC detector board is based on a RS485 serial
interface, providing high immunity to interference and bidirectional communication
capability, as required for remote configuration/re-configuration of the unit.
Fig. 8. Energy balance of the photovoltaic subsystem
Thanks to the efficient communication protocols and effective power management
strategies, the EN unit has a battery life on some two months of continuous VOC detector
operation at 1 minute transmission data-rate, only relaying on primary energy resources.
The technologies described above allow for the implementation of monitoring procedures in
different ways, namely real-time sampling, continuous or discontinuous measurement, VOC
analysis with specific concentration of single compounds, to name a few.The secondary
energy source plays a key role in ensuring the stand-alone and unattended operation of the
sensor network infrastructure. The photovoltaic power supply unit includes a charge

Environmental Monitoring
234
regulator which was specifically designed to provide maximum energy transfer efficiency
from the panel to the battery under any operative condition. In Fig. 8 upper left, the weekly
graph of the power absorbed/generated by the photovoltaic power supply is represented;
the blue line represents the positive balance, i.e. the panel is charging the battery, while the
red line represents the negative balance, i.e. the primary source is supplying energy to the
subsystem. In Fig. 8, bottom left, a comparison between the current generated by the system
and the solar radiation under very clean daylight condition is presented; the right sheet
represents the energy budget statistics generated by the system for one of SN unit. In Fig. 8
right, a summary of the daily, weekly and monthly energy balance is represented; more
detailed analysis and diagnostics are available.
9. The VOC detector
The VOC detector obviously plays a key role for the real-time monitoring system; the main
requirements are listed in Table 1.
Operation mode Diffusion (no pumped)
Targeted gas VOCs IP> 10.6 eV
Concentration range (ppb) 2,5 to 5,000
Minimum Detectable Level (ppb) > 2,5
Sensitivity > 20 mV/ppm
Accuracy < 5% in the overall range
Linearity n.a.
VOC data sampling int. (minutes) < 15
Power consumption (mW) < 200
Stabilisation time from power-on T
90
(s) < 60
Warm-up time (s) < 60
Interval between services (days) > 120
Lifetime (years) > 5
Specificity to benzene typically broad band
Table 1. VOC detector requirements
Inspection of Table 1 shows very demanding requirements; an extensive analysis of the
state-of-the-art of VOC detectors available on the market was performed to identify the most
suitable technology. Different candidate technologies were considered, including Photo
Ionisation Detector (PID), Amperometric Sensors, Quartz Crystal Microbalance (QMC)
sensors, Fully Asymmetric Ion Mobility Spectrography (FAIMS) based on MEMS,
Electrochemical Sensors and Metal Oxide Semiconductor Sensors (MOSS).
It turned-out that PID technology fitted quite well to the requirements of Table I, and thus it
was elected as the basic technology to be used for this application. The device chosen for this
application was he Alphasense AH, which exhibits 5ppb (isobutylene) minimum detection
level.
Both theoretical and experimental investigations of PID operation were carried-out to assess
the technology. Two major issues were identified, capable of potentially affecting the use the
PID in our application; the first was that in the low ppb range the calibration curve of the
PID is non-linear; this would require an individual, accurate and multipoint calibration with
inherent cost and complexity; the second was that, when operated in diffusion mode at low
Real-Time Monitoring of Volatile Organic Compounds in Hazardous Sites
235
ppb and after a certain time of power-off, the detector requires a stabilisation time of several
minutes, thus preventing from operating it at minutes duty-cycles.
As for the calibration issue, a linearisation procedure was developed based on a behavioural
model of the PID
2
; accordingly, the voltage read-outs received by the detector, V
n
, are prior
preprocessed by multiplying with a non-linearity compensation factor, α(C), function of the
concentration C:
n
C
v
S
n
V)
n
C(=
cn
V
(1)
where V
cn
is the read-out corrected by the non-linearity compensation factor α, C
n
is the
concentration in ppm and V
n
is the nth read-out in mV, and S
v
is the PID sensitivity in
mV/ppm. Equation (1) shows that, after compensation, the values V
cn
can be easily mapped
in the corresponding concentration value.
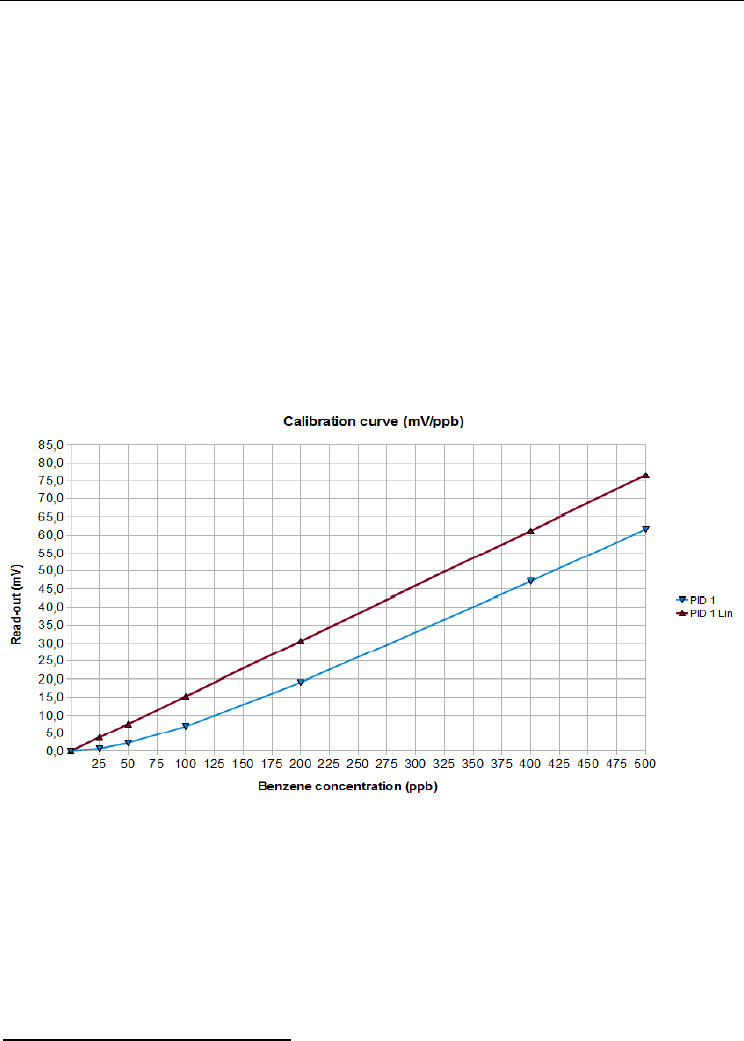
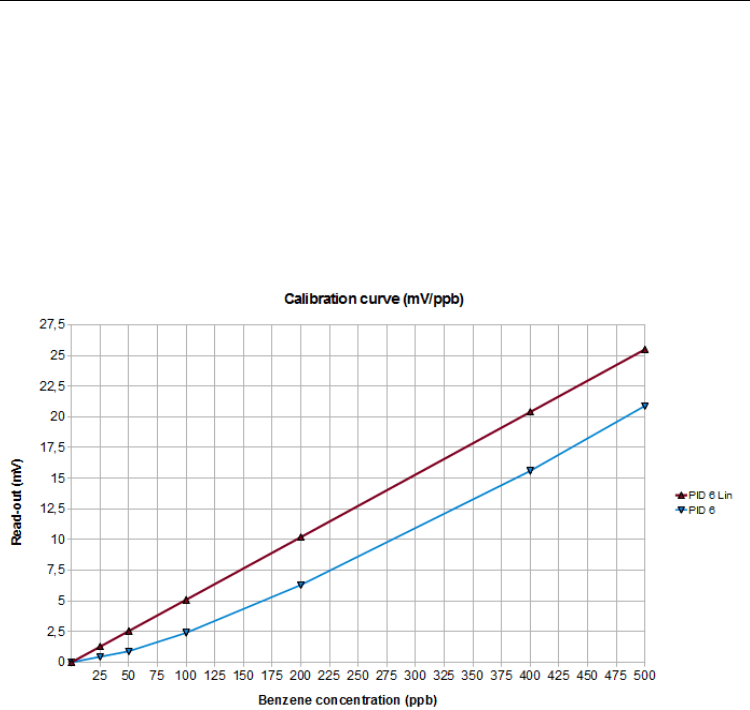
In Fig. 9 and 10 the linearised calibration curves in the range 0-500 ppb are presented for
two different PIDs. Fig. 9 represents the experimental calibration curve (read-out vs
concentration) of a PID with a relatively high sensitivity, 150 mV/ppm. The non-linearity in
the range 0-200 ppb is clearly observed, blue line.
Fig. 9. Calibration curves for a PID with high sensitivity before (blue) and after (red)
linearisation
The result of the linearisation process, according to the previously outlined procedure, is
represented by the red line. Fig. 10 represents the same as Fig. 9 for a PID with relatively
low sensitivity (50mV/ppm). In both cases, the linearisation procedure proved to be
effective. The main advantage of the described approach is that for performing the PID
calibration, one single parameter is needed, i.e. the value of the PID sensitivity, which is
measured at ppm concentrations; this makes much simpler and less costly the calibration
process.
2
GF Manes, unpublished results
Environmental Monitoring
236
As for the stabilisation time, several experiments were performed to qualify the PID
performance; it was found that at low concentration (tens or hundreds ppb), which
represents the area of operation of the VOC detectors in our application and when operated
in the diffusion mode, the PID exhibits a stabilisation time of some minutes after a power-
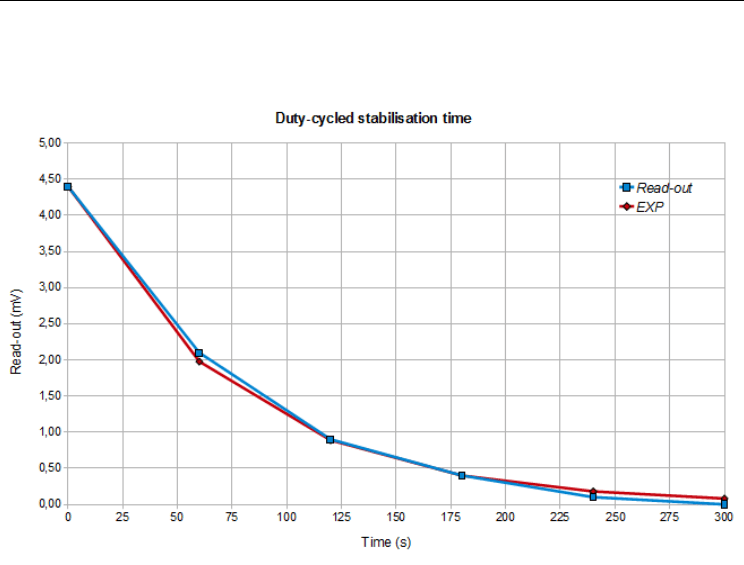
off/power-on cycle. A typical PID duty cycled response after storage is represented in Fig.
11. The experimental stabilisation curve is compared with a 80 s decay-time exponential
function showing an excellent fitting. After a warm-up of several hours the PID was
powered-off for 15 minutes and then powered-on again; thie sequence simulated a 15
minute sampling interval, which was the initial target of our application; in this experiment
ambient concentration was around 50 ppb, which represents the average concentration
where the PID is supposed to be set up.
Fig. 10.Calibration curves for a PID with low sensitivity before (blue) and after (red)
linearisation
As observed in Fig. 11, a 300 seconds stabilisation time is needed prior the PID can reach a
stable read-out value. This experiment shows that a 15 minutes sampling interval calls for a
5 minutes stabilisation time, thus resulting in some 30% duty-cycle. A duty-cycled
operation, as compared with a continuous power-on operation, is desirable in principle to
prolong both the battery- and lamp-life; however, the benefit of energy saving allowed for
by the 30% duty cycle is marginal, when compared with the advantage of achieving a more
time-intensive monitoring of VOC concentration, as provided by continuous power-on
operation. In terms of energy resources, continuous power-on operation requires some 35
mAh charge, which corresponds to 1 month of full operation with a 30 Ah primary energy
source; the corresponding power consumption of 360 mW@12 Vdc can be balanced using a 5
W photovoltaic panel.
The UV lamp expected life is more than 6000 hours of continuous operation; we expect at
least a quarterly service for the PIDs, due to environment contamination and related lamp
Real-Time Monitoring of Volatile Organic Compounds in Hazardous Sites
237
efficiency degradation. For those reasons it was decided to operate the PID in continuous
operation mode.
Fig. 11. PID stabilisation curve on duty-cycled power-on
10. Experimental results
Data from the field are forwarded to a central database for data storage and data rendering.
A rich and proactive user interface was implemented, in order to provide detailed graphical
data analysis and presentation of the relevant parameters, both in graphical and bi-
dimensional format. Data from the individual sensors deployed on the field can be directly
accessed and presented in various formats by addressing the appropriate sensor(s)
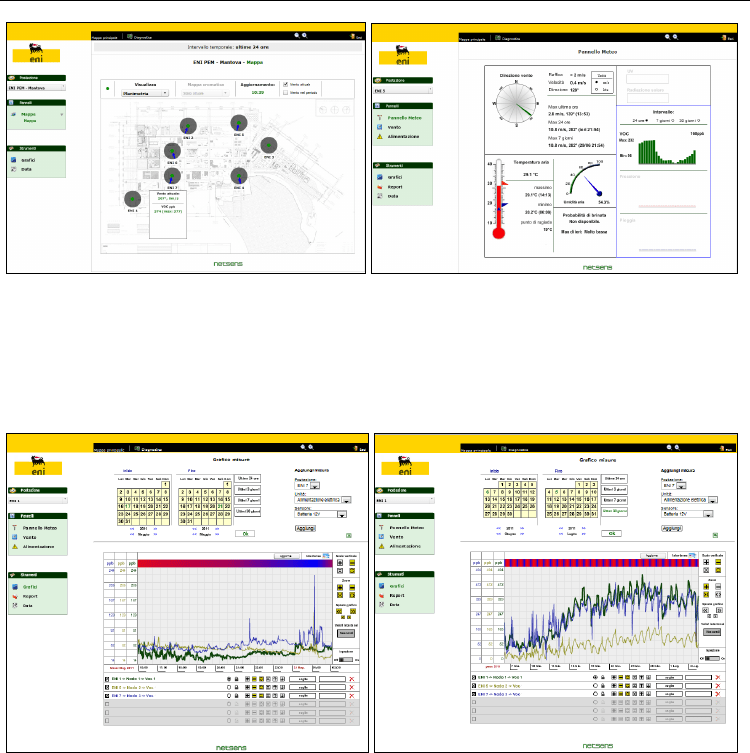
displayed on the plant map, see Fig 12 left.
The position of each SN and EN unit is displayed on the map; by positioning the mouse
pointer over the corresponding icon, a window opens showing a summary of current
parameter values.
A summary of the sensor status for each deployed unit can be obtained by opening the
summary panel, Fig. 12, right. The summary panel reports current air temperature/humidity
values, along with min/max values of the day (left lower, in Fig. 12), wind speed and direction
(left upper, in Fig. 12), and VOC concentration (right, in Fig. 12), in the last six hours. A
graphic representation of data gathered by each sensor on-the field can be obtained by
opening the graphic panel window, see Fig. 13.
The graphic panel allows anyone to display the stored data in any arbitrary time interval in
graphic format; up to six different and arbitrarily selected sensors can be represented in the
same graphic window for purpose of analysis and comparison.
Environmental Monitoring
238
Fig. 12. Plant lay-out and details of the sensors
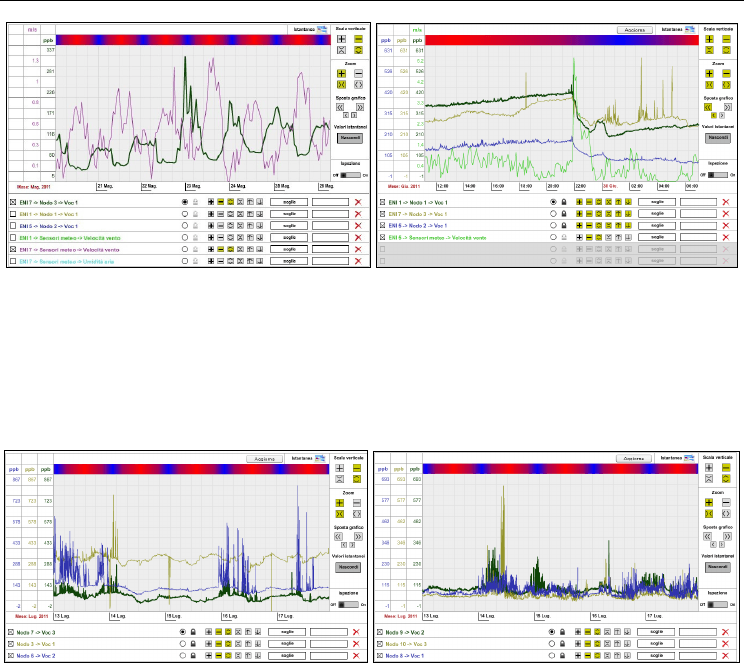
In Fig. 13 left, the VOC concentration traces of three different detectors are represented in a
period of one day; in Fig. 13 right, the same data are displayed in a period of 30 days. By
using the pointer, it is possible to select a time sub-interval and to obtain the corresponding
graphic representation at high resolution.
Fig. 13. Representation of sensor data in graphic format
In Fig. 13 left, the VOC concentration background is around 50 ppb; thanks to the very
intensive sample-interval, 1 minute, the evolution of the concentration in time, along with
other relevant meteo-climatic parameters can be very accurately displayed; it should be
noted that the spikes which can be observed in the blue trace, Fig. 13 left, have a duration of
some 3 minutes. The multi-trace graphic feature is very useful to perform correlation
between different parameters. In Fig. 14 two examples of correlation between WSD and
VOC concentration are shown. In Fig. 14 left, the VOC concentration, green line, exhibits a
night/day variation; this is compared with the wind speed, rosé line, which increases
during the day hours and decreases during the night hours, very likely due to the thermal
activity. As it can be observed, in fact, wind speed and VOC concentration are in phase
opposition, i.e. the greater the wind speed, the lower the average VOC concentration in the
plant, that is in good agreement with what one can expect.
Real-Time Monitoring of Volatile Organic Compounds in Hazardous Sites
239
Fig. 14. Correlation between wind speed and VOC concentration
The effect of a sudden wind speed increase, light green line, is shown on the right graph of
Fig. 14 right. It can be observed a wind speed increases to some 5m/s and more, green line,
around 10 pm; accordingly, the VOC concentration detected by the three PIDs deployed in
the plant is suddenly decreased. It should be noted that the three PIDs are located several
hundred meters far apart each other.
Fig. 15. Multi-trace read-outs of the six VOC sensors deployed around the ST40 plant
In Fig. 15, the read-outs of the 6 VOC sensors deployed around the ST40 plant are
represented; it should be noted the very good uniformity among the background
concentration levels demonstrating the effectiveness of the calibration procedure.
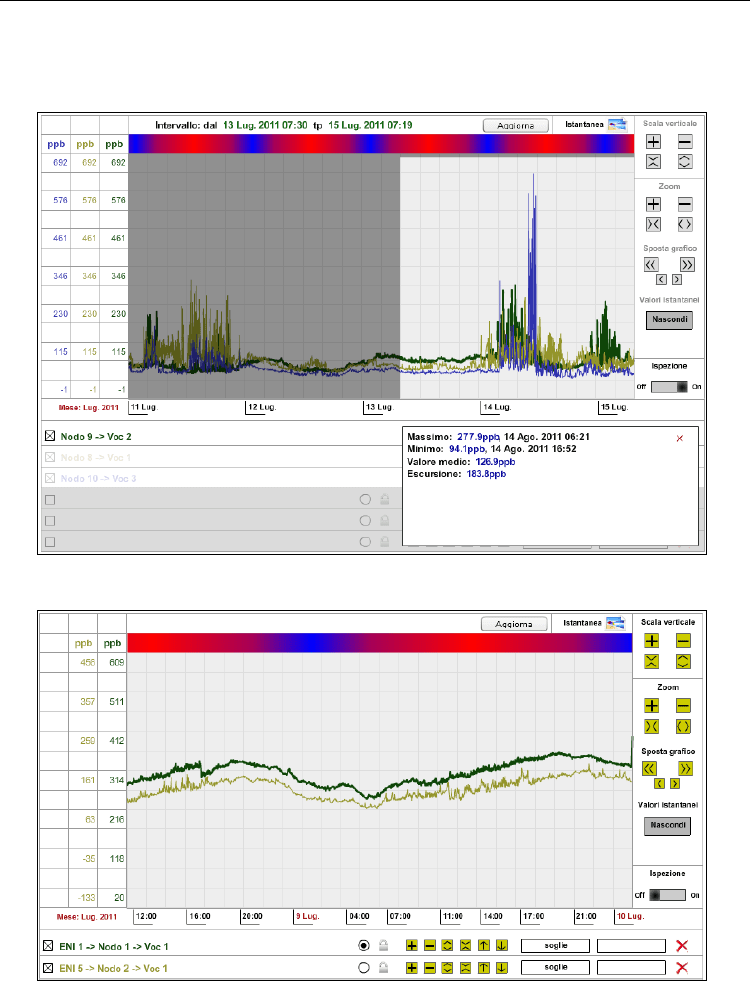
The user interface can perform various statistics on the data items; in the graphic panel, the
user can enter the inspection mode, see the button on the lower right in Fig. 16, and set an
user defined inspection window (in white); the window can be set over an arbitrary time
interval; parameters like max/min, arithmetic mean and maximum variation can be then
obtained for each of the sensor represented in the graphic window, lower right.
The sensitivity of the PID sensor is demonstrated in Fig. 17, where the traces of two different
PIDs are shown. The PIDs are located some 500 meters far apart. At the time of data
recording, there were some maintenance works going on in the plant’s area.
The VOC components due to maintenance works were detected by the PIDs and recorded as
small variation of the concentration around the mean value during the working hours (from
8 am to 6 pm, roughly), to be compared with the more smoothed traces recorded during the
night. A diagnostic panel is available to evaluate the system Quality of service (QoS) and the
gathered data reliability, see Fig. 18; connectivity statistics are displayed along with the
Environmental Monitoring
240
current status of connectivity for each of the SN and EN units. The status of the GPRS
connectivity and the related statistics are represented in column 3 and 6 from left,
respectively.
Fig. 16. Statistical parameters analysis
Fig. 17. Day/night VOC read-outs
As it can be observed, GPRS connectivity in excess of 99% is obtained, because of the periodic
restart of the SN unites which do not get connected for a short time interval, and thus reducing