Floud R., Johnson P. The Cambridge Economic History of Modern Britain, Volume 1: Industrialisation, 1700-1860
Подождите немного. Документ загружается.


British population during the ‘long’ eighteenth century 81
Table 3.6 Mortality within the first year of life in England, 1650–1837 (1,000 q
x
)
Days within the first year of life
0–29 30–59 60–89 90–179 180–273 274–365
1
q
0
Endogenous Exogenous
1650–99 107 17 11 22 15 15 176 88 88
1700–49 104 20 14 26 22 19 191 82 109
1750–99 75 17 11 26 23 18 160 57 103
1800–37 54 15 11 25 23 19 139 38 100
Notes:The rates shown are averages of two quarter-century periods (e.g. 1650–99 is the average of 1650–74 and
1675–99; the final period 1800–37 is the weighted average of 1800–24 and 1825–37, where the later period is
given half the weight of the earlier period). Rounding may give rise to apparent error, as in the endogenous/
exogenous split of
1
q
0
in 1800–37.
Source:Wrigley et al.1997: tab. 6.4, 226.
Overall childhood mortality (
15
q
0
)was 323 per 1,000 in 1650–99 and had
declined only modestly to 303 per 1,000 in 1750–99 (Wrigley et al.1997:
tab. 6.12, 256). In terms of model North the two are closely equivalent to
level 10 and level 11 with combined sex e
0
’s of 40.9 and 43.4 years respec-
tively. If childhood mortality were representative of mortality as a whole,
therefore, and were used to estimate overall life expectancy, there would
appear to have been only very limited improvement between the later
seventeenth and later eighteenth centuries, a very different conclusion
from that suggested by adult mortality. This comparison may be thought
misleading in that the phasing of change in childhood and adult mor-
tality was different. Childhood mortality was at its height in the quarter
century 1725–49 and declined further between the later eighteenth cen-
tury and the final parish register period 1800–37, but even between these
two periods the implied decline in overall mortality would only be that
from level 9 to level 12, or about seven years, perhaps half the peak to
trough fall implied by adult mortality.
Differential movement was not confined to the contrast between adult
and childhood mortality, for the pattern in childhood itself was far from
uniform. Table 3.6 shows how vivid was the contrast between the trend
in mortality during the first month of life and that in the remainder of
thefirst year. The former halved in the course of the long eighteenth cen-
tury; the latter rose somewhat at first but stabilised thereafter. Since the
distinction between endogenous and exogenous mortality is capturing a
similar phenomenon, the same pattern is visible in the trends in these
two measures (Wrigley et al.1997: 223–7).
Childhood mortality rates, shown in Table 3.7, display similar charac-
teristics to those within the first year of life, other than the first month.
Mortality in each of the three age groups either rose slightly or was un-
changed between the first and second periods but then declined between
thefirst and second halves of the eighteenth century, quite sharply in
the case of the age group 5–9. This age group also experienced a further
decline between the penultimate and last periods, but in early and late
childhood any further change was slight, a small fall in
4
q
1
,amodest rise
Cambridge Histories Online © Cambridge University Press, 2008

82 E. A. Wrigley
Table 3.7 Childhood mortality in England and the Princeton
model North life tables
Equivalent levels in model North
4
q
15
q
55
q
10 1
q
04
q
15
q
55
q
10
1650–99 109 48 27 8.5 11.3 11.0 10.6
1700–49 114 48 28 7.5 10.9 11.0 10.3
1750–99 108 38 24 9.2 11.5 13.0 11.6
1800–37 98 29 25 10.5 12.2 14.9 11.4
Notes:The rates shown are averages of two quarter-century periods (e.g.
1650–99 is the average of 1650–74 and 1675–99; the final period 1800–37 is
the weighted average of 1800–24 and 1825–37, where the later period is given
half the weight of the earlier period). The rates for
1
q
0
are set out in Table 3.6.
Source:Wrigley et al.1997: tab. 6.14, 262.
in
5
q
10
. The table also shows the equiv-
alent model North mortality levels for
each age group and period. For the
childhood age groups the model North
levels show a substantial internal consis-
tency, except that
5
q
5
drifts apart some-
what during the two final periods. Space
does not permit a fuller discussion of
this apparently aberrant development
here, nor the consideration of a com-
parison with the childhood rates in the
third English life table but both issues
are discussed at some length elsewhere
(Wrigley et al.1997: 255–61). In contrast, infant mortality was substantially
more severe than childhood mortality in model North terms but the gap
closed rapidly towards the end of the period as infant rates fell more
markedly than childhood rates.
Another way of characterising the changes shown in this section of
Table 3.7 would be to describe the move towards conformity with the
model North pattern as the result of the drastic fall in mortality in the
first month of life. As evidence of the fundamentally different fortunes
of children and adults, consider the following. At the mortality rates pre-
vailing in 1650–99, of 1,000 infants surviving the first month of life 761
would still be living on their fifteenth birthday, a figure which had im-
proved only marginally, to 778, in 1800–37. In contrast, at the mortality
rates which obtained in 1640–89, of 1,000 adults living on their 25th
birthday, only 419 would still be living at age 60, whereas in 1750–1809
the comparable figure had jumped to 561, a rise of more than one third.
During the long eighteenth century the striking fall in adult mortality,
combined with a significant decline in infant mortality, over a period
in which childhood rates changed very little, was gradually producing
a‘modern’ pattern in age-specific mortality which had been conspicu-
ously absent at the start of the period. Overall expectation of life at birth
wasimproving but the increase was modest because of the contrasting
fortunes of adults and children.
There are many other aspects of the mortality history of early modern
England which are of great interest. The seasonality of death in relation
to age, for example, can be explored effectively with family reconstitu-
tion data and is most instructive (Wrigley et al.1997: 322–43). Again,
there was a notable improvement in mortality in London during the
later eighteenth century (Landers 1993; Laxton and Williams 1989). Nor
was London alone in this regard. Many other English cities, like London,
had ceased to be demographic ‘sinks’ by the end of the century; birth
surpluses replaced the previous excess of deaths. The improvement was
not continuous, however, since the second quarter of the nineteenth
Cambridge Histories Online © Cambridge University Press, 2008

British population during the ‘long’ eighteenth century 83
Table 3.8 Maternal mortality rates (per 1,000 birth events)
1650–99 16.3
1700–49 12.9
1750–99 9.3
1800–37 5.8
Note:The rates shown are averages of two quarter-century periods (e.g.
1650–99 is the average of 1650–74 and 1675–99; the final period 1800–37 is
the weighted average of 1800–24 and 1825–37, where the later period is
given half the weight of the earlier period).
Source:Wrigley et al.1997: tab. 6.29, 313.
century saw widespread deterioration
in urban mortality as urban author-
ities failed to cope with the public
health problems associated with urban
life (Szreter and Mooney 1998). The fail-
ure of national expectation of life to
improve significantly over the first three-
quarters of the nineteenth century, how-
ever, is easily misinterpreted: it was due
in part to migratory movements which
resulted in a steadily rising fraction of the population living in the least
salubrious environments. Villages and small towns housed a steadily de-
clining share of the population, while the rapidly growing industrial and
commercial centres bulked larger and larger within the national whole.
It was therefore quite possible for expectation of life to improve in each
category of settlement and yet for there to be little change nationally
(Woods 1985, 2000: ch. 9).
Though space prevents a fuller consideration of these and many other
aspects of mortality in the long eighteenth century, one other set of
related topics demands consideration, sex differential mortality.
Perhaps the most dramatic development in any aspect of mortality dur-
ing the long eighteenth century was the fall in maternal mortality. Table
3.8 shows that maternal mortality fell by two thirds between 1650–99 and
1800–37, from 16.3 to 5.8 per 1,000 birth events. The remarkable nature of
the change is underlined by the fact that maternal mortality thereafter
stabilised throughout the balance of the nineteenth century, and indeed
had declined only very slightly by the outbreak of the Second World War.
In the five decades 1850–9 to 1890–9 the rate averaged 4.8 per 1,000; in
1910–19 it was 4.0, and as late as 1930–9 still 3.7 (Loudon 1992: app. 6,
tab. 1, 542–4). The proportionate fall in maternal mortality in the long
eighteenth century was similar to that in endogenous infant mortality
(from 88 to 38 per 1,000 birth events), and parallels the presumptive de-
cline in the stillbirth rate described above, a set of linked changes which
accord with expectation. The period immediately before birth, birth itself
and the period immediately after birth became radically less dangerous
to both mother and child during the long eighteenth century.
Asatisfactory explanation for the remarkable fall in maternal mortal-
ity is still to seek, but it is clear that it was not a phenomenon peculiar
to England. There is a striking similarity in both the level and trend
of maternal mortality in England and Sweden from the middle of the
eighteenth century onwards (Swedish data are available only from 1751
onwards). The same is true of rural France. In London maternal mortality
wassubstantially higher than in the country as a whole, but the trend
wasalmost identical (Schofield 1986: tab. 9.1, 238; Wrigley et al.1997:
fig. 6.22, 314).
Cambridge Histories Online © Cambridge University Press, 2008

84 E. A. Wrigley
The close interrelationship between maternal mortality, the stillbirth
rate and endogenous infant mortality illustrates another point worthy of
emphasis. Fertility, mortality and nuptiality are often treated as separate
topics, but they are always necessarily closely interlinked. It is entirely
arbitrary to treat life as beginning with parturition, for example. If con-
ception were regarded as the start of life, what appears as an increase
in fertility in the course of the eighteenth century would be treated as
afall in mortality, with fertility rates in all probability unchanged. Or
again, a rise in infant mortality, by causing the average length of birth
intervals to fall, will provoke a rise in marital fertility as conventionally
measured, yet the ‘true’ level of fertility may not have altered.
14
Such
examples could be multiplied almost indefinitely.
Maternal mortality was a major element in female mortality generally
during the peak years of childbearing in early modern England. With an
average birth interval of thirty months, for example, maternal mortality
as high as in the second half of the seventeenth century is equivalent
to annual death rate of 6–7 per 1,000, or over a five-year period to a
life table death rate of 30–5 per 1,000 (that is, of 1,000 married women
entering the period 30–5 would die from childbirth and its associated
hazards before its end). This was equivalent to roughly a third of all
deaths among married women in the age groups 25–39 in 1640–89, and
largely explains the excess of female deaths in these age groups visible
in Table 3.9. Although adult mortality in general declined substantially
during the long eighteenth century, the much sharper proportionate fall
in maternal mortality meant that it was a smaller element in female
mortality towards the end of the period than at its beginning.
The third English life table mortality rates in Table 3.9 show a far
smaller female disadvantage in the childbearing age groups than in the
reconstitution data for 1750–1809, but any direct comparison is mislead-
ing. The reconstitution data refer to married women only, given the na-
ture of the rules of observation which govern the derivation of such data,
whereas the third English life table refers to the whole female population.
The younger the age group, the higher the proportion of single women,
and single women experienced lower mortality since their exposure to
the risks of childbirth was far less than for married women. Appropri-
ately adjusted to take this point into account, the reconstitution death
rates in the age groups 25–39 and those in the third English life table are
closely similar. In the age groups above the age of 40, when childbirth
wasarapidly diminishing hazard, there is a good agreement between the
14
An infant death caused the cessation of breast feeding and brought about an early return
of ovulatory cycles. The average birth interval following an infant death was about eight
months shorter than the average following a child who survived. Where the mean interval
in the latter case was, say, thirty-two months and in the latter only twenty-four months,
therefore, a rise in infant mortality from 150 per 1,000 to 200 per 1,000 would reduce the
overall average birth interval from 30.8 to 30.4 months, ceteris paribus (Wrigley et al.1997:
tab. 7.35, 438–9).
Cambridge Histories Online © Cambridge University Press, 2008

British population during the ‘long’ eighteenth century 85
Table 3.9 Male and female adult mortality (1,000 q
x
)
Third English
1640–1809 1640–89 1750–1809 life table
(1) (2) (3) (4) (5) (6) (7) (8) (9) (10)
MFMFMFMF(1)/(2) (7)/(8)
25–9 39.1 74.8 50.9 99.1 25.8 73.4 46.7 49.0
30–4 55.3 79.0 60.3 92.6 37.2 70.5 51.5 53.6
35–9 71.6 89.0 85.5 111.3 57.8 67.1 58.1 58.7
40–4 84.1 83.8 90.9 95.6 68.5 68.0 67.5 64.9
45–9 106.1 95.7 114.8 114.8 99.0 77.5 80.8 72.8 111 111
50–4 127.5 110.6 154.4 126.6 116.3 83.3 101.0 87.1 115 116
55–9 182.6 139.7 216.3 189.0 133.1 113.0 130.1 116.6 131 112
60–4 203.3 189.3 221.8 232.6 182.8 160.0 176.9 165.7 107 107
65–9 259.0 267.7 286.3 310.3 222.1 254.5 246.8 240.9 97 102
70–4 387.1 374.4 454.9 406.5 372.7 380.0 355.7 348.7 103 102
75–9 469.3 476.0 492.7 555.3 423.9 451.8 489.3 477.3 99 103
80–4 609.7 596.4 537.2 766.0 643.5 556.2 626.2 615.9 102 102
Note:The original rates in the third English life table above the age of 50 understated the prevailing mortality rates because there was a marked
overstatement of age by the elderly in the censuses of 1841 and 1851. The rates shown in the table have been corrected to offset this source of
inaccuracy. Wrigley and Schofield 1989: 709–12, esp. tab. A14.3, 711.
Source:Wrigley et al.1997: tab. 6.26, 303.
reconstitution data for 1750–1809 and the third English life table. Outside
the years of childbearing the normal tendency for male mortality rates to
exceed female rates is clearly evident in the reconstitution data, as may
be seen in the ratios in columns 9 and 10 of Table 3.9. The pattern is more
regular in the third English life table since it was based on millions of
deaths in the period 1838–54, whereas the comparatively small number of
events in the parishes which provided data for the reconstitution exercise
wasinsufficient to suppress random variation. Nevertheless the general
similarity between the relative levels of male and female adult mortality
in the early modern period and in the mid-nineteenth century is clear.
Finally, it is instructive to consider sex differences in infant and child
as well as adult mortality. Table 3.10 shows that the ratio of male to
female rates for infants was stable over time and very close to the ratios to
be found in the model North and model West tables of Coale and Demeny
(which are extrapolated respectively from the mortality experience of
Scandinavian countries principally in the nineteenth century on the one
hand and advanced countries chiefly in the twentieth century on the
other: Coale and Demeny 1966: 12–14). There were many infant deaths
in the reconstitution parishes and these ratios are stable partly because
they are subject to little random variation. The same was not so true
of mortality later in childhood, when the absolute number of deaths
on which the rates were based was substantially smaller. Nevertheless
atendencyfor female mortality to worsen relative to male mortality
seems probable in the age group 1–4 and clear-cut for the age group
5–14, though it should be noted that the average pattern over the whole
Cambridge Histories Online © Cambridge University Press, 2008

86 E. A. Wrigley
Table 3.10 Male and female infant and child mortality (1,000 q
x
)
1
q
04
q
110
q
5
MFMFMF
1650–99 178.0 151.3 111.1 107.0 71.6 76.1
1700–49 201.2 177.5 115.8 113.1 76.2 73.0
1750–99 169.4 148.9 103.3 111.4 60.3 63.5
1800–37 148.0 128.4 97.5 99.8 48.5 57.2
Male/female ratios
1650–99 1.177 1.038 0.941
1700–49 1.134 1.024 1.044
1750–99 1.138 0.927 0.950
1800–37 1.153 0.977 0.848
Level 8 North 1.168 1.045 1.003
Level 8 West 1.163 1.001 0.916
Notes:The rates shown refer to legitimate births only. The rates shown for each half century are averages of the
two quarter centuries which comprise it (e.g. 1650–99 is the average of 1650–74 and 1675–99), except that the
rates shown for 1800–37 are derived by averaging 1800–24 and 1825–37 after giving double weight to 1800–24
relative to 1825–37.
Source:Wrigley et al.1997: tab. 6.22, 296 and tab. 6.23, 299.
period 1650–1837 is not dissimilar from the ratios to be found in the
model life tables. What might have caused the relative deterioration in
female childhood mortality?
Cause of death is very rarely mentioned in parish registers but was
amain concern of William Farr during the long period during which
he was Statistical Superintendant at the General Register Office. In 1861
respiratory tuberculosis claimed a steadily rising proportion of all deaths
in each successive age group from birth to adolescence in England and
Wales. The absolute rate for girls was higher than that for boys through-
out, and the disproportion rose with age so that in the age group 10–14
the ratewasalmost twice as high for girls as for boys. In that age group
respiratory tuberculosis caused 30 per cent of all female deaths, a pro-
portion which rose still higher to more than 50 per cent in the age group
15–19. Excluding deaths from respiratory tuberculosis, male rates in each
age group from 1 to 15 years of age were higher than female rates in
1861 (Preston et al. 1972: 224–7). Since the incidence of tuberculosis was
already declining sharply in 1861, it is likely that rates were even higher
early in the nineteenth century. Assuming that the rates were rising dur-
ing the eighteenth century, it may well be that the proximate cause of
theincreasing sex differential in childhood mortality visible in Table 3.10
wasthe differentially severe impact of respiratory tuberculosis upon the
health of young girls. As with most such issues, of course, establishing
theproximate cause of a particular feature may be only a first step to-
wards providing a fuller explanation. Further work on this issue might
prove illuminating.
Cambridge Histories Online © Cambridge University Press, 2008

British population during the ‘long’ eighteenth century 87
LOPSIDED GROWTH
Although fertility, mortality and nuptiality necessarily form the core of
adescription of the population history of Britain in the long eighteenth
century, to regard the story as consisting solely of the development of
these three variables and their interrelationships would be to overlook
some of the most interesting and thought-provoking aspects of the pop-
ulation history of the period. The rapid increase of population which
occurred was not the result of proportionate growth in all types of eco-
nomic activity or categories of settlement.
Proportionate growth may take either an extensive or an intensive
form. When, as may happen in lands of new settlement, population
growth is rapid because new areas are taken into cultivation, the re-
sulting expansion consists essentially of replicating an existing pattern
over a larger and larger area; in short, extensive growth. In a long-settled
territory proportionate growth may also be possible for a time, perhaps
following the pattern which Geertz described as agricultural involution,
amoreandmoreintensive use of an unchanging area of farming land
without significant structural change, though growth of this kind is apt
to be accompanied by increasing immiseration (Geertz 1963a: 33). Geertz
had in mind wet rice cultivation but his model is also applicable, for ex-
ample, to the cultivation of the potato in Ireland in the century preceding
thefamine. Ricardo identified the implications of this type of intensive
growth when developing the concept of decreasing marginal returns to
land and labour (Ricardo 1951 [1817]: 120–7, esp. 125–6). This type of inten-
sive growth might also be termed balanced. Much the same percentage
of the labour force is engaged in each major type of economic activity
at the end of a period of intensive growth of this kind as was involved
at its beginning. But intensive growth can also be unbalanced, or lop-
sided, as in early modern England: and such growth may long escape the
drawbacks of balanced growth, even within the constraints imposed by
an organic economy. (Wrigley (1988) develops the concept of an organic
economy.)
The long eighteenth century saw, towards its end, the early stages of
a fundamental change in the economic constitution of society, a change
which has come to be termed the industrial revolution; but the bulk
of the growth and change during the long eighteenth century is bet-
tercharacterised as ‘Smithian’ growth than as a foretaste of the indus-
trial revolution; growth, that is, arising from the interrelated benefits
associated with growing market size, improved transport, better com-
mercial facilities, increasing working capital and the division of labour.
Such growth caused profound change in many aspects of economic life in
England, as it had done previously in the Netherlands, and the change is
readily visible in the secondary population characteristics of the period.
Cambridge Histories Online © Cambridge University Press, 2008

88 E. A. Wrigley
Table 3.11 Percentage of total population living in towns with
5,000 or more inhabitants
England France The Netherlands
1600 8 9 29
1700 17 11 39
1750 21 10 35
1800 28 11 33
1850 45 19 39
Sources:Wrigley 1987c: tab. 7.2, 162; tab. 7.8, 182; tab. 7.9, 184–5: Bairoch
1988: tab. 13.4, 221.
Twosuch changes in particular deserve
attention: those in occupational struc-
ture and in the urban share of total
population.
It is a major handicap to tracing the
course of development in the long eigh-
teenth century that information about
thechanging occupational structure of
the country is as yet so sparse. It is there-
fore hazardous to provide a sketch of
such change, yet impossible to resist the
temptation to attempt it. We are better served with information about
urban development. These two aspects of population structure are neces-
sarily closely connected and may conveniently be treated together.
In Elizabethan times it is clear that England was less urbanised than
continental Europe as a whole, and substantially less urbanised than
those parts of Europe which were economically the most advanced: north-
ern Italy, the Rhine corridor and the Low Countries. It is highly likely that
agriculture dominated the occupational structure of the country at least
as completely as was the case beyond the Channel, though this asser-
tion is less easy to substantiate with reliable data than the comparable
point about urbanisation. It is probable that at least three-quarters of
the labour force was engaged in agriculture. Early in the nineteenth cen-
tury England became the most urbanised country in western Europe. A
far smaller proportion of its labour force worked on the land than on
the continent, even though the country remained largely self-sufficient
in food (Jones 1981; Thomas 1985: tab. 2, 743). Much of this profound
transformation took place in the long eighteenth century.
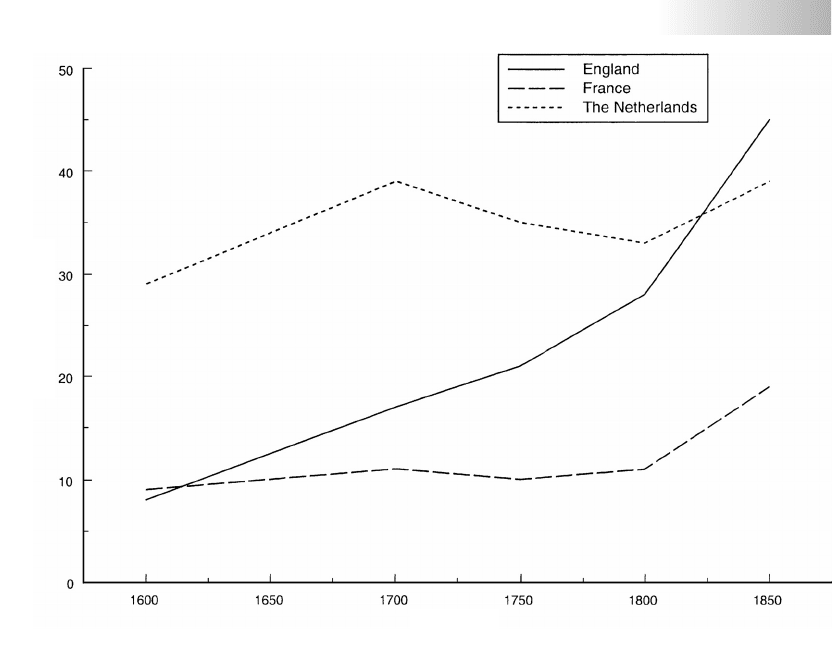
Before considering the implications of urban growth and a changing
occupational structure, an attempt to quantify the scale of the changes in
question is appropriate. Table 3.11 and Figure 3.8 show the percentage of
thepopulation which was urban in England, France and the Netherlands
from 1600 to 1850.
15
The Netherlands was the most advanced economy
in Europe from the mid-sixteenth century until the early eighteenth cen-
tury. The pattern of urban growth in France was typical of that of con-
tinental Europe as a whole throughout this period (Wrigley 1987c: tabs.
7.5and 7.9, 176, 184–5). These two countries, therefore, form suitable
comparitors for England during the long eighteenth century. The con-
trasts between the three countries are striking. The Netherlands was far
15
Urban populations are defined as those living in towns with 5,000 or more inhabitants. Any
division between urban and rural is bound to be arbitrary and will prove unsatisfactory
for somepurposes. In many contexts setting the dividing line at 5,000 inhabitants would
appear inconveniently high. Its advantage in this context is that there were few towns of
this size in which agricultural employment was other than trivially small as a fraction of
the labour force.
Cambridge Histories Online © Cambridge University Press, 2008
British population during the ‘long’ eighteenth century 89
Year
Percentage urban
Figure 3.8 Urban growth in England, France and the Netherlands
Notes:The urban proportion was taken as the percentage of the total population living in
towns with 5,000 or more inhabitants.
Sources:Wrigley 1987c: tab. 7.2, 162; tab. 7.8, 182; tab. 7.9, 184–5: Bairoch 1988: tab. 13.4,
221.
more urbanised than England or France in 1600, the two latter being
roughly on a par with each other at that date. Urbanisation continued
in the Netherlands during the seventeenth century and was gathering
momentum in England, but in the following century declined in the for-
mer while continuing strongly in the latter. By 1850 the position in the
Netherlands was little different from that in 1700, whereas growth had
continued unabated in England. Meanwhile in France there was no signif-
icant change from the initial level of urbanisation until after 1800, and
in 1850 France was still much less urbanised than the Netherlands had
been in 1600, having reached a level similar to that reached in England
acentury earlier.
The truly exceptional character of the surge of urbanisation in England
in the eighteenth century is only partially apparent from Figure 3.8.
Urban growth became widespread throughout western Europe in the
first half of the nineteenth century, but in the preceding century it was
Cambridge Histories Online © Cambridge University Press, 2008

90 E. A. Wrigley
concentrated to an astonishing degree in England alone. If the ‘net’ gain
in urban population between any two dates is defined as the number by
which the urban population exceeded that which would have obtained
if the urban percentage had not changed in the interim, then England
alone accounted for 57 per cent of the net gain in urban population in
western Europe as a whole in the first half of the eighteenth century
and as much as 70 per cent in the second half (Wrigley 1987c: 177–80,
esp. tab. 7.7, 179). Since even in 1800 England contained such a small
fraction of the population of Europe, this degree of concentration is ex-
traordinary. Urban growth in England was not only radically different in
scale from urban growth elsewhere in the long eighteenth century, it was
also very different in character. In England only four of the ten largest
towns in 1670 were still in the top ten in 1801. London was, of course, al-
ways the largest city. In 1670 it was followed by Norwich, Bristol, York and
Newcastle. Of these four, only Bristol, Newcastle and Norwich survived in
thetop ten in 1801, when they were respectively fifth, ninth and tenth. All
the others inthelistwere newcomers. Manchester, Liverpool and Birming-
ham were second, third and fourth, with Leeds, Sheffield and Plymouth
occupying the other places. The equally meteoric rise of Glasgow ensured
that the Scottish experience paralleled that of England in the eighteenth
century. In France, in contrast, eight of the ten cities which formed the
topten in 1650 were still there in 1800, and the two which had disap-
peared in 1800 had been eighth and tenth in 1650 (Wrigley 1987c: tab. 7.1,
160–1; de Vries 1984: app. 1, 273–5). The French experience was common
throughout the continent. The urban hierarchy was radically revised in
England far earlier than in other European countries. It is also notewor-
thythat, although London was always by far the biggest city in England,
during the long eighteenth century it grew little faster than the pop-
ulation of the country as a whole. London held about 9.5 per cent of
thenational total in 1670 and 11 per cent in 1801, whereas other urban
centres expanded spectacularly from 4.0 to 16.5 per cent of the national
total over the same period (Wrigley 1987c: tab. 7.2, 162).
Given the scale of urban growth, it is hardly surprising that there were
also major changes in occupational structure in early modern England.
Until the nineteenth century the available information about this aspect
of economic life is limited and frequently either difficult to interpret with
confidence or subject to wide margins of error. Some things, however, are
clear. In 1800 a much lower percentage of the labour force was working on
theland in England than anywhere else in Europe, with the exception of
theLow Countries. It is probable that the absolute size of the agricultural
labour force changed very little between 1600 and 1800. Since population
wasrising fast, this implies a major fall in the proportion of the workforce
on the land, from perhaps 70 per cent in 1600 to about 55 per cent in
1700 and close to 40 per cent in 1800. By 1851 agriculture employed less
than 25 per cent of the male labour force (Wrigley 1987c: tab. 7.4, 170;
Cambridge Histories Online © Cambridge University Press, 2008