Floud R., Johnson P. The Cambridge Economic History of Modern Britain, Volume 1: Industrialisation, 1700-1860
Подождите немного. Документ загружается.

British population during the ‘long’ eighteenth century 61
Figure 3.1 English
population totals,
1681–1841
Source:Wrigley
et al. 1997:
tab. A9.1, 614–15.
Farr, Brownlee, Griffith and Ohlin, writing at intervals over a period of
150years from 1801 to 1955, differed only modestly in their estimates
(Wrigley and Schofield 1989: app. 5, 563–87).
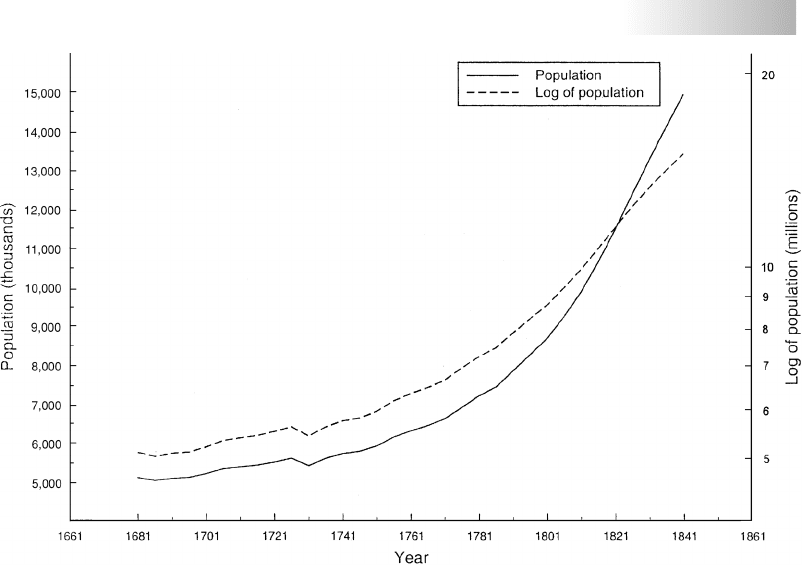
Recent decades have seen both the development of new techniques of
analysis and the construction of new data series. Figure 3.1 shows the
estimates of total population for the period 1681to 1841 produced by the
application of the technique of generalised inverse projection to national
totals of births and deaths derived until 1837 from aggregated baptism
and burial totals taken from the registers of 404 Anglican parishes, and
thereafter from the Registrar-General’s returns of births and deaths. The
rawtotals drawn from Anglican registers were extensively modified to
take account of deficiencies in the original data; of the problems associ-
ated with the unrepresentative character of the sample of parishes; and of
thepresence of rising numbers of nonconformists. Further modifications
were made to take advantage of the information contained in the early
censuses and of the findings of family reconstitution studies, before the
resulting totals were inflated by a multiple intended to produce national
estimates from the sample data (Wrigley and Schofield 1989: chs. 3–5).
6
The figure plots the data both naturally and logarithmically: the latter
enables changes in the rate of growth to be appreciated more easily.
6
These totals were in turn modified slightly after the analysis of data from a total of twenty-
six family reconstitution exercises had suggested that some of the assumptions made earlier
could be improved (Wrigley et al.1997: 520–31).
Cambridge Histories Online © Cambridge University Press, 2008

62 E. A. Wrigley
Agreement among those working on English population history in
theeighteenth century did not extend beyond population totals and the
phasing of population growth. There was no lasting consensus over the
related question of the relative importance of changes in mortality and
fertility in bringing about the growth which occurred. The dominant
view until the later decades of the twentieth century was that falling
mortality accounted for the bulk of the change. Griffith, for example,
wrote in 1926: ‘As the primary cause of the increase in the population in
this period, therefore, we are confrontedbyaremarkable decrease in the
death rate, which must be the main cause, backed up by a birth rate at a
level distinctly above the death rate and rising steadily, except for 1760,
from 1710 to 1790’ (Griffith 1926: 42). A belief that mortality change was
thekey variable was sustained also by the example of Sweden. Sundbärg’s
work had made available detailed and authoritative information about
Swedish population characteristics from the mid-eighteenth century on-
wards (Sundbärg 1907). The acceleration in the rate of growth of the
Swedish population in the nineteenth century was almost exclusively a
function of reduced mortality: fertility remained relatively high and in-
variant for many decades after death rates had begun to decline. In the
absence of equally secure data for other countries, it was natural to sup-
pose that this was the normal pattern. The prevailing view began to be
questioned in the 1950s, initially by Habakkuk, but then in quick succes-
sion also by Ohlin and Krause, but the issue was impossible to resolve
with certainty for lack of an appropriate technique for deriving detailed
and dependable estimates of fertility and mortality from parish register
data (Habakkuk 1953; Ohlin 1955; Krause 1958).
The basic difficulty is easily described but proved hard to overcome.
Most standard measures of fertility and mortality require knowledge of
thesize of the population at risk and of the incidence of a particular type
of event. To gain insight into marital fertility by constructing age-specific
marital fertility rates, for example, it is necessary to obtain information
about, say, the number of married women aged 25–9 and the number of
children born to women in this age group in a defined period of time,
and to secure similar data for all the other child-bearing age groups.
The census normally provides information of the first type, vital registra-
tion information of the second. In England parish registers, since they
record baptisms, marriages and burials, are capable of providing the close
equivalent of vital registration from their inception in 1538, but the first
census was not taken until 1801. Although the church, because of its
interest in establishing the number of Anglican communicants and the
scale of dissent, and the state, in order to raise taxes more efficiently or to
assess the number of men capable of bearing arms, sometimes collected
information which can be exploited to provide approximate estimates of
population totals, there is no data source before the nineteenth-century
censuses which routinely yields tolerably accurate estimates of numbers
at risk to complement the information which the parish registers can
Cambridge Histories Online © Cambridge University Press, 2008

British population during the ‘long’ eighteenth century 63
provide about totals of events. This is true of estimates of overall popu-
lation totals, and true afortiori of subdivisions of the population, such
as totals by five-year age groups. This appeared to represent an impasse
which was beyond resolution. It seemed impossible to determine such
questions as the relative importance of fertility and mortality in causing
the surge in population growth in the long eighteenth century, except
by making assumptions which, in effect, preordained the answers.
The situation was transformed by two advances in technique, each of
which makes it possible to secure detailed demographic measures from
vital registration alone. These were family reconstitution and generalised
inverse projection (GIP). The first was deployed to great effect by French
scholars in the 1950s and 1960s, though it had been foreshadowed ear-
lier in Scandinavia, and has subsequently been widely employed wher-
ever suitable parish registers exist (Edin 1915; Hyrenius 1942; Henry 1956;
Gautier and Henry 1958; see also Terrisse 1975). The second stemmed from
thepioneering work of Lee in 1974 but was greatly extended, refined and
generalised by Oeppen (Lee 1974; Oeppen 1993a, 1993b). Family reconsti-
tution, as the name suggests, is genealogical in nature but focuses on a
whole community rather than on a lineage. It produces reliable results
only when the nominal record linkage procedures employed are rigor-
ous, and when the periods of time during which a family can be taken
to be ‘in observation’ for a given type of demographic measurement are
defined in such a way as to eliminate bias from the result. It was Henry’s
achievement in providing appropriate rules for defining periods of ob-
servation which transformed family reconstitution into a major research
tool (Fleury and Henry 1956).
Whereas family reconstitution is based on linking records, GIP de-
pends on counting them. The heavy labour still involved in the former,
even though many of the operations involved have been computerised,
has meant that only small populations can be tackled, characteristically
consisting of a single parish or small group of parishes. GIP, in contrast,
needs only annual totals of births and deaths preceding an accurate cen-
sus, and it is no more onerous to process annual totals numbering hun-
dreds of thousands than totals numbering hundreds only. Space does not
permit a detailed description of either technique, nor of the tests needed
to establish the suitability of a given data source. Both techniques may, in
certain circumstances, give rise to bias or distortion in the hands of the
unwary, but since the issues involved are complex and have been discus-
sed extensively elsewhere, it is otiose to rehearse them in this chapter.
7
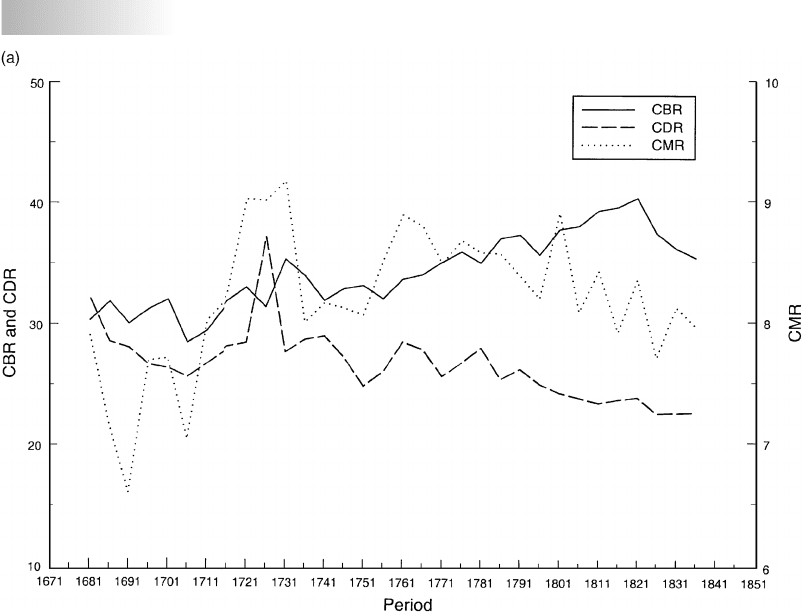
Table 3.1 and Figure 3.2 provide an overview of population change
during the long eighteenth century. They display the results produced
by theapplication of GIP to annual totals of births and deaths. Table 3.1
provides population totals at five-year intervals and estimates of crude
7
In relation to aggregative methods see Wrigley and Schofield 1989: xiii–xxx; Goldstone 1986;
Henry and Blanchet 1983; Lee 1985; Mokyr 1983. In relation to family reconstitution see
Razzell 1993 and 1994; Ruggles 1992; Wrigley 1994 and 1997; Rogers 1988; Desjardins 1995.
Cambridge Histories Online © Cambridge University Press, 2008

64 E. A. Wrigley
Table 3.1 Quinquennial demographic data: population totals, fertility and mortality data, intrinsic
growth rates and dependency ratio
Year Pop. (000s) CBR CDR CMR GRR e
0
IGR DR
1681 5109 30.32 32.14 7.91 2.03 31.27 −0.26 642
1686 5036 31.87 28.56 7.17 2.23 35.93 0.47 644
1691 5094 30.05 28.06 6.61 2.16 36.35 0.42 678
1696 5118 31.25 26.67 7.70 2.27 38.06 0.71 711
1701 5211 32.06 26.39 7.72 2.34 38.47 0.83 740
1706 5334 28.48 25.67 7.05 2.07 38.50 0.45 754
1711 5382 29.47 26.77 8.03 2.09 36.89 0.34 741
1716 5428 31.65 27.91 8.21 2.19 35.75 0.38 716
1721 550332.80 28.21 9.01 2.22 35.49 0.39 676
17265602 31.16 36.99 9.00 2.05 25.34 −0.95 689
1731 5414 35.13 27.46 9.16 2.30 36.34 0.58 647
1736 559933.79 28.47 7.99 2.28 35.26 0.46 671
1741 5723 31.71 28.78 8.15 2.18 34.27 0.24 689
1746 578232.68 27.02 8.11 2.30 36.47 0.62 723
17515922 32.97 24.61 8.05 2.37 39.77 0.99 714
1756 614931.87 25.82 8.50 2.27 38.12 0.75 727
1761 6310 33.48 28.29 8.88 2.34 35.37 0.61 749
1766 6449 33.88 27.69 8.79 2.33 36.19 0.68 754
1771 6623 34.90 25.47 8.48 2.38 39.09 1.01 736
1776 6913 35.76 26.57 8.67 2.44 37.74 0.99 756
1781 7206 34.86 27.81 8.57 2.40 35.81 0.76 776
17867434 36.89 25.23 8.56 2.56 38.97 1.25 767
1791 7846 37.17 26.07 8.38 2.60 37.92 1.22 762
17968256 35.51 24.82 8.19 2.49 38.93 1.15 782
1801 8671 37.60 24.08 8.90 2.64 40.02 1.43 798
1806 9232 37.90 23.68 8.08 2.67 40.58 1.52 800
1811 9864 39.18 23.25 8.42 2.77 41.25 1.69 810
1816 10,628 39.48 23.54 7.91 2.81 40.84 1.70 844
1821 11,457 40.22 23.73 8.35 2.88 40.47 1.75 850
1826 12,374 37.30 22.40 7.70 2.66 41.43 1.56 857
1831 13,254 36.03 22.43 8.12 2.53 40.89 1.36 836
1836 14,100 35.27 22.47 7.96 2.43 40.56 1.19 808
1841 14,937
Notes:The population totals refer to the year shown in col. 1. All other data refer to a five-year period beginning at
the date shown: thus the CMR for 1681–5 is 7.91 per 1,000. Key to table headings: CBR, CDR, CMR, crude birth,
death and marriage rates per 1,000; GRR, gross reproduction rate; e
0
, expectation of life at birth in years; IGR,
intrinsic growth rate (per cent per annum); DR, dependency ratio (1,000 × ((0 − 14 + 60 and over)/15–59)).
Source:Wrigley et al.1997: tab. A9.1, 614–15.
birth, marriage and death rates, the gross reproduction rate,
8
expectation
of life at birth, the intrinsic growth rate, and the dependency ratio for
8
This rate measures the average number of children who would be born to a woman during
her lifetime if she survived to the end of the childbearing period and experienced the aver-
age age-specific rates prevailing in a given period of time (or in the case of the equivalent
cohort measure, the average age-specific rates experienced by a given cohort).
Cambridge Histories Online © Cambridge University Press, 2008

British population during the ‘long’ eighteenth century 65
five-year periods between 1681 and 1841. Figure 3.2 plots the same data
in graphical form, except for the population totals (see Figure 3.1).
During the 160 years from 1681 to 1841 the English population almost
trebled in size from 5.1 to 14.9 million. Overall, this represents a moderate
rate of growth of 0.67 per cent a year, but over the last 100 years of the
period, from 1741 to 1841, the pace was much brisker, at 1.01 per cent (in
the first60years,1681to1741,therateofgrowthwasalmost glacial, at
only 0.2 per cent a year). It increased to a crescendo between 1791 and
1831, when the annual rate stood at 1.32 per cent.
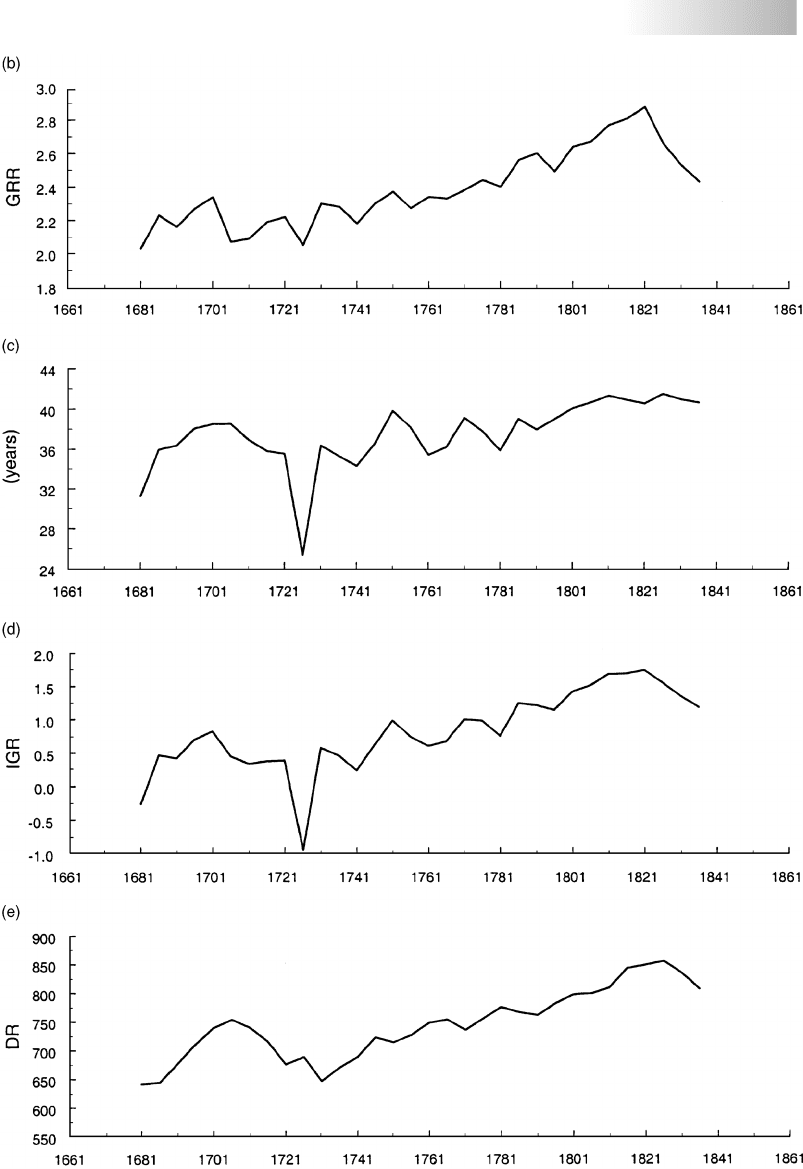
That fertility increased and mortality declined is evident both from
the crude birth and death rates and from changes in the gross re-
production rate (GRR) and in expectation of life at birth (e
0
), mea-
sures which are more reliable and informative because free from the
potentially distorting effects of changing age structure which can af-
fect crude rates.
9
Expectation of life at birth was exceptionally low in
thefirst five-year period, 1681–5, lower indeed than in any compara-
ble five-year period in the entire parish register period, other than in
thelate 1550s and the late 1720s, both periods when widespread epi-
demic mortality produced individual years in which the crude death
rate rose above 40 per 1,000 (Wrigley and Schofield 1989: tab. A3.3, 531–5).
There was no individual year in the early 1680s in which such a high level
wasreached but all five years 1681–5 were very sickly. Thereafter the sec-
ular trend in mortality was generally favourable, in spite of occasional
relapses, of which that in the late 1720s was the most pronounced. This
was the last peacetime quinquennium in which there were more deaths
than births. Over the period as a whole the IGR rose dramatically from
zero to a peak of 1.75 in 1821–6. In round figures the GRR increased from
2.0 to 2.9 from trough to peak, while e
0
increased by nineyearsfrom31
to 40 years between the first quinquennium and the early 1820s.
It is clear from Table 3.1 that both fertility and mortality were chang-
ing in a manner to increase the growth rate but their relative importance
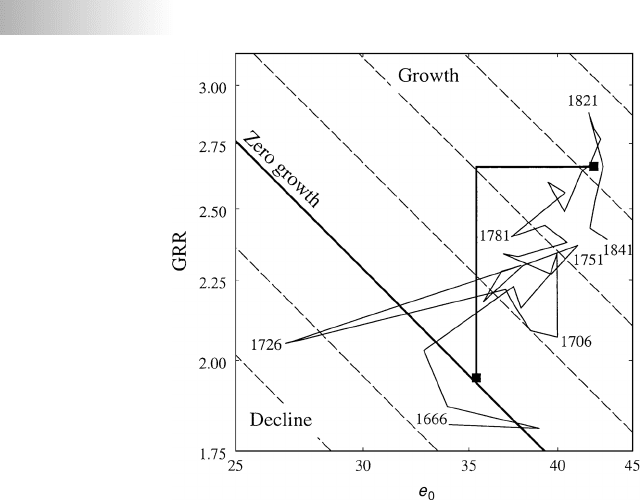
in engendering accelerated growth is not immediately clear. Figure 3.3
serves to elucidate this issue. The grid of diagonal lines represent intrin-
sic growth rates. Any one line represents the locus of all combinations of
fertility and mortality which result in a particular growth rate; 0.0 per
cent per annum, 0.5 per cent, and so on. Any vertical movement on the
graph represents a change in fertility (GRR); any horizontal movement a
9
Symbols are widely used in the representation and analysis of mortality for the sake of
economy and precision. The symbol e which refers to expectation of life and the symbol q
which refers to the life table death rate are used in this chapter. Other such symbols are
common in relation to the construction of life tables. Examples will illustrate the meaning
and use of the symbols. Thus e
0
refers to expectation of life at birth; e
25
refers to expectation
of life at age 25;
20
e
25
refers to the expectation of life in the twenty years between age 25
and 45 (that is the average number of years lived between these two ages). Similarly,
1
q
0
refers to mortality between age 0 and age 1;
5
q
15
refers to mortality between the ages of
15 and 20; and so on. If
1
q
0
= 236 per 1,000, this means that of every 1,000 children born,
236 will die before reaching their first birthday.
Cambridge Histories Online © Cambridge University Press, 2008
66 E. A. Wrigley
Figure 3.2 Changes in English demographic rates, 1681–1841
Notes:CBR, CDR, CMR: crude birth, death and marriage rates per 1,000 population. GRR:
gross reproduction rate. e
0
: expectation of life at birth (years). IGR: intrinsic growth rate
(per cent per annum). DR: dependency ratio (1,000 × ((0 − 14 + 60 and over) /15–59)).
Source:Wrigley et al. 1997: tab. A9.1, 614–15.
change in mortality (e
0
). Since the two axes are isometric with respect to
theIGR, the relative scale of movement in the two directions will show
therelative importance of the contributions made by changes in fertility
and mortality to any change in the IGR taking place over time. Fuller
details of the mode of construction and characteristics of graphs of this
type may be found elsewhere (Wrigley and Schofield 1989: 236–48). It
should be noted that the key mortality variable which is captured indi-
rectly by plotting e
0
is the proportion of women surviving to the mean
age at maternity.
In general, vertical movement is more pronounced than horizontal
in Figure 3.3, though the savagery of the mortality setback in the late
1720s shows through vividly. This may best be appreciated from the heavy
black line which begins in a black square on the zero growth diagonal,
rises vertically, and then makes a rectangular turn to the right to join
thesecond black square just beyond the diagonal representing an IGR of
Cambridge Histories Online © Cambridge University Press, 2008
British population during the ‘long’ eighteenth century 67
e
0
Figure 3.2 Continued
Cambridge Histories Online © Cambridge University Press, 2008
68 E. A. Wrigley
Figure 3.3 The combined effect of fertility and mortality in determining intrinsic growth rates,
1666–1841 (quinquennial data: growth contours at 0.5 per cent intervals)
Notes:The heavy diagonal line represents the locus of all combinations of fertility and
mortality resulting in an intrinsic growth rate of zero. Each successive diagonal line to the
‘north-east’ of the zero line represents positive growth rates of 0.5 per cent per annum,
1.0 per cent per annum, and so on, while each successive line to the ‘south-west’ represents
similar but negative growth rates. See text for an explanation of the heavy black line joining
the two black squares.
Source:Wrigley et al. 1997: tab. A9.1, 614–15.
1.5per cent per annum. The vertical section of the line captures the
change in fertility: the horizontal section the change in mortality be-
tween the two black squares. The two squares plot the combinations of
fertility and mortality prevailing in the two quarter centuries 1666–90
and 1816–40, at the beginning and the end of the great acceleration. In
the formerperiod e
0
averaged 33.9 years while the GRR averaged 1.95:
in the latter period the comparable figures were 40.8 years and 2.66.
10
The ratio of the vertical section of the heavy black line to the horizon-
tal section is 1.8:1.0. By this measure, therefore, fertility accounted for
about 64 per cent of the increase in the IGR between the two periods.
Griffith’s conviction, it seems, was not well founded. The course of popu-
lation change in England had a principally ‘vertical’ character in marked
contrast to that of Sweden where it was strongly ‘horizontal’, and both
10
It may be noticed that the first black square is plotted at an e
0
of slightly more than
35 years rather than at the 33.9 years quoted in the text. This is because a measure of
female mortality rather than overall mortality is appropriate since it is the mean age at
maternity which is relevant, and female expectation of life exceeded male expectation.
Cambridge Histories Online © Cambridge University Press, 2008

British population during the ‘long’ eighteenth century 69
countries were at odds with the French experience, which, in terms
of Figure 3.3, slid slowly down the zero growth diagonal in the later
eighteenth and early nineteenth centuries (Wrigley and Schofield 1989:
fig. 7.13, 246).
The age structure of a population is largely determined by its fertility.
It comes as no surprise, therefore, to see the marked change in the de-
pendency ratio which occurred over the long eighteenth century. In the
last twenty years of the seventeenth century the ratio averaged 669; in
1821–40 it averaged 838. In the same two periods the population aged
0–14 rose from an average of 303 per 1,000 total population to 387 per
1,000; the large rise in this component of the dependent population be-
ing somewhat offset by a decline in the proportion of the population over
60 from 97 to 69 per 1,000. Ceteris paribus the living standards both of the
working population and of its dependants must tend to be significantly
reduced by such a big rise in the dependency ratio.
FERTILITY AND NUPTIALITY
The results presented in the last section were chiefly based on aggregative
data and were derived from generalised inverse projection. Those to be
presented in this section and the next were chiefly based on nominal data,
structured by record linkage using the technique of family reconstitution.
It is natural to wonder whether the results obtained by these two different
methods, which are logically independent of each other and based on
data sets with little overlap, reinforce one another or are at odds. This
question has been considered elsewhere (Wrigley et al.1997: ch. 8; Oeppen
2000). The results are reassuring. There is close agreement in all the main
demographic series derived by the two methods.
Aggregative methods may establish the outlines of population change
and the relative importance of fertility and mortality in bringing about
thestriking acceleration in the rate of population growth, but recon-
stitution produces in addition a wealth of more detailed information,
turning the sketch into a portrait, and at the same time suggesting ques-
tions which can only be resolved by entering the areas in which social,
economic and demographic terrains overlap.
That fertility increased considerably during the long eighteenth cen-
tury is sufficiently evident from the rise in the GRR which took place.
But fertility may rise for many different reasons, either singly or in com-
bination: because the fertility rates of married women increase; because
women marry earlier in life; because the proportion of women who re-
main single throughout life falls; even because there is a marked rise in
the fertility rates of unmarried women. An increase in the GRR as great
as that which occurred is, of course, most unlikely to be due exclusively
to one of these four factors, especially as they are closely interlinked. It
is rather the relative importance of changes in the four factors which
Cambridge Histories Online © Cambridge University Press, 2008

70 E. A. Wrigley
Table 3.2 Age-specific marital fertility rates per 1,000 woman-years lived; and total marital
fertility rates
15–19 20–4 25–9 30–4 35–9 40–4 45–9 TMFR 20–49 TMFR 15–49
1680–1729 315 410 366 315 240 111 22 7.32 8.90
1730–79 430 418 364 314 254 134 22 7.53 9.68
1780–1829 532 429 390 312 255 148 23 7.79 10.45
Source:Wrigley et al.1997: tab. 7.37, 450.
needs to be established. All four changed in England in the long eigh-
teenth century.
Table 3.2 summarises English age-specific marital fertility rates in three
fifty-year periods. Both the dramatic rise in the rate in the 15–19 age
group and the more modest rise in the next age group, 20–4, are at-
tributable to the marked rise in the proportion of women who were
pregnant on marriage. In the early nineteenth century about a quarter
of all first births were prenuptially conceived and a further quarter were
illegitimate, whereas in the later seventeenth century the comparable
proportions were about 7 per cent in each case (Wrigley 1981: 162 and
more generally 155–63). Since the early months of marriage represent
afar higher proportion of the total of woman-years lived in marriage
among teenagers than among older women, this change in behaviour
has a much greater impact on the fertility rate in the age group 15–19
than in older age groups. Fertility also rose in the age groups 25–9, 35–9
and 40–4 but was stable in the remaining age groups. The total marital
fertility rate summarises the individual rates, showing the number of
children who would be born to an average woman living in marriage ei-
ther between the ages of 15 and 49 or 20 and 49. Both rates rose steadily
during the period as a whole, but the former much more than the latter
because of the massive rise in the rate for the age group 15–19.
The marked increase in illegitimacy and in prenuptial conceptions in
the course of the eighteenth century is a notable phenomenon in itself. At
first sight it might be thought strange that in a period when marriage age
fell substantially, and when therefore the proportion of sexually mature
women who were single was greatly reduced, illegitimacy should have
risen sharply. Viewed in a different light, however, it is less surprising. If
entry into marriage is restricted, the average age at marriage advanced,
and overall fertility consequently held to a modest level, normative forces
may also restrain fertility before marriage and outside marriage; whereas
in an era when marriage is early and universal both intercourse before
marriage and illegitimacy may be more readily countenanced. One of the
more intriguing features of this aspect of English fertility history is the
contrast it affords with contemporary France. In France in this period
both age at marriage and the proportion never marrying were rising
but illegitimacy rose significantly, rather than declining, conforming to
Cambridge Histories Online © Cambridge University Press, 2008