George W. Stimson introduction to Airborne Radar (Se)
Подождите немного. Документ загружается.

From the standpoint of filtering, though, the important
characteristic of the I and Q samples when the doppler shift
is zero is that their individual amplitudes do not fluctuate.
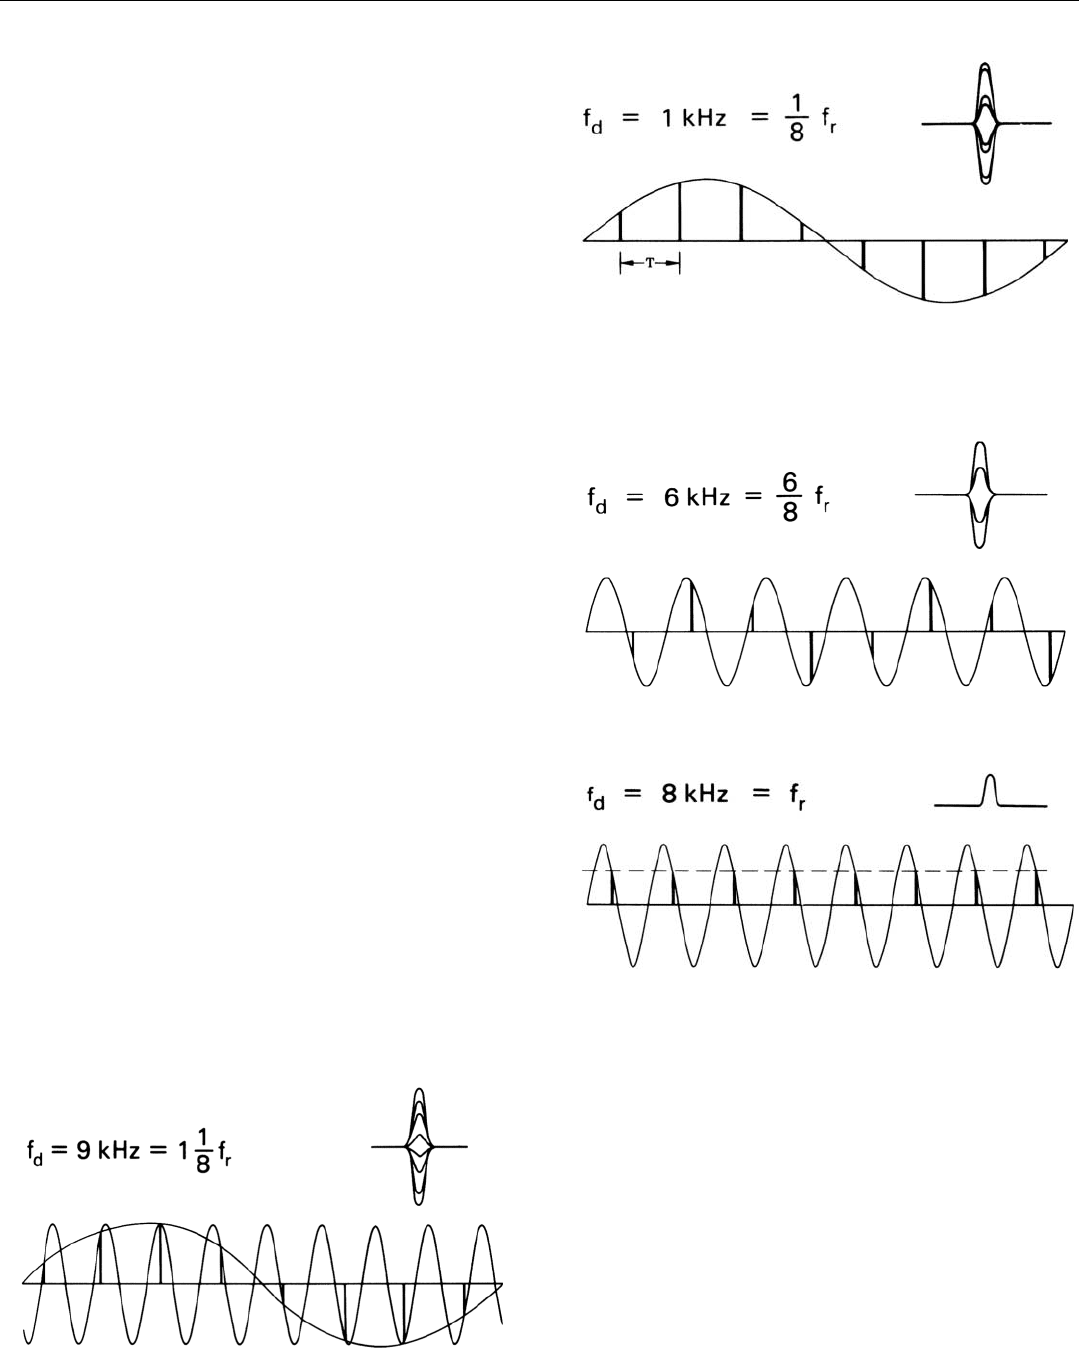
Moving on to the target whose doppler frequency is 1
kilohertz (Fig. 4), the amplitude of its pips fluctuates wide-
ly from pulse to pulse. The reason for this, too, can be
readily seen. Because the echoes do not have the same radio
frequency as the reference signal, their phase relative to it
changes from pulse to pulse. The amount of change is 360°
times the ratio of the target’s doppler frequency to the PRF.
In this case (doppler frequency, 1 kilohertz; PRF, 8 kilo-
hertz) the ratio is 1/8. The doppler frequency “wave” is, in
effect, being sampled at intervals of 360° x
1
/8 = 45°.
(Again, the magnitude of the vector sum of the I and Q
samples equals A, but the phase of the sum cycles through
360° at a rate equal to the doppler frequency.)
For the target whose doppler frequency is 6 kilohertz
(Fig. 5), the story is the same. The only difference is that, in
this case, the samples are taken at intervals of 360° x
6
/8 =
270°.
As a result, not only does the amplitude of the detector’s
output fluctuate widely, but as the target return slides into
and out of phase with the reference frequency, the samples
alternate between positive and negative signs.
For the target whose doppler frequency is 8 kilohertz,
though, the pips once again have a constant amplitude
(Fig. 6). The reason, of course, is that the doppler frequen-
cy and the PRF are equal. The samples are all taken at the
same point in the doppler frequency cycle. There is, in fact,
no way of telling whether the doppler frequency is zero, or
f
r
, or some integer multiple of f
r
.
Similarly, if echoes are received from a target having a
doppler frequency of 9 kilohertz (Fig. 7, below), the pips it
produces will fluctuate at exactly the same rate as the pips
produced by the target having a doppler frequency of 1
kilohertz. The observed frequency is ambiguous.
CHAPTER 19 How Digital Filters Work
255
4. Detector output varies sinusoidally from pulse to pulse.
5. Detector output alternates between positive and negative values.
6. Detector output is similar to that for target with zero doppler
frequency.
7. Detector output fluctuates at exactly the same rate as for a target
whose doppler frequency is 1 kilohertz (9 kHz – 8 kHz).
PART IV Pulse Doppler Radar
256
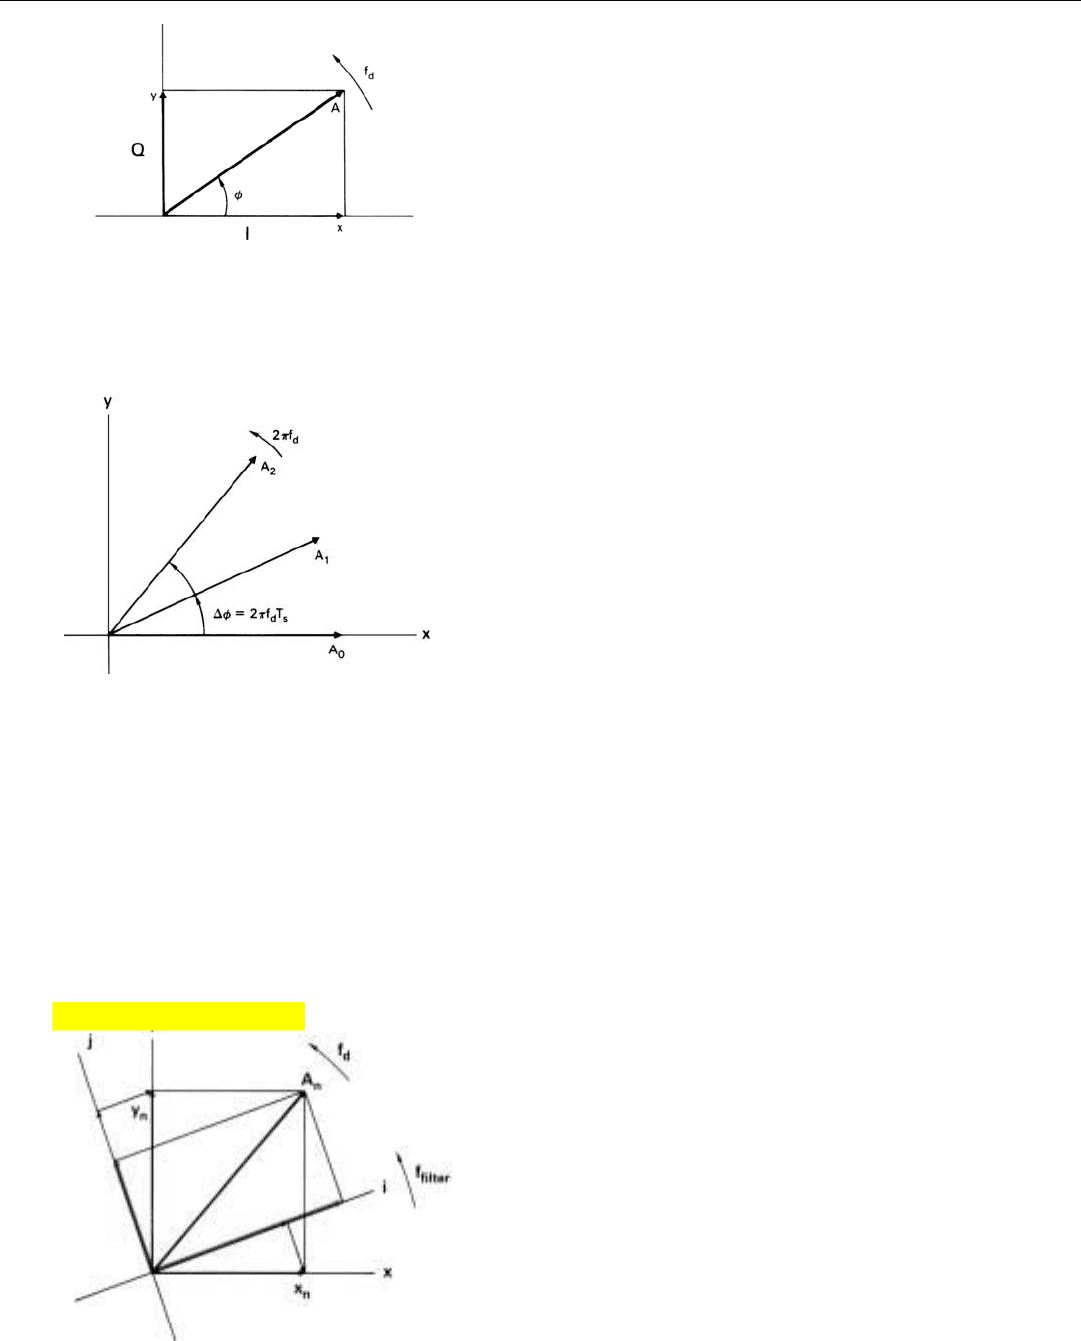
Phasor Representation of the Samples. Everything we
have seen by viewing the detector output at a point on a
range trace corresponding to a particular target’s range can
be presented much more conveniently in a phasor diagram,
such as that shown in Fig. 8. Moreover, a phasor diagram
presents the outputs of both the I and Q detectors simulta-
neously. The length of the phasor corresponds to the ampli-
tude (A) of the target’s echoes. The angle (φ) which the pha-
sor makes with the x axis, corresponds to the radio-fre-
quency phase of the echoes relative to the reference signal.
The length, x, of the projection of the phasor on the x axis
corresponds to the output of the in-phase (I) detector; the
length, y, of the projection on the y axis corresponds to the
output of the quadrature (Q) detector.
The phasor rotates at the target’s apparent doppler fre-
quency, i.e., its true doppler frequency or true doppler fre-
quency plus or minus an integer multiple of the sampling
rate. If this frequency is positive (greater than the reference
frequency), rotation is counterclockwise (Fig. 9); if nega-
tive, rotation is clockwise. The amount that the phasor
steps ahead from sample to sample (∆φ) is 2π radians
(360°) times the doppler frequency times the length of the
sampling interval:
∆φ = 2π f
d
T
s
where f
d
is the apparent doppler frequency and T
s
is the
sampling interval. If the sampling rate is the PRF (as it gen-
erally is in all-digital signal processors),
2
T
s
is the interpulse
period, T.
What the Filter Does
Digital filtering is simply a clever way of adding up (inte-
grating) successive samples of a continuous wave so that
they produce an appreciable sum only if the wave’s frequen-
cy lies within a given narrow band—i.e., produce a sum
equivalent to the output which would be produced if the
continuous wave were applied to a narrow band analog fil-
ter. If the variation in amplitude from sample to sample cor-
responds closely to the resonant frequency of the equivalent
analog filter, the sum builds up; otherwise, it does not.
What the filter does, in effect, is project the x and y com-
ponents of the phasor representation of the samples onto a
rotating coordinate system (i and j in Fig. 10). The rate at
which the coordinates rotate—number of revolutions per
second—is made equal to the center frequency of the band
the filter is intended to pass. This rate, f
f
, can be thought of
as the filter’s resonant frequency: the frequency to which it
is “tuned.”
8. If the sine wave is represented by a phasor (A), the I compo-
nent is the projection of the phasor on the x axis and the Q
component is the projection of the phasor on the y axis.
9. The amount that the phasor steps ahead from sample to sam-
ple (∆φ) is proportional to the target’s doppler frequency.
10. The filter projects the x and y components of the phasor, A
n
,
onto a coordinate system (i, j) that rotates at the frequency to
which the filter is “tuned.”
2. In certain applications digital
doppler filtering may be pre-
ceded by some analog filter-
ing (for clutter reduction),
which converts the return to a
CW signal. The sampling rate
then is generally not the PRF.
Click for high-quality image
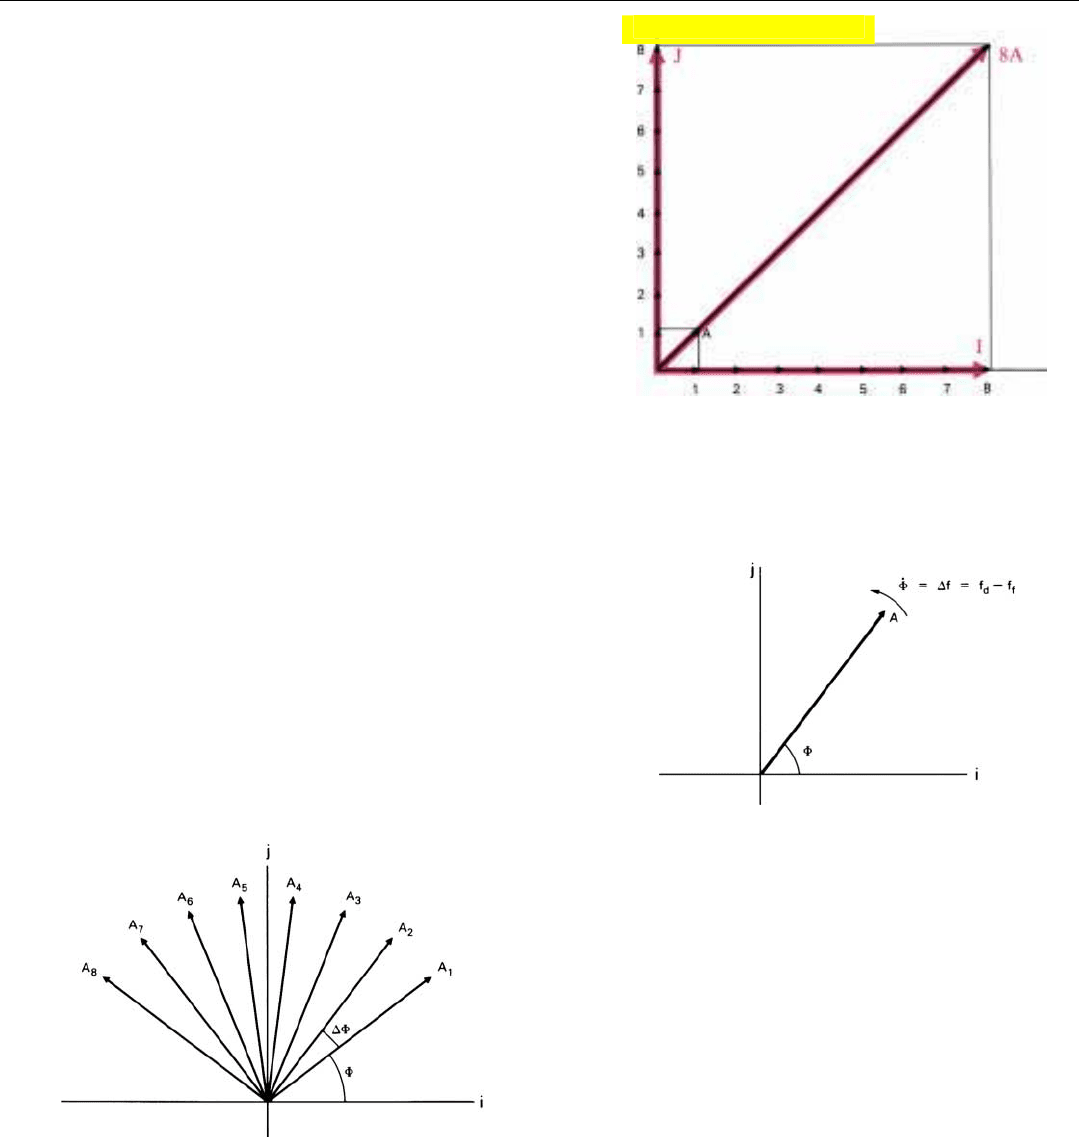
If the frequency of the sampled wave is the same as that
of the filter, the angle between the phasor (A) and the rotat-
ing coordinate system will be the same for every sample
(Fig. 11).
Consequently, after N samples have been received, the
sum of the projections of the x and y components of A on
the i axis will be N times as great as after a single sample
has been received. The same will be true of the sum of the
projections on the j axis.
On the other hand, if the frequencies of the sampled
wave and the filter differ sufficiently, the angle between the
phasor and the rotating coordinate system (i, j) will vary
cyclically and the projections will tend to cancel.
At the end of the integration time, the sum of the projec-
tions on the i axis (I) is added vectorially to the sum of the
projections on the j axis (J). The magnitude of the overall
vector sum is the output of the filter. The quantities I and J
are then dumped and the integration is repeated for the
next N samples.
We can visualize the process most easily if we imagine
that we are riding on the rotating coordinate system (Fig.
12). We then see only the rotation of the phasor relative to
the i and j axes—that is, the rotation (Φ
⋅
) due to the differ-
ence (∆f) between the frequency of the sampled wave and
the frequency of the filter. As we just saw, if ∆f is zero, the
phasor will be in the same relative position each time a
sample is taken. But if the frequencies are different, the
phasor will be in progressively different positions (Fig. 13).
CHAPTER 19 How Digital Filters Work
257
11. If the target’s doppler frequency and the filter frequency are
the same, after eight pulses have been integrated, the magni-
tude of the vector sum of the phasor’s projections on i and j
will be eight times the phasor’s amplitude.
12. If we were to ride on the rotating coordinate system (i, j), we
would see only the rotation, Φ
⋅
, of the phasor (A) due to the differ-
ence between the frequencies of the sampled wave and the filter.
13. If the frequencies of the sampled wave and the filter differ,
the phases of successive samples will differ by ∆Φ.
The phase difference, ∆Φ, between successive positions is
directly proportional to the frequency difference. In radians
∆Φ = (2π T
s
) ∆f
where 2π is the number of radians in one revolution, T
s
is
the sampling interval, and ∆f is the difference between the
frequencies of the sampled wave and the filter.
Click for high-quality image
PART IV Pulse Doppler Radar
258
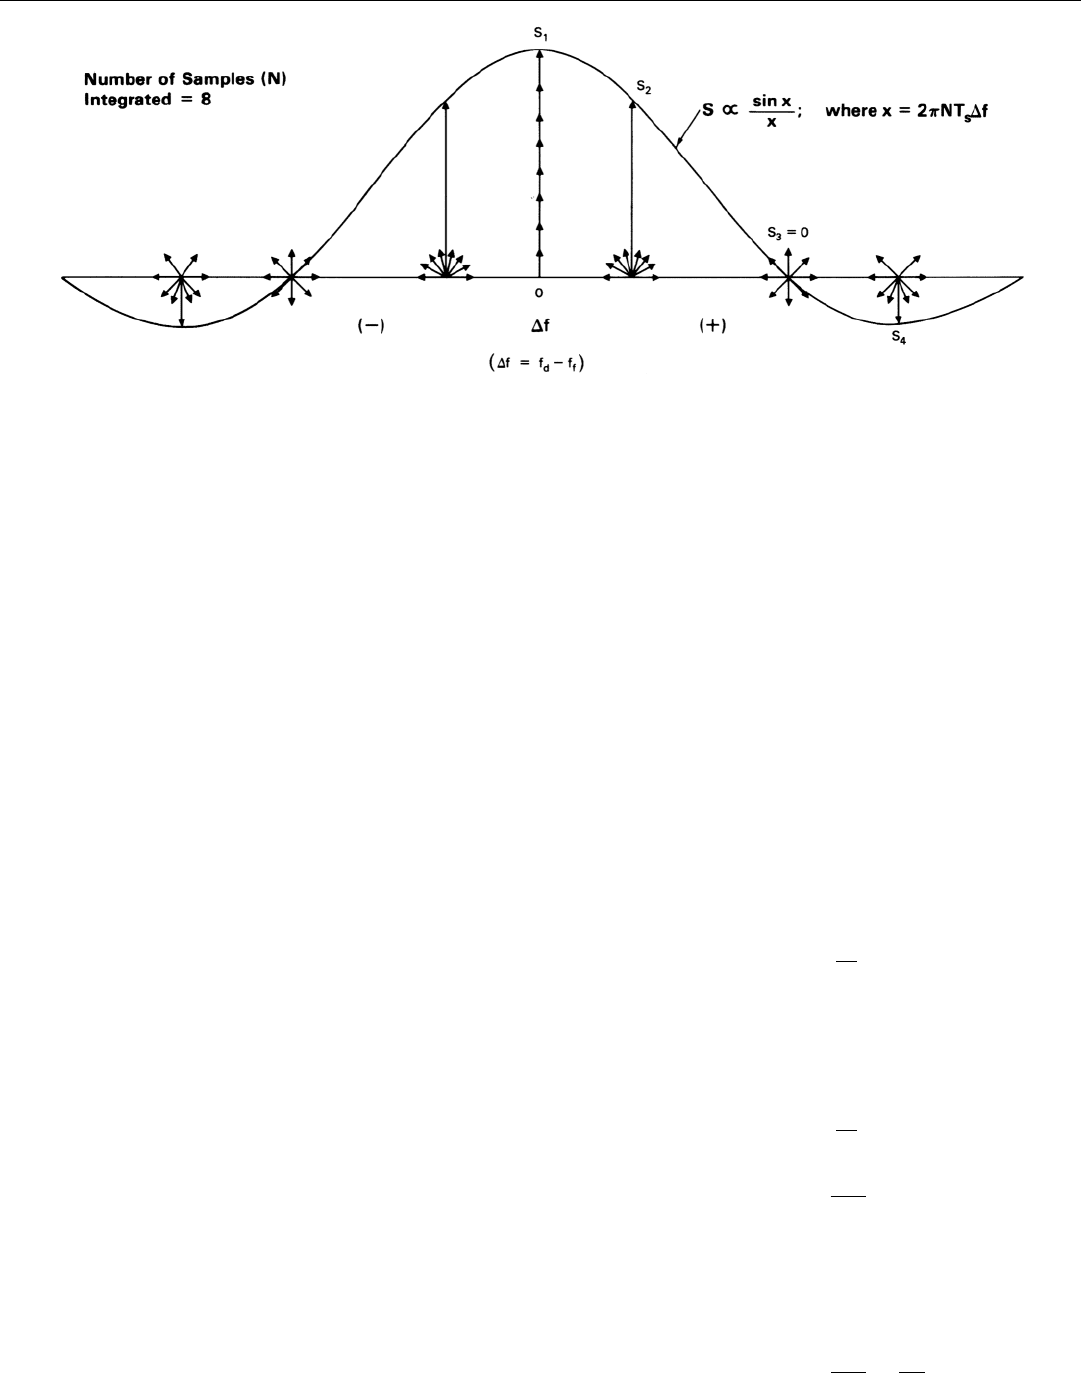
As you can see from the phasor diagrams in Fig. 14, if
the frequency difference ∆f (hence also ∆Φ) is gradually
increased, the phasor positions fan out increasingly, and the
extent to which the samples cancel correspondingly
increases.
A point is soon reached where the phasor positions are
fanned out over a full 360°. The sum of the samples is then
zero; a null in the filter characteristic has been reached.
Beyond this null, the filter output goes through a succes-
sion of sidelobes.
For a given amplitude of the sampled signal, a plot of the
amplitude of the filter output versus ∆f has a sin x/x shape.
The band of frequencies between the first pair of nulls is
the filter’s passband.
Since 360° is 2π radians, after N samples have been inte-
grated, the value of ∆Φ for which the first nulls occur is 2π
divided by N.
∆Φ
N
=
2π
N
By substituting the expression we derived earlier for ∆Φ
N
(2πT
s
∆f), we can find the difference, ∆f, between the fre-
quencies of the wave and the filter at the nulls.
2πT
s
∆f=
2π
N
∆f =
1
NT
s
The number of samples integrated (N) times the sam-
pling interval (T
s
) is of course the filter integration time
(t
int
). Therefore, the null-to-null bandwidth is
BW
nn
=
2
=
2
NT
s
t
int
14. If difference (∆f) between frequencies of sampled signal and filter is increased, phasors representing successive samples will fan out increas-
ingly and the magnitude of their sum (S) will vary as sin x/x.
The 3-dB bandwidth of a sin x/x curve is roughly half the
null-to-null bandwidth, so
BW
3 dB
≅
1
t
int
Thus, the more samples integrated and the longer the sam-
pling interval—i.e., the greater t
int
—the narrower the pass-
band will be. Interestingly, if integration is performed serial-
ly, the passband is in a sense dynamic; throughout the inte-
gration period it narrows, reaching its final width only at
the end of the period.
As noted previously, if the samples received as inputs by
the filter are due to the return from a target, the amplitude
(A) of the phasor representation of the sampled signal will
be proportional to the power of the target echoes. The filter
output then will be proportional to the power of the echoes
times the integration time and so will be proportional to the
total energy received from the target during t
int
. The con-
stant of proportionality will have its maximum value if the
target’s doppler frequency is centered in the filter passband.
The constant will be zero if the doppler frequency is the
same as one of the null frequencies. Otherwise, the con-
stant will have some intermediate value determined by the
filter’s sin x/x output characteristic.
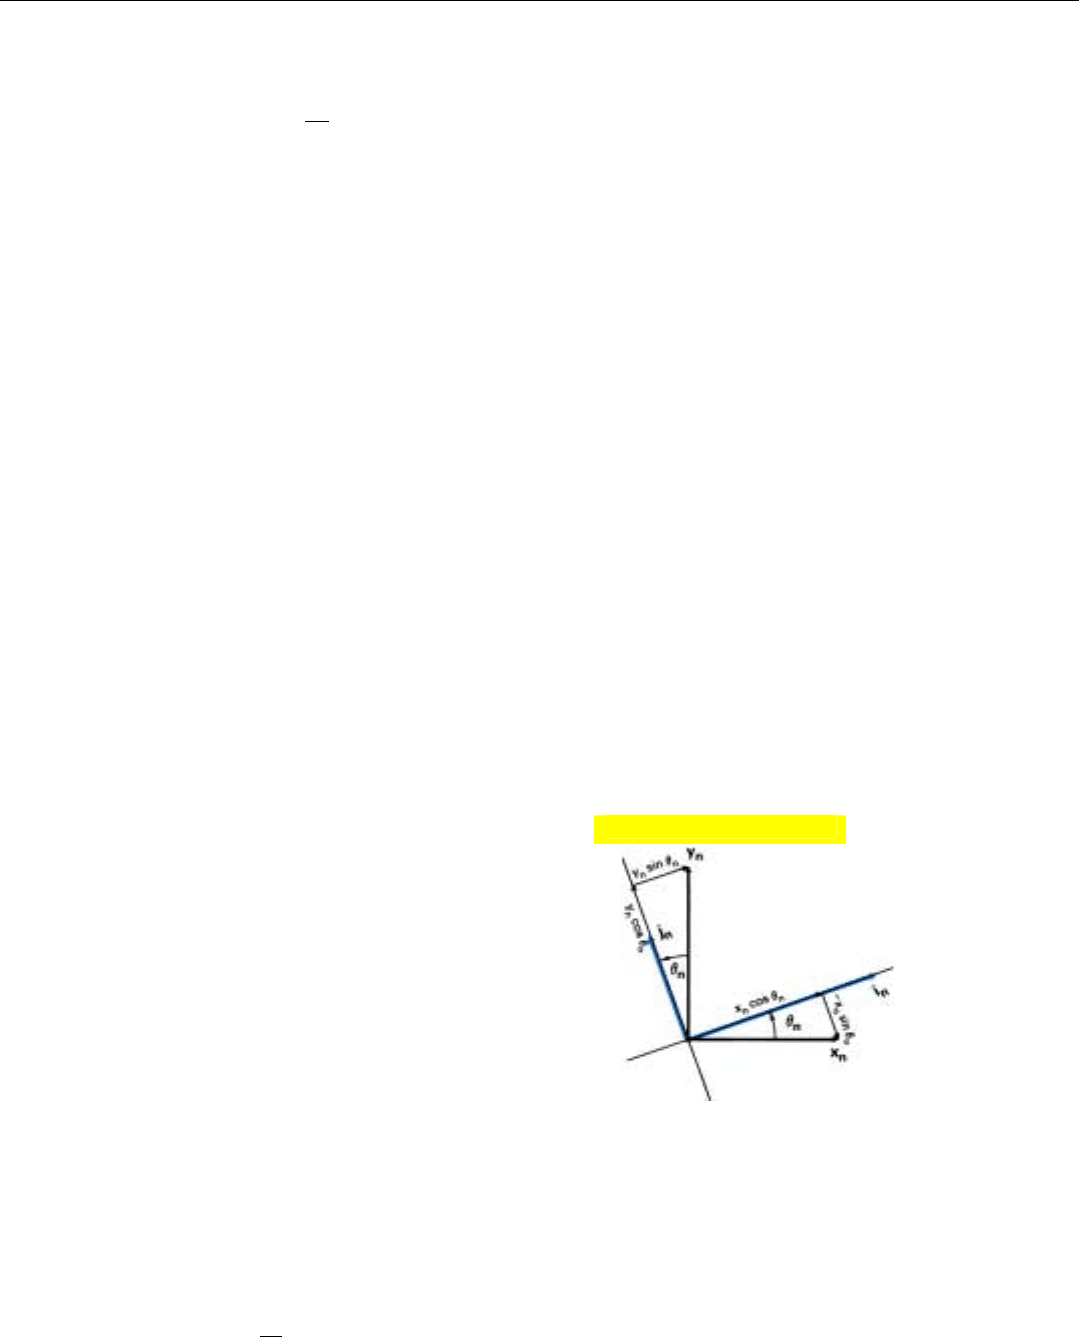
Discrete Fourier Transform
The algorithms which must be repeatedly computed to
project the in-phase and quadrature components of succes-
sive samples of a wave (x
n
and y
n
) onto the rotating coordi-
nates (i and j) can be derived on sight from the geometry of
Fig. 15. They are
i
n
= x
n
cos
θ
n
+ y
n
sin
θ
n
j
n
= y
n
cos
θ
n
– x
n
sin
θ
n
where i
n
and j
n
are the projections of x
n
and y
n
on the
rotating coordinates and
θ
n
is the angle between the coordi-
nate systems.
The terms cos
θ
n
and sin
θ
n
are called the filter coeffi-
cients. The amount that
θ
changes from one sampling inter-
val to the next—∆
θ
—is 2π times the product of the filter
frequency and the sampling interval, T
s
. If the sampling
rate is the PRF, then T
s
= 1/f
r
, and
∆
θ
=
f
f
360°
f
r
where f
f
is the filter’s frequency and f
r
is the PRF.
CHAPTER 19 How Digital Filters Work
259
15. The algorithms which must be repeatedly computed to per-
form the integration may be derived on sight from the rela-
tionships illustrated here.
i
n
= x
n
cos
θ
n
+ y
n
sin
θ
n
j
n
= y
n
cos
θ
n
– x
n
sin
θ
n
Click for high-quality image
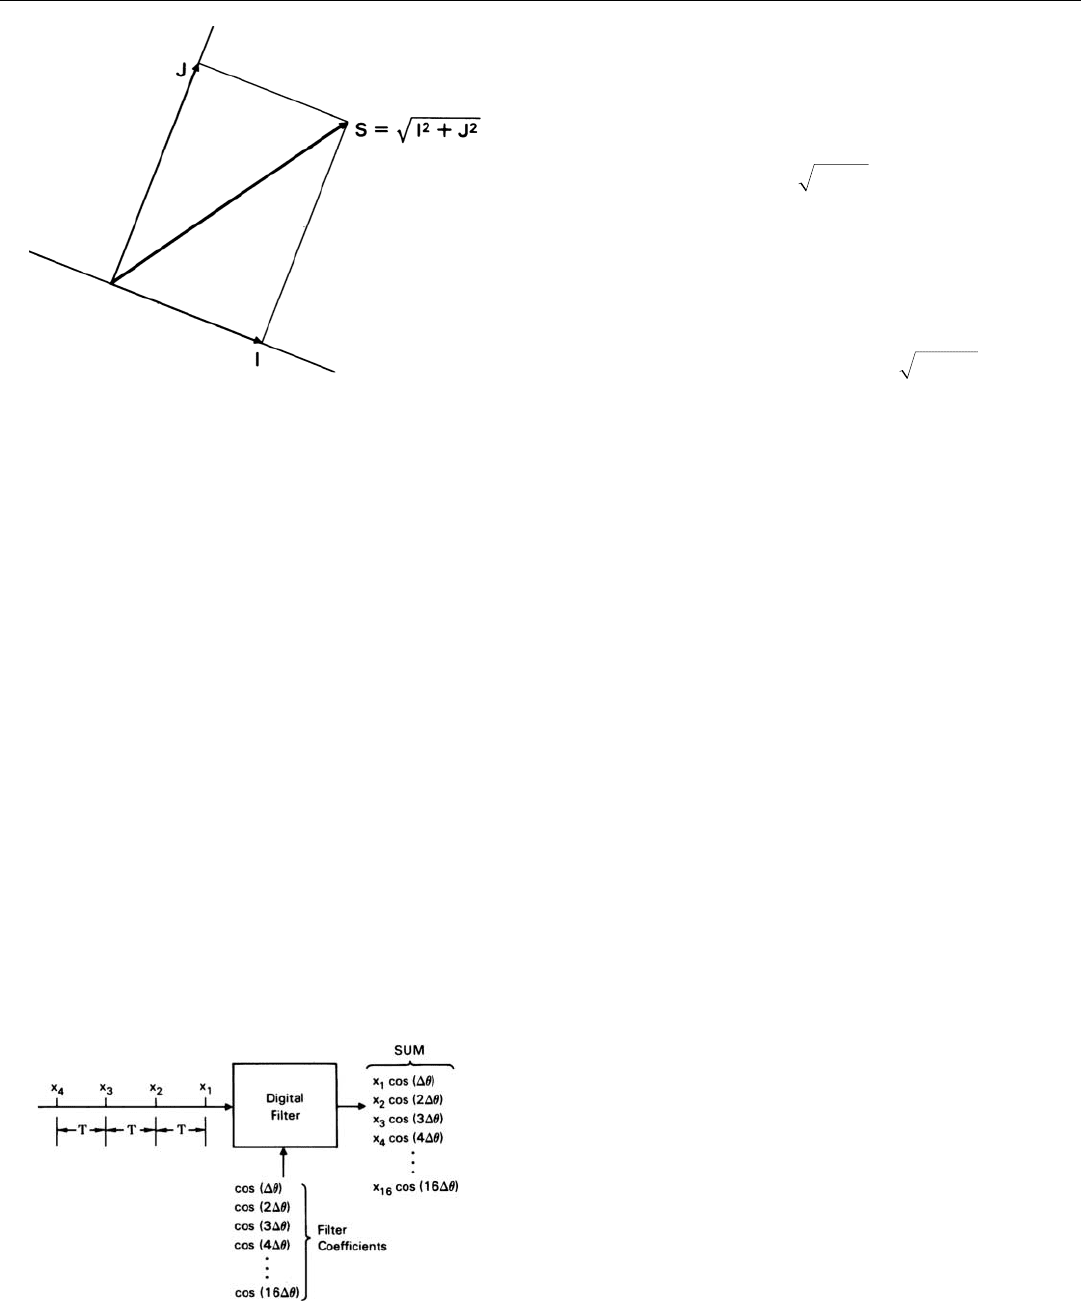
As the values of I and J are computed, they are separately
summed. At the end of the integration period, the sums are
added vectorially (Fig. 16). For this, the equation which
must be solved is
S = I
2
+ J
2
where I and J are the sums of the values of i and j, respec-
tively, for the samples taken during the integration period.
The output of the filter is the quantity, S. (Often, to avoid
taking the square root, which is comparatively time con-
suming, an algorithm approximating I
2
+ J
2
is used to
compute S.)
Taken together, the iterations of the algorithms for I and
J for a single integration period plus the algorithm for S
constitute the discrete Fourier transform, DFT. “Discrete”
connotes that the transform applies to discrete-time samples
of a time-varying function—the sampled wave—rather than
to the continuous function of time, itself.
3
Implementing the DFT
The sequence of operations which a computer must
carry out to implement the discrete Fourier transform may
be most easily seen if we consider first a simple filter pro-
cessing one component (say the in-phase component, x) of
the return from a single range increment. We can then
move on to the processing of return from a contiguous
series of range increments and, finally, to the processing of
both in-phase and quadrature components.
Single-Channel Filter. To project the component x
n
, of
successive pulses onto a single rotating coordinate, i, only
one term of the DFT must be repeatedly computed.
i
n
= x
n
cos
θ
n
Other than summing successive values of i, no other com-
putation is required.
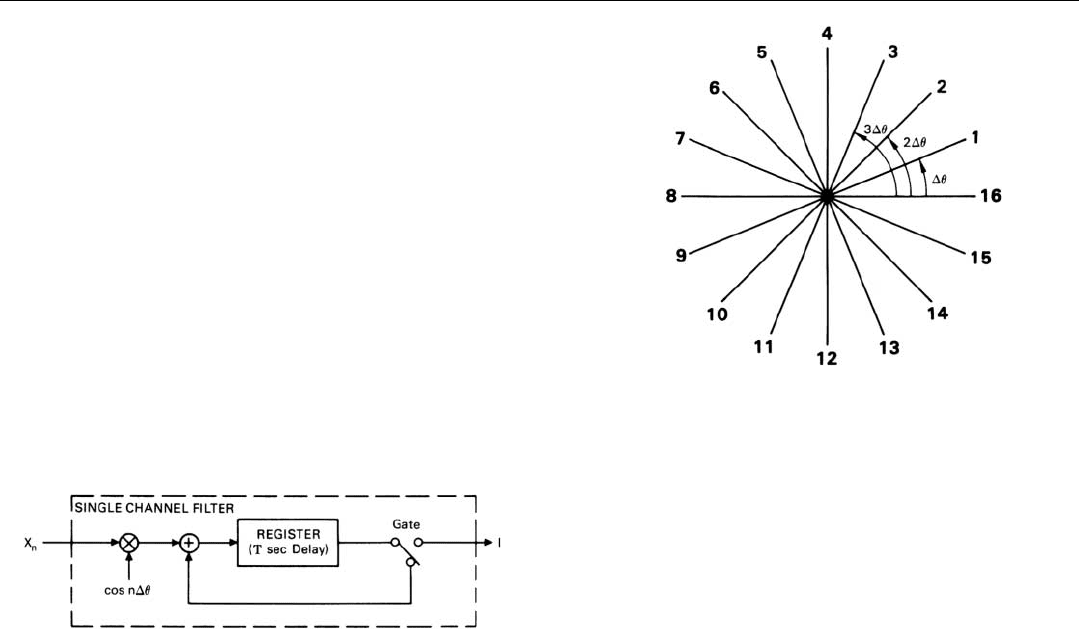
For any one range increment (Fig. 17), the input to the
computer consists of a succession of digital numbers—x
1
,
x
2
, x
3
, etc. Since all of these numbers represent echoes
reflected from the same range, successive numbers are
received by the computer at the same point in successive
interpulse periods. Their arrivals are thus separated by T
seconds, T being the interpulse period.
Now, the computer’s job is to multiply each number by
the coefficient, cos
θ
n
; add up the products for some pre-
specified number of inputs, N; and output the accumulated
PART IV Pulse Doppler Radar
260
16. The algorithm which must be computed to add the sums vecto-
rially at the end of the integration period may be derived on
sight from the relationships illustrated here.
17. Inputs to a single-channel filter for a single-range increment.
The filter’s job is to multiply successive values of the in-phase
component of the target signal (x
1
, x
2
, etc.) by prestored co-
efficients and sum the products.
3. The Fourier transform for a
continuous function of time
(pulse-modulated sine wave)
was derived in Chap. 17.
sum. The computer repeats this process over and over
again. For purposes of explanation, we will assume here
that N is 16.
If we represent the pulse-to-pulse change in
θ
for the
particular frequency to which the filter is tuned by ∆
θ
and
for the sake of simplicity assume that the initial value of
θ
is
∆
θ
, the values of the coefficients for each set of 16 inputs
will be cos ∆
θ
, cos 2∆
θ
, cos 3∆
θ
, cos 4∆
θ
, . . . cos 16∆
θ
(Fig. 18).
When the first input, x
1
, is received, the computer multi-
plies it by cos ∆
θ
and adds the product into a register,
where it is held for T seconds.
When the second number, x
2
,
is received, the computer multiplies it by cos 2∆
θ
, retrieves
the stored product from the register, adds the two products
together, and returns the sum to the register (Fig. 19).
4
CHAPTER 19 How Digital Filters Work
261
18. Values of
θ
for a filter designed to integrate 16 pulses.
19. Functions performed by a single-channel filter. After N inputs have
been integrated, gate closes and sum (I) is output.
4. “Register” here connotes a
memory position which only
an entire digital number may
be entered into or retrieved
from.
The process is repeated for x
3
through x
16
without change.
However, before x
17
is received, a switch (gate) is temporarily
thrown, allowing the sum which has accumulated in the reg-
ister to pass on to the output. The switch is then returned to
its original position, and the integration process is repeated
for x
17
through x
32
. In general, for every value of x, the filter
must perform one multiplication and one addition.
Processing Returns from Successive Ranges. If returns
from more than one range increment are to be processed,
instead of receiving an input of only one number in every
interpulse period, the computer receives a continuous
stream of numbers. During the first interpulse period, it
successively multiplies the number (x
1
) for each range
increment by cos ∆
θ
, storing the individual products in
separate registers. During the next interpulse period, the
computer multiplies the number (x
2
) for each range incre-
ment by cos 2∆
θ
, adds this product to the previously stored
product, and so on.
Thus, over the same integration period, the computer
forms a separate filter—tuned to the same frequency—for
the returns from every range increment. If, for example,
returns from 100 range increments are processed, the com-
puter forms 100 filters during every integration time for just
this one doppler frequency.
PART IV Pulse Doppler Radar
262
In simple processors, the products may be stored in what
is called a shift register (Fig. 20). It has as many storage
positions as there are range increments. Each time a new
product is produced, the stored sums are all shifted one
position (to the right in the figure). The new product is
added to the sum that has spilled out of the last position,
and the resulting sum is stored in the memory position
which has just been vacated (at the left end of the register).
Since the simple filters we have considered so far process
only one component of the return, they cannot, of course,
discriminate between positive and negative doppler fre-
quencies. If the frequency to which a filter is tuned is 10
kilohertz, for example, the filter will pass return whose fre-
quency is (f
0
– 10 kHz), just as well as return whose fre-
quency if (f
0
+ 10 kHz). To differentiate between positive
and negative doppler frequencies, both in-phase and quad-
rature components must be processed. The computing then
is done essentially in two parallel channels.
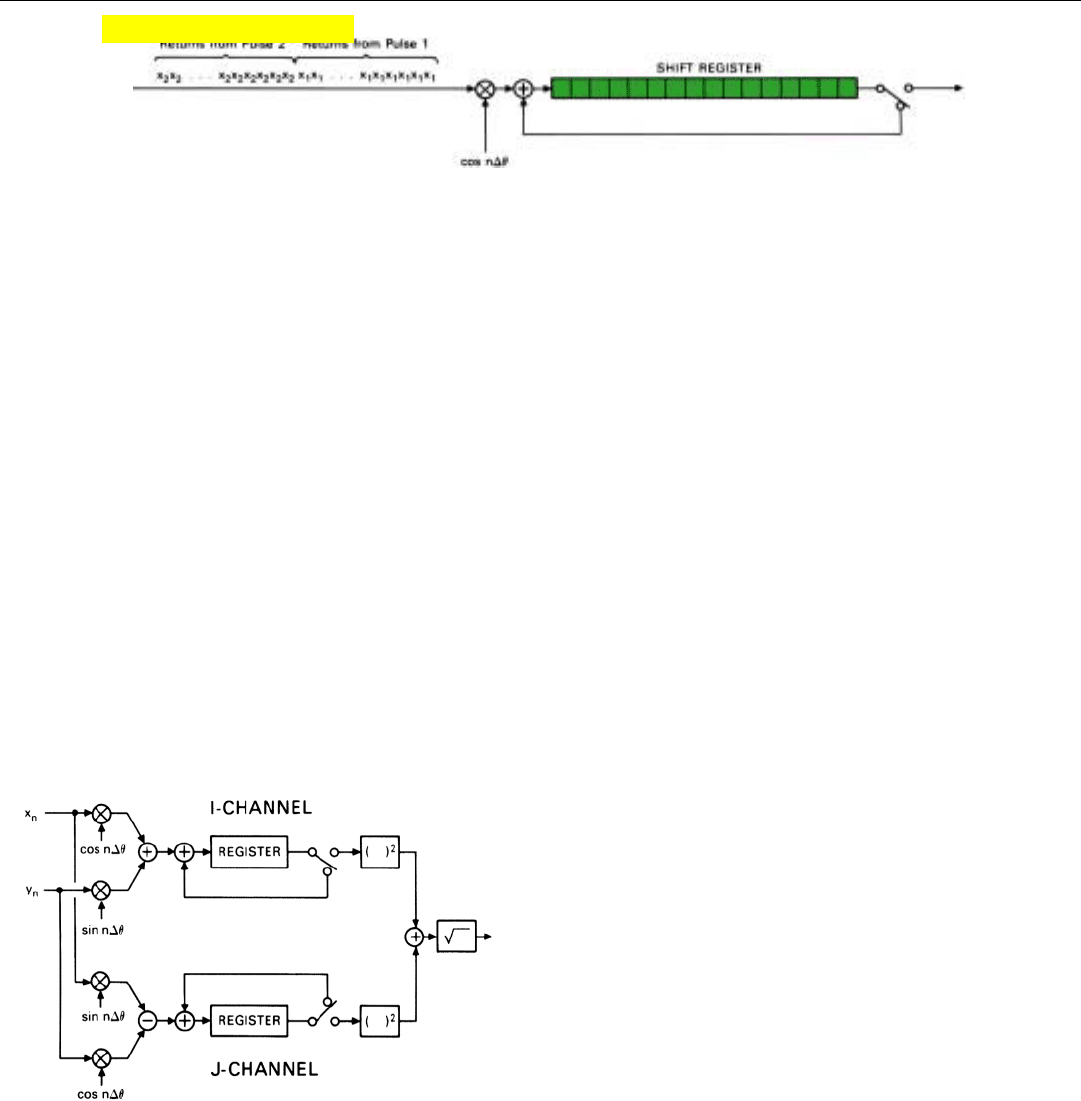
Two-Channel Processing. A two-channel filter is similar
to a single-channel filter, but is more complex. Two registers
are required—one for the in-phase channel and one for the
quadrature channel (Fig. 21). For each echo from the same
range increment, the filter receives two inputs, x
n
and y
n
.
For the in-phase channel, x
n
is multiplied by cos n∆
θ
,
just as in the single-channel filter. However, y
n
must simul-
taneously be multiplied by sin n∆
θ
. This second product
must then be added to the first. The sum (x
n
cos n∆
θ
+ y
n
sin n∆
θ
) is stored in the register.
Similarly, for the quadrature channel, y
n
is multiplied by
cos n∆
θ
and x
n
is multiplied by sin n∆
θ
. In this case,
though, the second product is subtracted, and the differ-
ence is stored in the register.
At the end of each integration period, the magnitude of
the integrated target signal is calculated by vectorially
adding the outputs of the two channels. For this, each out-
put is individually squared. The squares are then added
together, and the square root is taken of the sum. This root,
or an approximation of it such as illustrated at the top of
the facing page, is the output of the filter.
20. When returns from successive range increments are processed, the sums for the individual increments may be stored in a shift register. As
each new number is received, sums shift one position to the right.
21. Mechanization of a two-channel filter. Inputs x
n
and y
n
are
applied to both channels. At end of every integration period, I
and Q outputs are squared and summed, and the square root
is taken of the sum.
Click for high-quality image
All of the foregoing computations—a total of eight for
each pair of numbers that is input plus four for the filter
output—must be repeated for every filter that is formed. If
32 pairs of numbers are integrated, this amounts to a total
of (8 x 32) + 4 = 260 computations per filter. If, as in the
earlier example, returns from 100 range intervals are
processed, a total of 260 x 100 = 26,000 computations
must be performed for just this one frequency during every
integration time.
Sidelobe Reduction
As was illustrated in Fig. 14, the passband of a digital fil-
ter has sidelobes similar to the sidelobes of a linear array
antenna. Unless something is done to reduce these, a tar-
get’s echoes may be detected in the outputs of several adja-
cent doppler filters, or, if the echoes are especially strong,
in the outputs of a considerable portion of the filter bank.
Fortunately, filter sidelobes yield to the same reduction
technique as antenna sidelobes. (This technique was
described in Chap. 18.) Just as antenna sidelobes are due
to the radiation from the radiators at the ends of the array,
filter sidelobes are due to the pulses at the beginning and
end of the pulse train. By progressively reducing the ampli-
tudes of these pulses, the spectral sidelobes can be substan-
tially reduced.
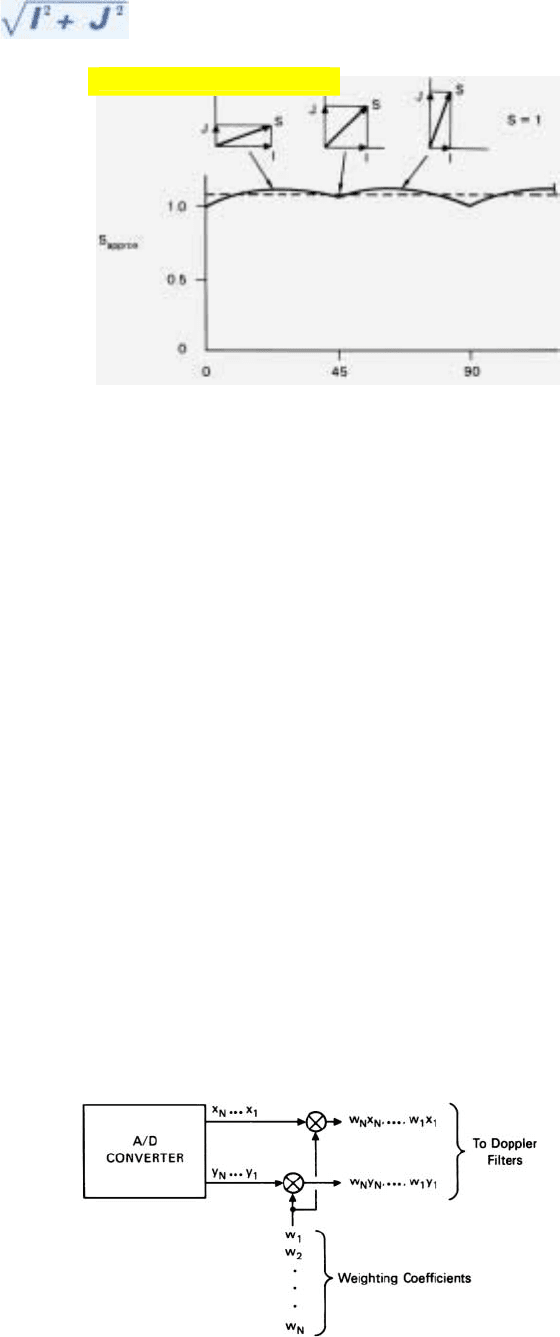
This process, called amplitude weighting, is carried out
“wholesale,” before the digitized video is supplied to the
doppler filters (Fig. 22). Following every transmission, the
numbers representing the I and Q components of the
return from each range increment are multiplied by a
weighting coefficient. The coefficient is changed from one
pulse to the next according to a prescribed pattern, which
CHAPTER 19 How Digital Filters Work
263
22. Outputs of A/D converter are multiplied by weighting coeffi-
cients before being supplied to doppler filters.
ALGORITHM FOR APPROXIMATING
Although it looks simple enough, taking the vector sum,
公
—
I
2
⫹ J
2
is a comparatively long process. For the square root
can be found only through an iterative series of trials.
To save computing time, therefore, the value of
公
—
I
2
⫹ J
2
is
commonly approximated. The simplest of several possible
algorithms for making this approximation is this:
• Subtract I from J (or vice versa) to find which is smaller.
• Divide the smaller quantity by two. (Doing this in binary
arithmetic is easy: you just shift the number right one binary
place.)
• Add the result to the larger quantity. The sum is
⬃
公
—
I
2
⫹ J
2
The error of approximation varies with the value of the phase
Φ
.
But at most it is only a fraction of a decibel.
Click for high-quality image
PART IV Pulse Doppler Radar
264
is repeated for each train of pulses that is to be integrated. If
this pattern has been suitably selected, the sidelobes can be
reduced to an acceptable level. In the process, the passband
is widened somewhat just as the mainlobe of an antenna is
widened by illumination tapering. But this is generally a
small price to pay for the reduction achieved in the side-
lobes.
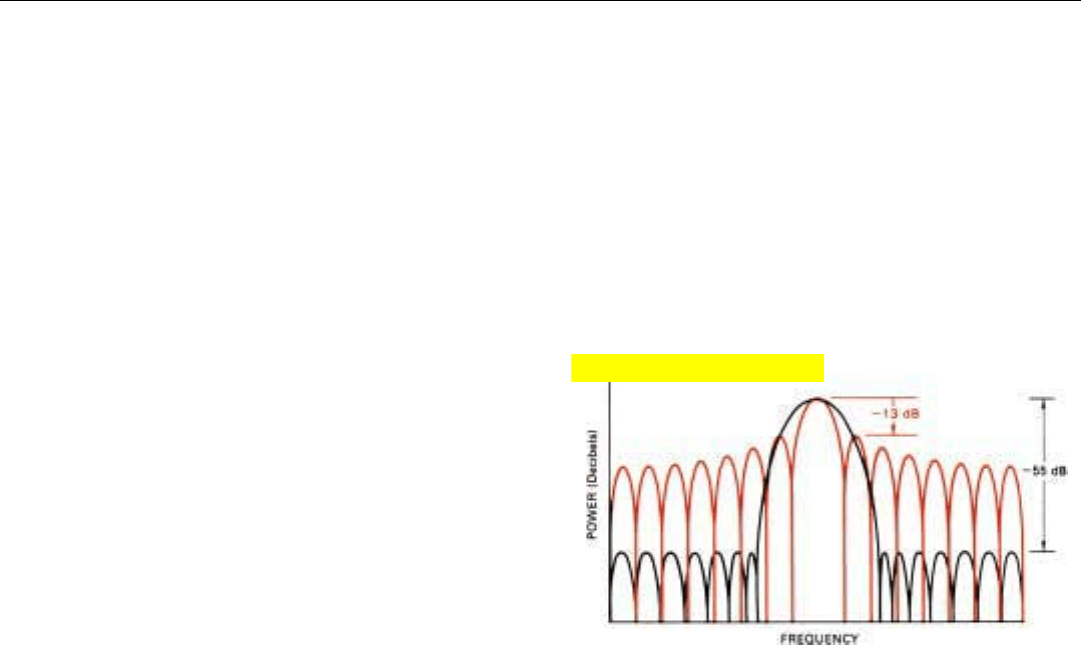
What is an acceptable sidelobe level? Naturally this
depends upon the application. The characteristic of a
weighted filter for a representative fighter application is
shown in Fig. 23.
Incidentally, even when a doppler filter’s sidelobes have
been acceptably reduced, some return will invariably get
through the sidelobes. If strong enough, therefore, return
that is outside a filter’s passband can still be detected in the
filter’s output.
For this reason, it is essential that strong ground return
be filtered out before the radar return is applied to a bank of
doppler filters.
Filtering Actual Signals
In the foregoing discussion, we considered a somewhat
artificial situation in which the numbers supplied to the fil-
ter represented a continuous train of echoes from a single
target and nothing more. How, you may ask, does the filter
respond in the real world, where echoes may be received
simultaneously from more than one target, where a target’s
echoes may be accompanied by strong ground return, and
where sometimes there may be no echoes at all, only noise?
Let us assume that the radar receiver and signal proces-
sor are reasonable “linear” and (as discussed in Chap. 18)
saturation has been avoided in all stages of receiving and
signal processing up to the filter. The input to the filter then
will simply represent the algebraic sum of the instantaneous
23. Reduction in sidelobe level achieved by weighting the inputs to
a representative doppler filter. Note broadening of passband.
Click for high-quality image