Heinrich J.G., Aldinger F. (Eds.) Ceramic Materials and Components for Engines
Подождите немного. Документ загружается.

A
b)
Pure compression
c)
Four-point uniaxial flexure
d)
Ball-on-ring biaxial flex.
e) Ring-on-ring biaxial flex.
I
I
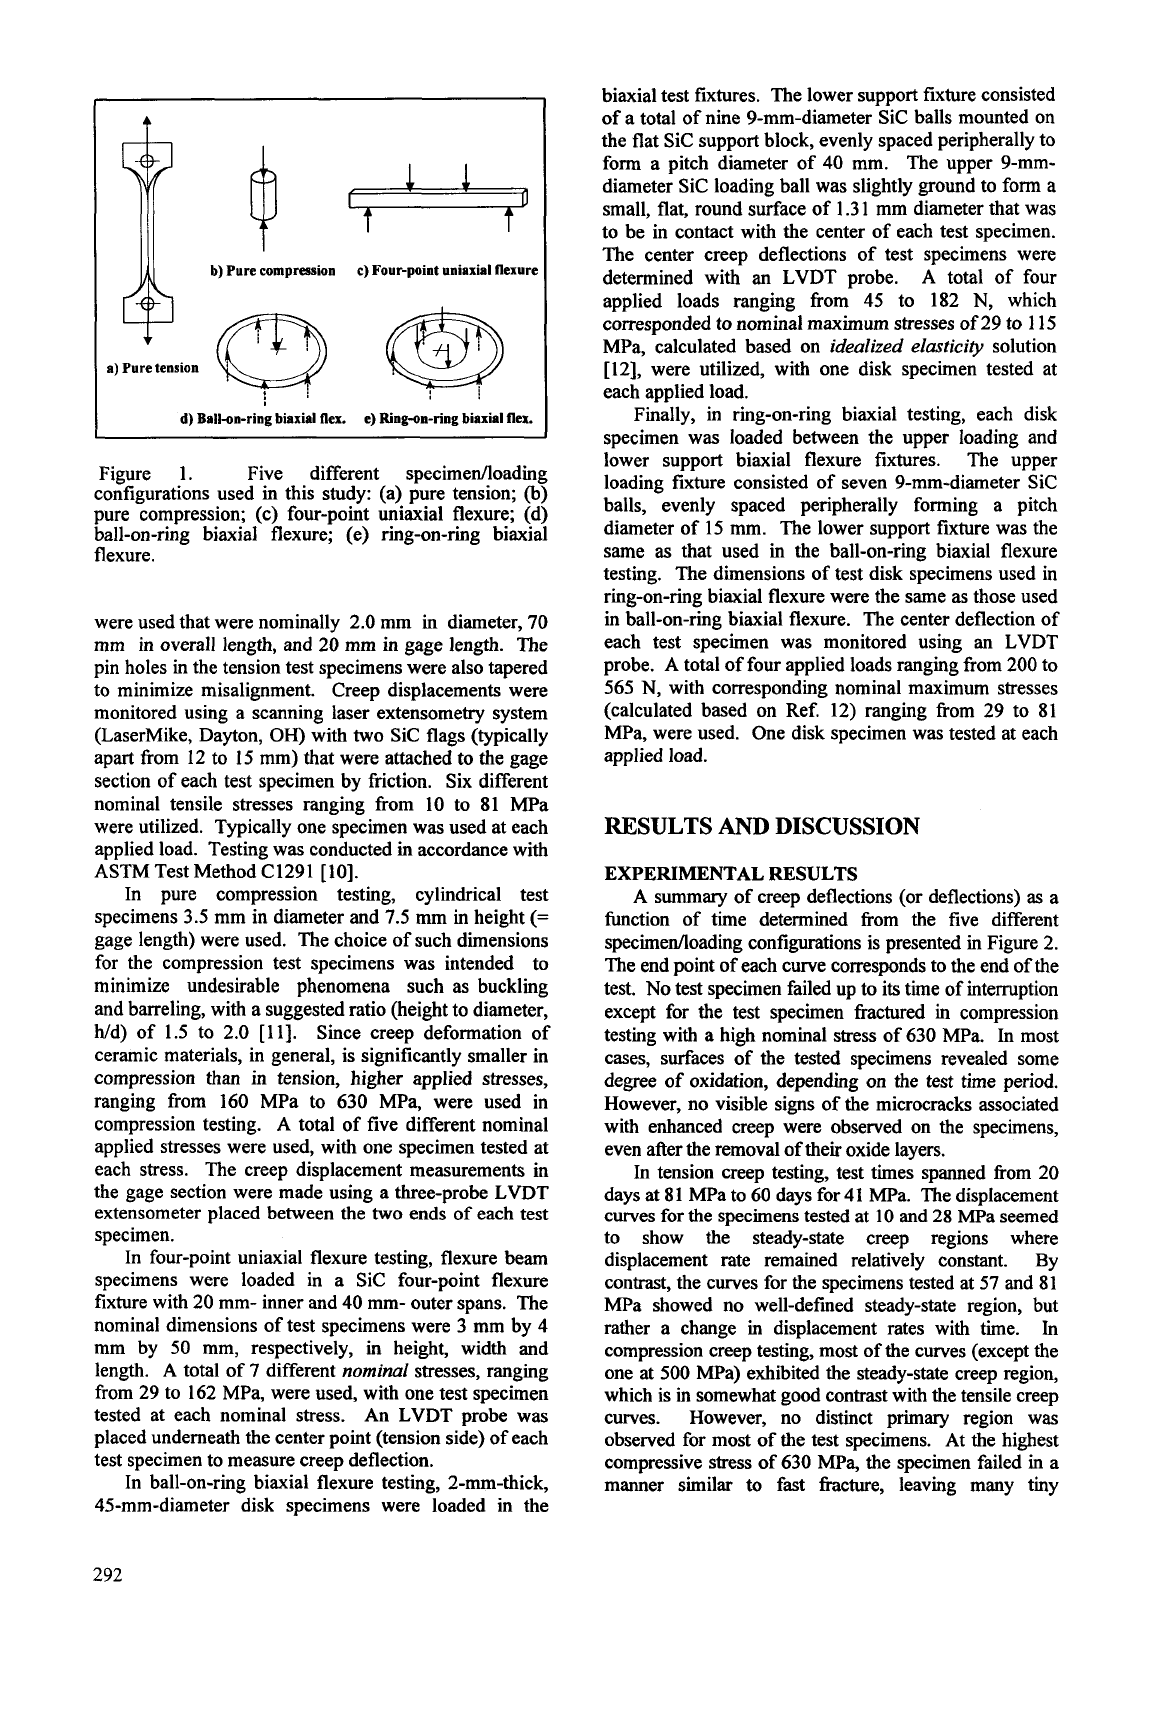
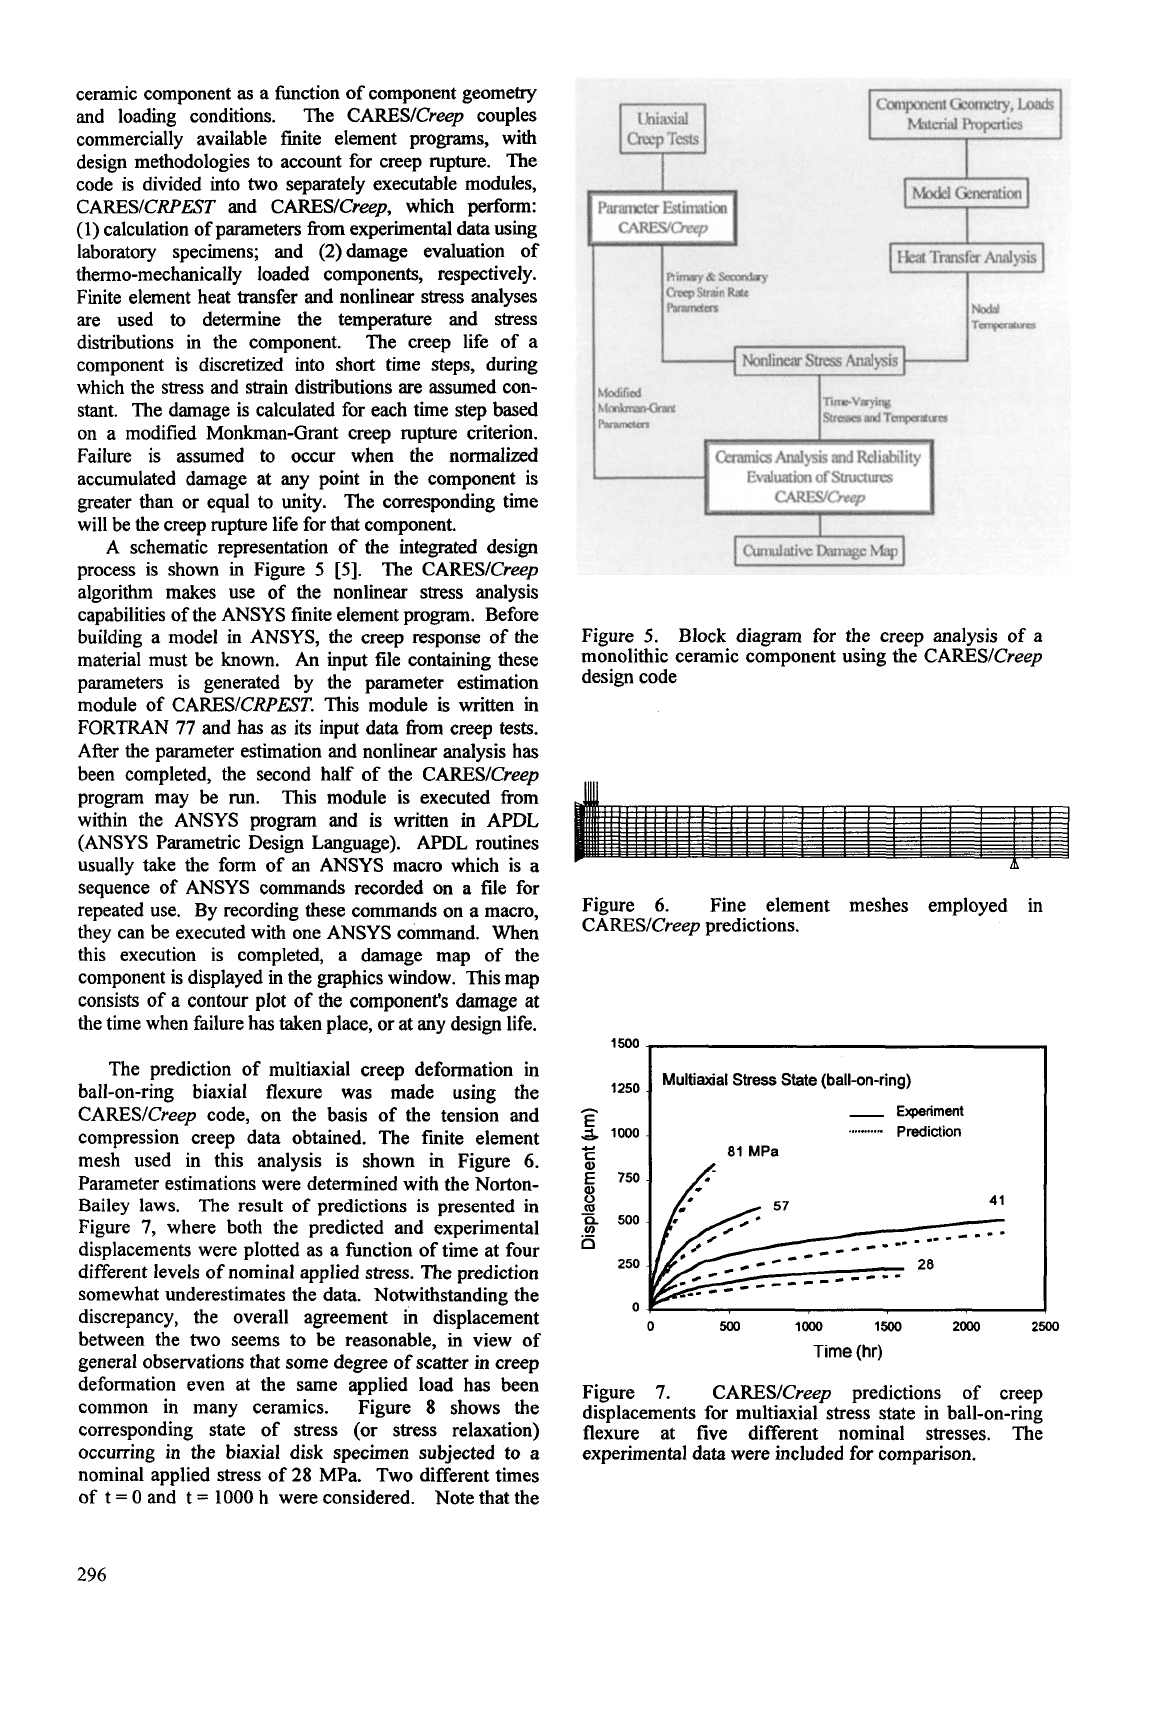
Figure 1. Five different specimedloading
configurations used in this study: (a) pure tension;
(b)
pure compression; (c) four-point uniaxial flexure; (d)
ball-on-ring biaxial flexure; (e) ring-on-ring biaxial
flexure.
were used that were nominally 2.0 mm in diameter,
70
mm in overall length, and 20 mm in gage length.
The
pin holes in the tension test specimens were also tapered
to
minimize misalignment. Creep displacements were
monitored using a scanning laser extensometry system
(LaserMike, Dayton,
OH)
with two Sic flags (typically
apart from 12 to 15 mm) that were attached to the gage
section of each test specimen by friction. Six different
nominal tensile stresses ranging from
10
to 81 MPa
were utilized. Typically one specimen was used at each
applied load. Testing was conducted in accordance with
ASTM Test Method C1291
[lo].
In pure compression testing, cylindrical test
specimens 3.5 mm in diameter and
7.5
mm in height
(=
gage length) were used. The choice of such dimensions
for the compression test specimens was intended to
minimize undesirable phenomena such as buckling
and barreling, with a suggested ratio (height
to
diameter,
Wd) of 1.5 to 2.0
[ll].
Since creep deformation of
ceramic materials, in general, is significantly smaller in
compression than in tension, higher applied stresses,
ranging from 160 MPa to 630 MPa, were used in
compression testing. A total of five different nominal
applied stresses were used, with one specimen tested at
each stress.
The creep displacement measurements in
the gage section were made using a three-probe LVDT
extensometer placed between the two ends
of
each test
specimen.
In four-point uniaxial flexure testing, flexure beam
specimens were loaded in a Sic four-point flexure
fixture with 20 mm- inner and 40 mm- outer spans. The
nominal dimensions of test specimens were 3 mm by
4
mm by
50
mm, respectively, in height, width and
length. A total of
7
different
nominal
stresses, ranging
from 29 to 162 MPa, were used, with one test specimen
tested at each nominal stress. An LVDT probe was
placed underneath the center point (tension side) of each
test specimen to measure creep deflection.
In ball-on-ring biaxial flexure testing, 2-mm-thick,
45-mm-diameter disk specimens were loaded in the
biaxial test fixtures. The lower support fixture consisted
of a total of nine 9-mm-diameter Sic balls mounted on
the flat Sic support block, evenly spaced peripherally to
form a pitch diameter of
40
mm. The upper 9-mm-
diameter Sic loading ball was slightly ground to form a
small, flat, round surface of 1.3 1 mm diameter that was
to be in contact with the center of each test specimen.
The center creep deflections
of
test specimens were
determined with an LVDT probe. A total of four
applied loads ranging from 45 to 182
N,
which
corresponded to nominal maximum stresses of 29 to 1 15
MPa, calculated based on
idealized elasticity
solution
[
121, were utilized, with one disk specimen tested at
each applied load.
Finally, in ring-on-ring biaxial testing, each disk
specimen was loaded between the upper loading and
lower support biaxial flexure fixtures.
The upper
loading fixture consisted of seven 9-mm-diameter SIC
balls, evenly spaced peripherally forming a pitch
diameter of 15 mm.
The lower support fixture was the
same
as
that used
in
the ball-on-ring biaxial flexure
testing. The dimensions of test disk specimens used in
ring-on-ring biaxial flexure were the same as those used
in ball-on-ring biaxial flexure. The center deflection of
each test specimen was monitored using an LVDT
probe. A total of four applied loads ranging from 200 to
565
N,
with corresponding nominal maximum stresses
(calculated based on Ref. 12) ranging from 29 to 81
MPa, were used. One disk specimen was tested at each
applied load.
RESULTS
AND
DISCUSSION
EXPERIMENTAL
RESULTS
A
summary
of creep deflections (or deflections)
as
a
function of time determined from the five different
specimedloading configurations is presented in Figure 2.
The end point of each curve corresponds to the end of the
test.
No
test specimen failed up to its time of interruption
except for the test specimen fractured
in
compression
testing with a high nominal stress of 630 MPa. In most
cases, surfaces of the tested specimens revealed some
degree of oxidation, depending on the test time period.
However, no visible signs of the microcracks associated
with enhanced creep were observed on the specimens,
even after the removal of their oxide layers.
In tension creep testing, test times spanned fi-om 20
days at 81 MPa to
60
days for 41 MPa. The displacement
curves for the specimens tested at
10
and
28
MPa seemed
to show the steady-state creep regions where
displacement rate remained relatively constant.
By
contrast, the curves for the specimens tested at
57
and 81
MPa showed no well-defmed steady-state region, but
rather a change in displacement rates with time. In
compression creep testing, most
of
the curves (except the
one at
500
MPa) exhibited the steady-state creep region,
which is in somewhat good contrast with the tensile creep
curves. However, no distinct primary region was
observed for most of the test specimens.
At the highest
compressive stress of 630
MPa,
the specimen failed in a
manner similar to fast fracture, leaving many tiny
292
1000
. . . .
,
*
.
, ,
,
,
*
,
,
.
NC132 SILICONNITRIDE
(4
.
8oo
-
TENSION/1300°C
0
500
1000
1500
TIME,
t
[hl
4000,
.
.
.
. . .
. . .
,
~~132
SILICON
NITRIDE
UNI-FLEXURE/ 1300°C
3000
162
MPa
2000
1000
n
0
1000
2000
TIME.
t
Ihl
~
..
2000
(4
NC132 SILICON NITRIDE
RING-ON-RING
BIAXIAL/
1300°C
loool&
500
J
16001
.
.
.
.
,
,
,
,
.
,
"2132 SILICON NITRIDE
1400
1
COMPRESSION1 1300°C
1200
1000
800
600
400
200
n
0
500
1000
TIME,
t
[h]
1000
NC132 SILICON NITRIDE
(4
BALL-ON-RING BIAXIAL/ 1300'C
800
/
1
/,lMPa
c^^
I
/
4
21
0
0
I000 2000
TIME,
t
[h]
Or
I
0
100
200
300
400
500
TIME,
t
[hi
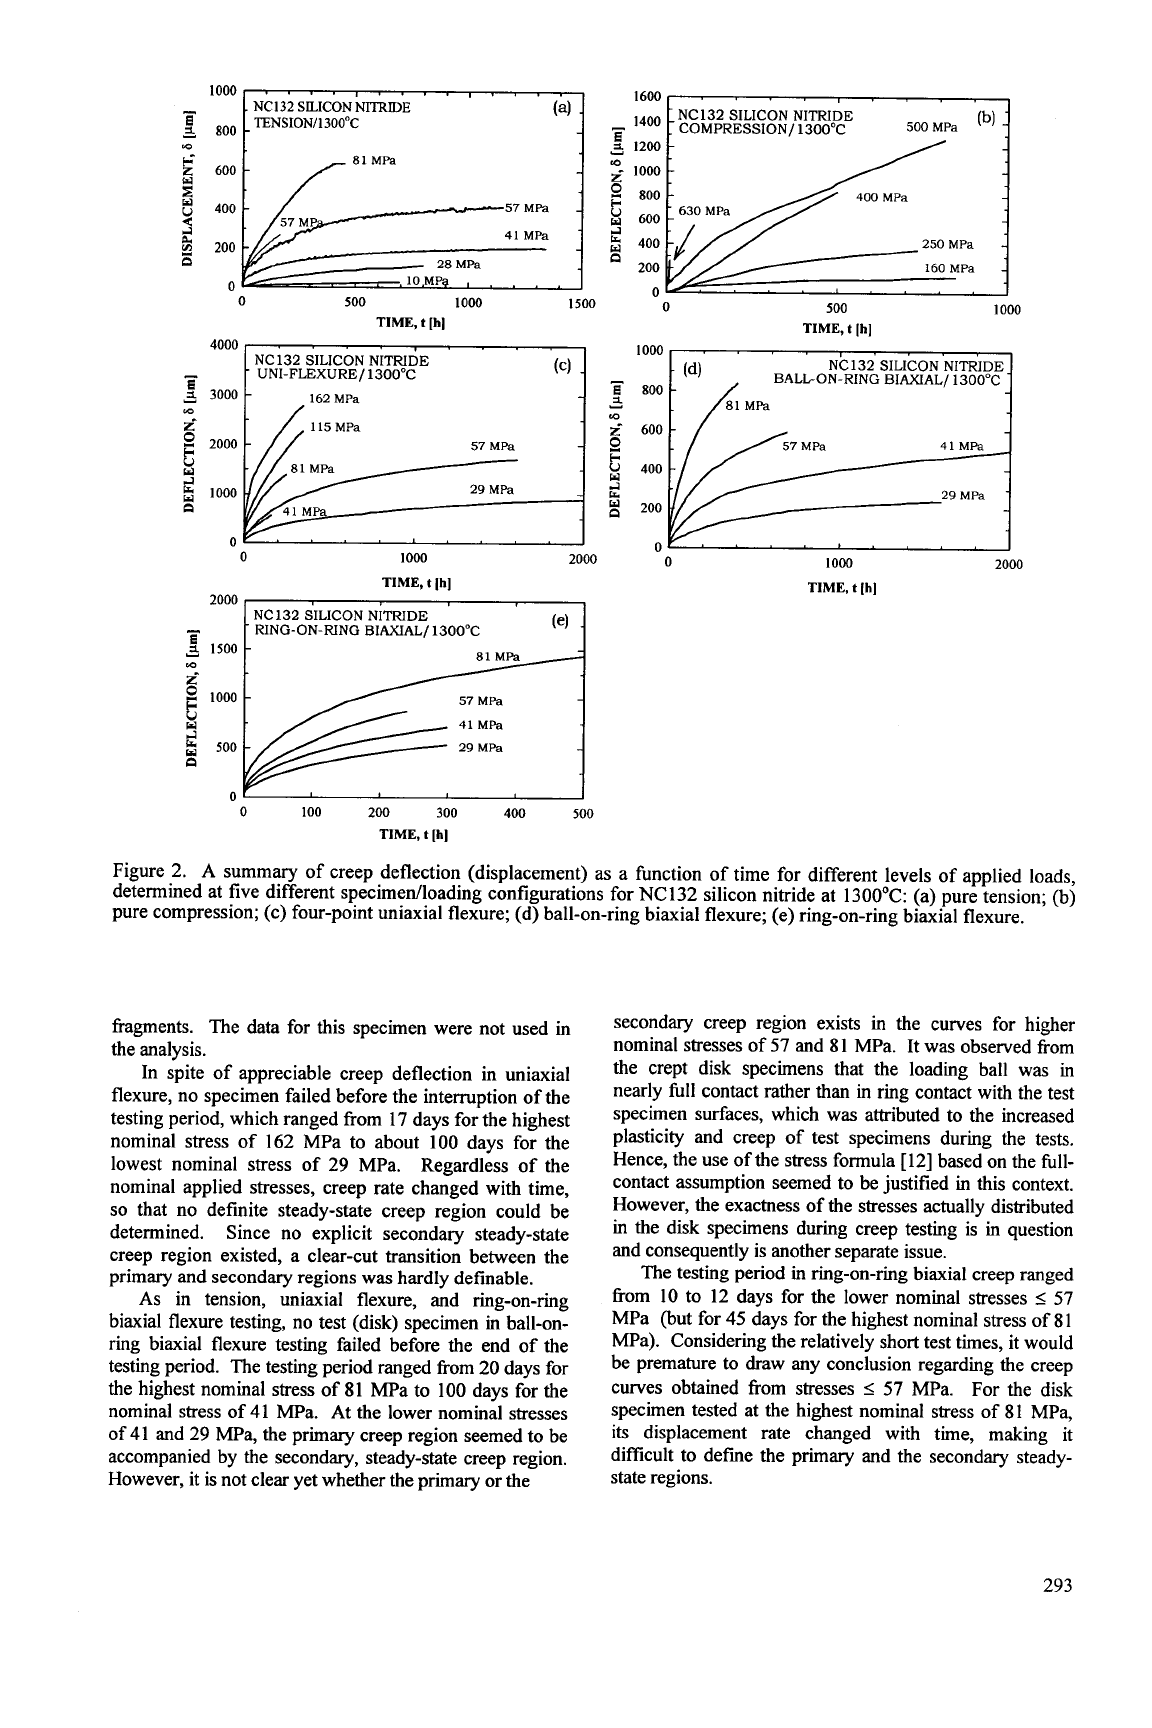
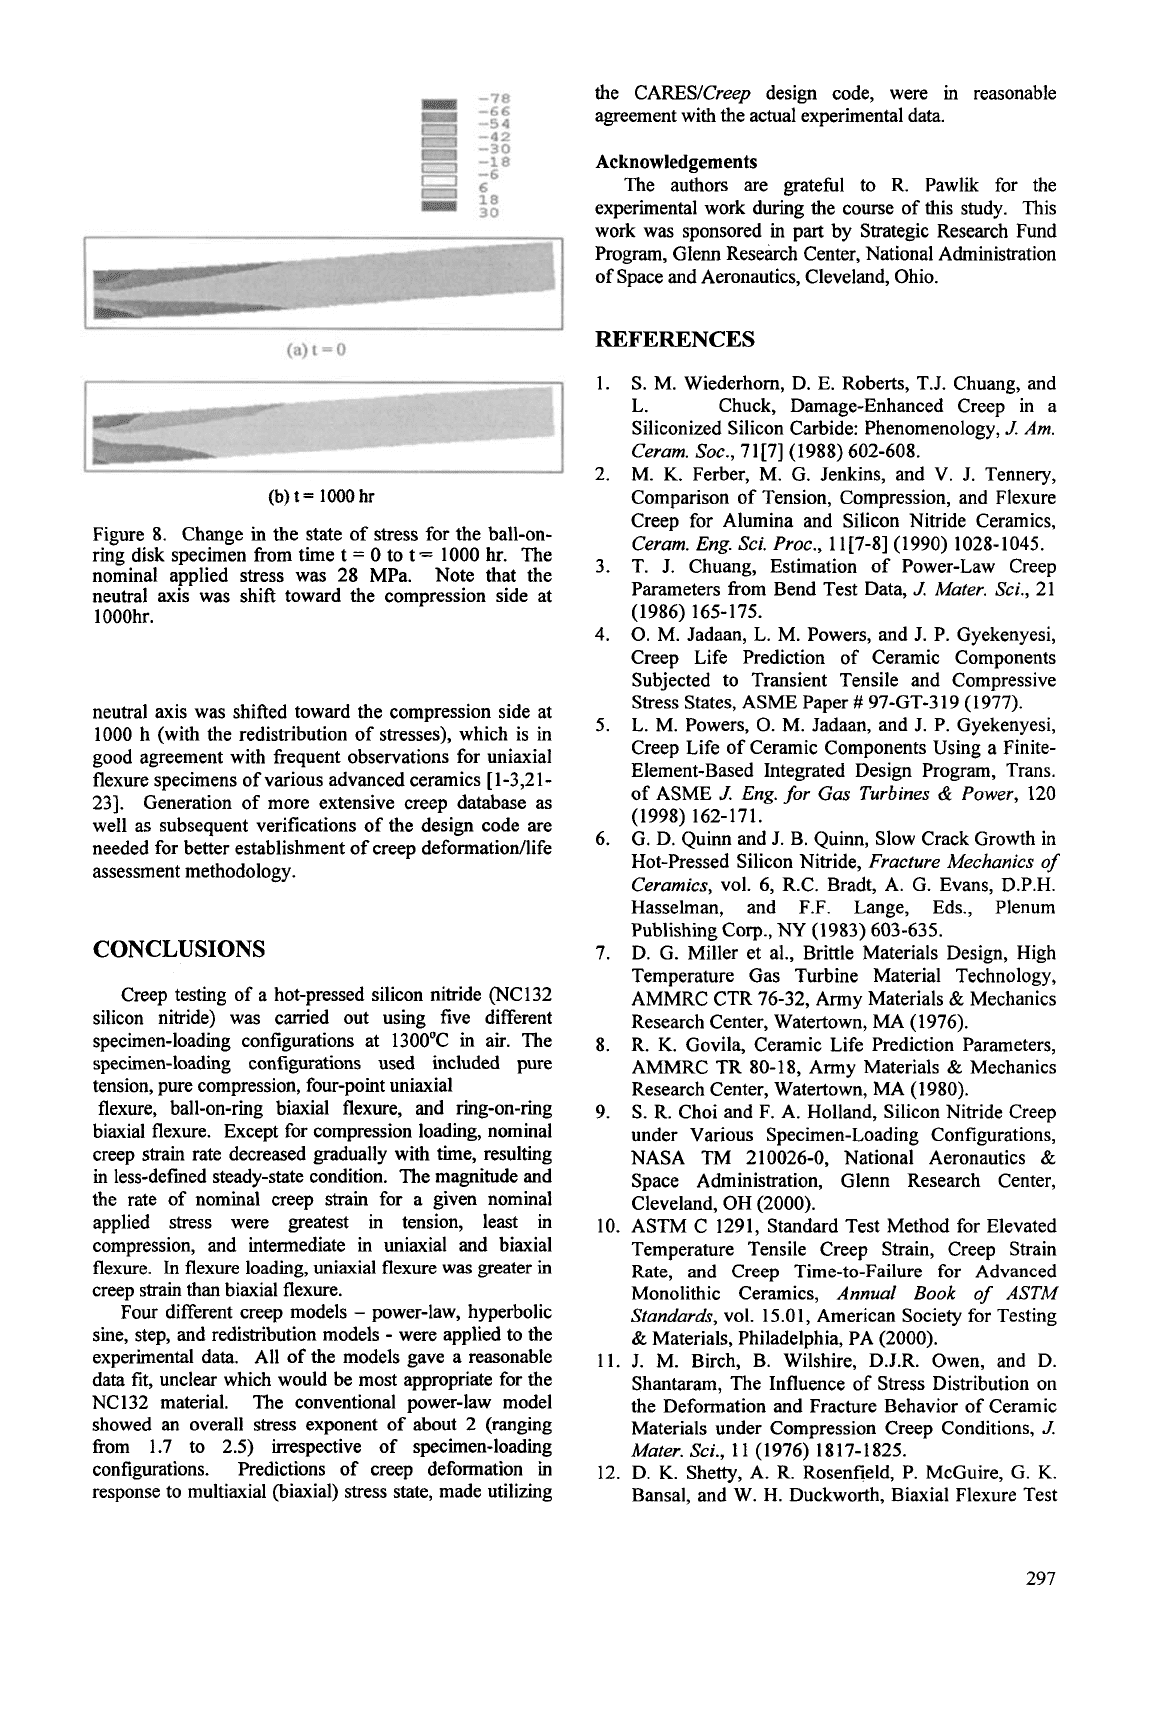
Figure
2.
A
summary of creep deflection (displacement) as a function of time for different levels of applied loads,
determined at five different specimedloading configurations for
NC132
silicon nitride at
13OOOC:
(a) pure tension; (b)
pure compression; (c) four-point uniaxial flexure; (d) ball-on-ring biaxial flexure; (e) ring-on-ring biaxial flexure.
fragments. The data for this specimen were not used in
the analysis.
In spite of appreciable creep deflection in uniaxial
flexure, no specimen failed before the interruption of the
testing period, which ranged from
17
days for the highest
nominal stress of
162
MPa to about
100
days for the
lowest nominal stress of
29
MPa. Regardless
of
the
nominal applied stresses, creep rate changed with time,
so
that no definite steady-state creep region could be
determined.
Since no explicit secondary steady-state
creep region existed, a clear-cut transition between the
primary and secondary regions
was
hardly definable.
As
in tension, uniaxial flexure, and ring-on-ring
biaxial flexure testing, no test (disk) specimen in ball-on-
ring biaxial flexure testing failed before the end
of
the
testing period. The testing period ranged from
20
days for
the highest nominal stress of
8
1
MPa to
100
days for the
nominal stress of
41
MPa.
At the lower nominal stresses
of
41
and
29
MPa, the primary creep region seemed to be
accompanied by the secondary, steady-state creep region.
However, it is not clear yet whether the primary or the
secondary creep region exists in the curves for higher
nominal stresses of
57
and
81
MPa. It was observed from
the crept disk specimens that the loading ball
was
in
nearly
full
contact rather than in ring contact with the test
specimen surfaces, which was attributed to the increased
plasticity and creep of test specimens during the tests.
Hence, the use of the stress formula
[
121
based on the
full-
contact assumption seemed to be justified in this context.
However, the exactness of the stresses actually distributed
in the disk specimens during creep testing is in question
and consequently is another separate issue.
The testing period in ring-on-ring biaxial creep ranged
from
10
to
12
days for the lower nominal stresses
I
57
MPa (but for
45
days for the highest nominal stress of
81
ma). Considering the relatively short test times, it would
be premature to draw any conclusion regarding the creep
curves obtained from stresses
I
57
MPa. For the disk
specimen tested at the highest nominal stress of
81
MPa,
its displacement rate changed with time, making it
difficult to defme the primary and the secondary steady-
state regions.
293
0.04
.
-
-
0
I
-
*
-
I
*
-
’
-
NC132 SILICON
NITRIDE
130OoC/57MPa
0.02
UNIAXIAL FLEXURE
BALL-ON-RING BlAXIAL
0.00
0
500
lo00
1500
TIME,
t
[h]
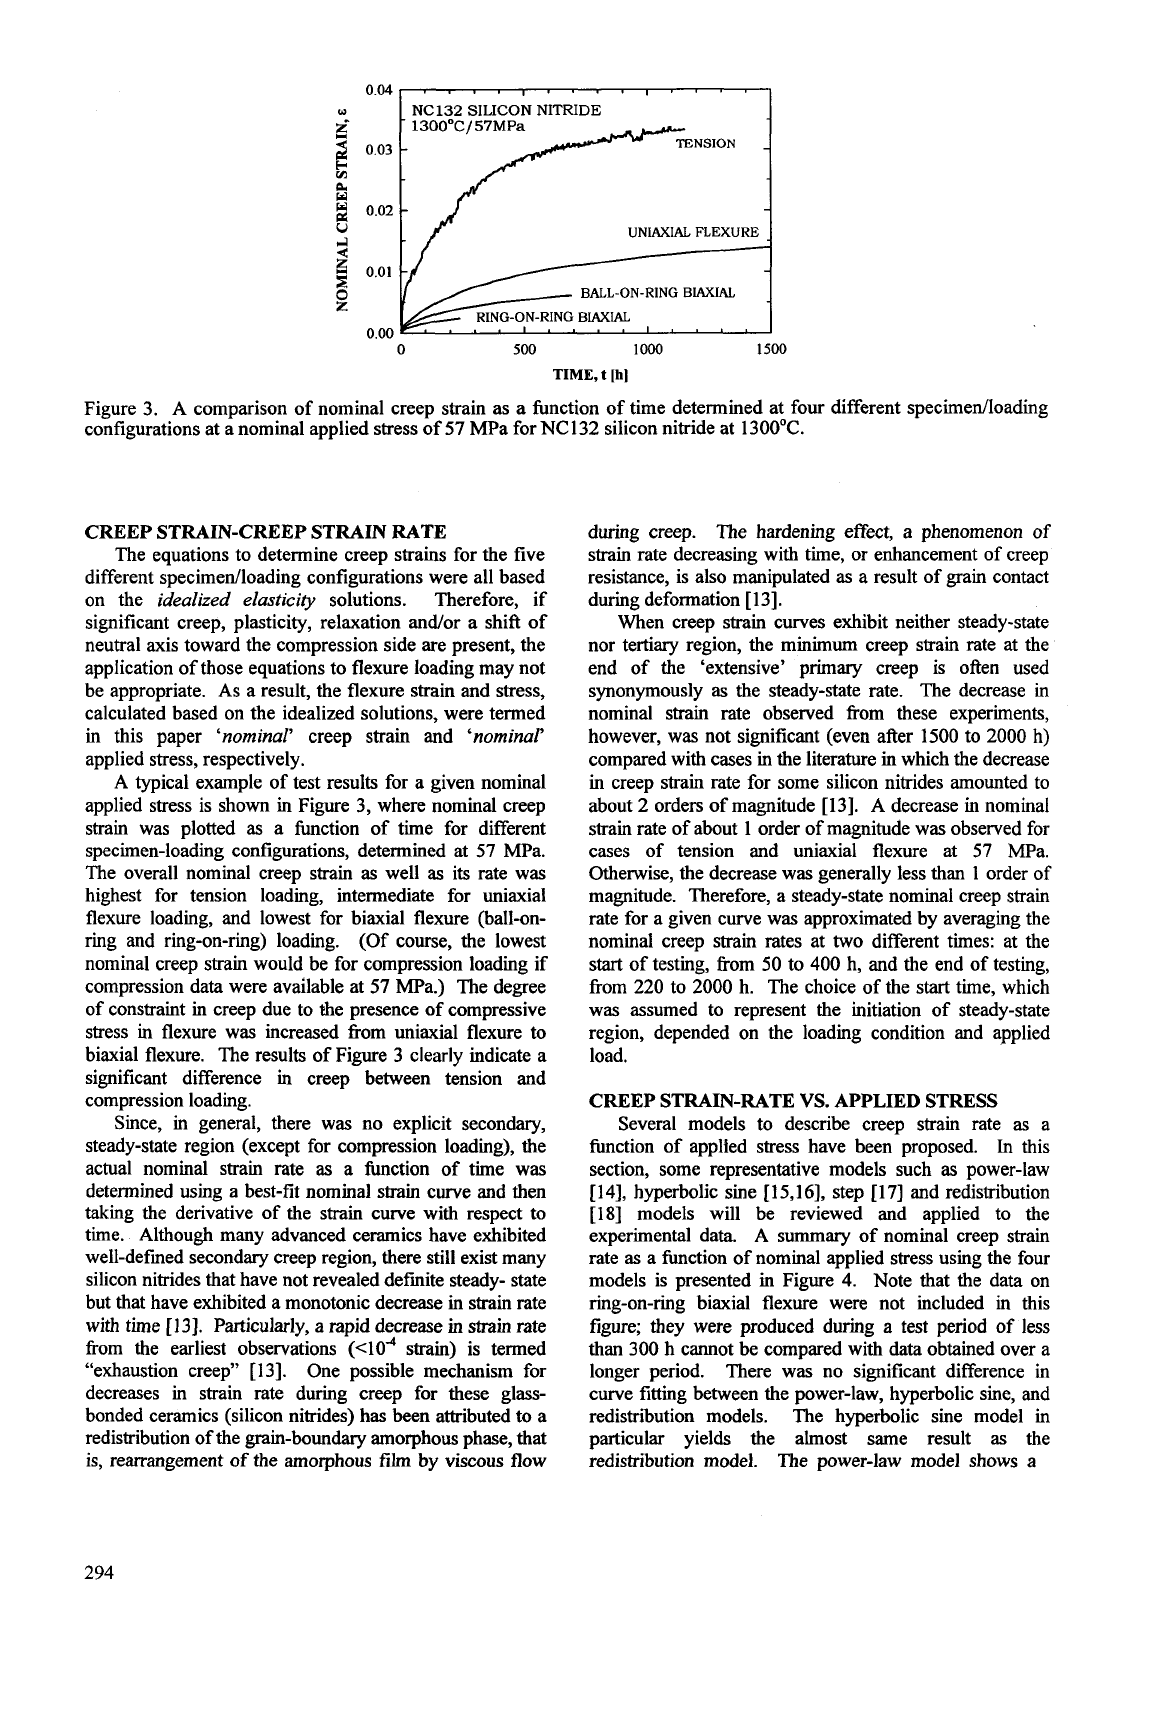
Figure
3.
A comparison of nominal creep strain as a function of time determined at four different specimedloading
configurations at a nominal applied stress of
57
MPa for
NC132
silicon nitride at
1300°C.
CREEP STRAIN-CREEP STRAIN RATE
The equations to determine creep strains for the five
different specimedloading configurations were all based
on the
idealized elasticity
solutions. Therefore, if
significant creep, plasticity, relaxation and/or a shift of
neutral axis toward the compression side are present, the
application of those equations to flexure loading may not
be appropriate. As a result, the flexure strain and stress,
calculated based on the idealized solutions, were termed
in this paper
‘nominal)
creep strain and
‘nominal’
applied stress, respectively.
A typical example of test results for a given nominal
applied stress is
shown in Figure
3,
where nominal creep
strain was plotted
as
a function of time for different
specimen-loading configurations, determined at
57
MPa.
The overall nominal creep strain
as
well
as
its rate was
highest for tension loading, intermediate for uniaxial
flexure loading, and lowest for biaxial flexure (ball-on-
ring and ring-on-ring) loading. (Of course, the lowest
nominal creep strain would be for compression loading if
compression data were available at
57
MPa.) The degree
of constraint in creep due to the presence of compressive
stress in flexure was increased from uniaxial flexure to
biaxial flexure. The results
of
Figure
3
clearly indicate a
significant difference in creep between tension and
compression loading.
Since, in general, there was no explicit secondary,
steady-state region (except for compression loading), the
actual nominal strain rate
as
a function of time was
determined using
a
best-fit nominal strain curve and then
taking the derivative
of
the strain curve with respect to
time. Although many advanced ceramics have exhibited
well-defined secondary creep region, there still exist many
silicon nitrides that have not revealed defmite steady- state
but that have exhibited a monotonic decrease
in strain rate
with time
[13].
Particularly, a rapid decrease in strain rate
from the earliest observations
(<lo4
strain) is termed
“exhaustion creep”
[
131.
One possible mechanism for
decreases in strain rate during creep for these glass-
bonded ceramics (silicon nitrides)
has
been attributed to a
redistribution of the grain-boundary amorphous phase, that
is, rearrangement of the amorphous film by viscous flow
during creep. The hardening effect, a phenomenon
of
strain rate decreasing with time, or enhancement of creep
resistance, is also manipulated
as
a result of grain contact
during deformation
[
131.
When creep strain curves exhibit neither steady-state
nor tertiary region, the minimum creep strain rate at the
end of the ‘extensive’ primary creep is often used
synonymously
as
the steady-state rate. The decrease in
nominal strain rate observed from these experiments,
however, was not significant (even after
1500
to
2000
h)
compared with cases in the literature in which the decrease
in creep strain rate for some silicon nitrides amounted to
about
2
orders
of
magnitude
[13].
A decrease in nominal
strain rate of about
1
order of magnitude was observed for
cases of tension and uniaxial flexure at
57
MPa.
Otherwise, the decrease was generally less than
1
order
of
magnitude. Therefore, a steady-state nominal creep strain
rate for a given curve was approximated by averaging the
nominal creep strain rates at two different times: at the
start
of testing, from
50
to
400
h, and the end of testing,
from
220
to
2000
h. The choice of the
start
time, which
was assumed to represent the initiation of steady-state
region, depended on the loading condition and applied
load.
CREEP STRAIN-RATE
VS.
APPLIED STRESS
Several models to describe creep strain rate
as
a
function of applied stress have been proposed.
In
this
section, some representative models such
as
power-law
[
141,
hyperbolic sine
[
15,161,
step
[
171
and redistribution
[18]
models will be reviewed and applied to the
experimental data. A summary of nominal creep strain
rate
as
a function
of
nominal applied stress using the four
models is presented in Figure
4.
Note that the data on
ring-on-ring biaxial flexure were not included in this
figure; they were produced during a test period
of
less
than
300
h cannot be compared with data obtained over a
longer period. There was no significant difference in
curve fitting between the power-law, hyperbolic sine, and
redistribution models. The hyperbolic sine model in
particular yields the almost same result
as
the
redistribution model. The power-law model shows
a
294
10-5
.
I
I
(a)
NORTON'S
LAW
10"
-
10"
lo-1.1
(b)
HYPERBOLIC
SINE
MODEL
-
1
IO-lll
I I
I
10
100
1000
NOMINAL APPLIED STRESS,
r~
[MPal
10-5
I
I
1
10-5
-
(c)
STEP
MODEL
10-7
-
10-8
-
10-9
-/
10'0-
lo-"
I
10
100
1000
NOMINAL APPLIED STRESS,
u
[MPnl
10-'0
lo-"
10
100
1000
NOMINAL APPLIED STRESS,
u
[MPal
I
(d)
REDISTRIBUTION MODEL
10-10
lo-"
10
100 1000
NOMINAL APPLIED STRESS,
u
[MPa]
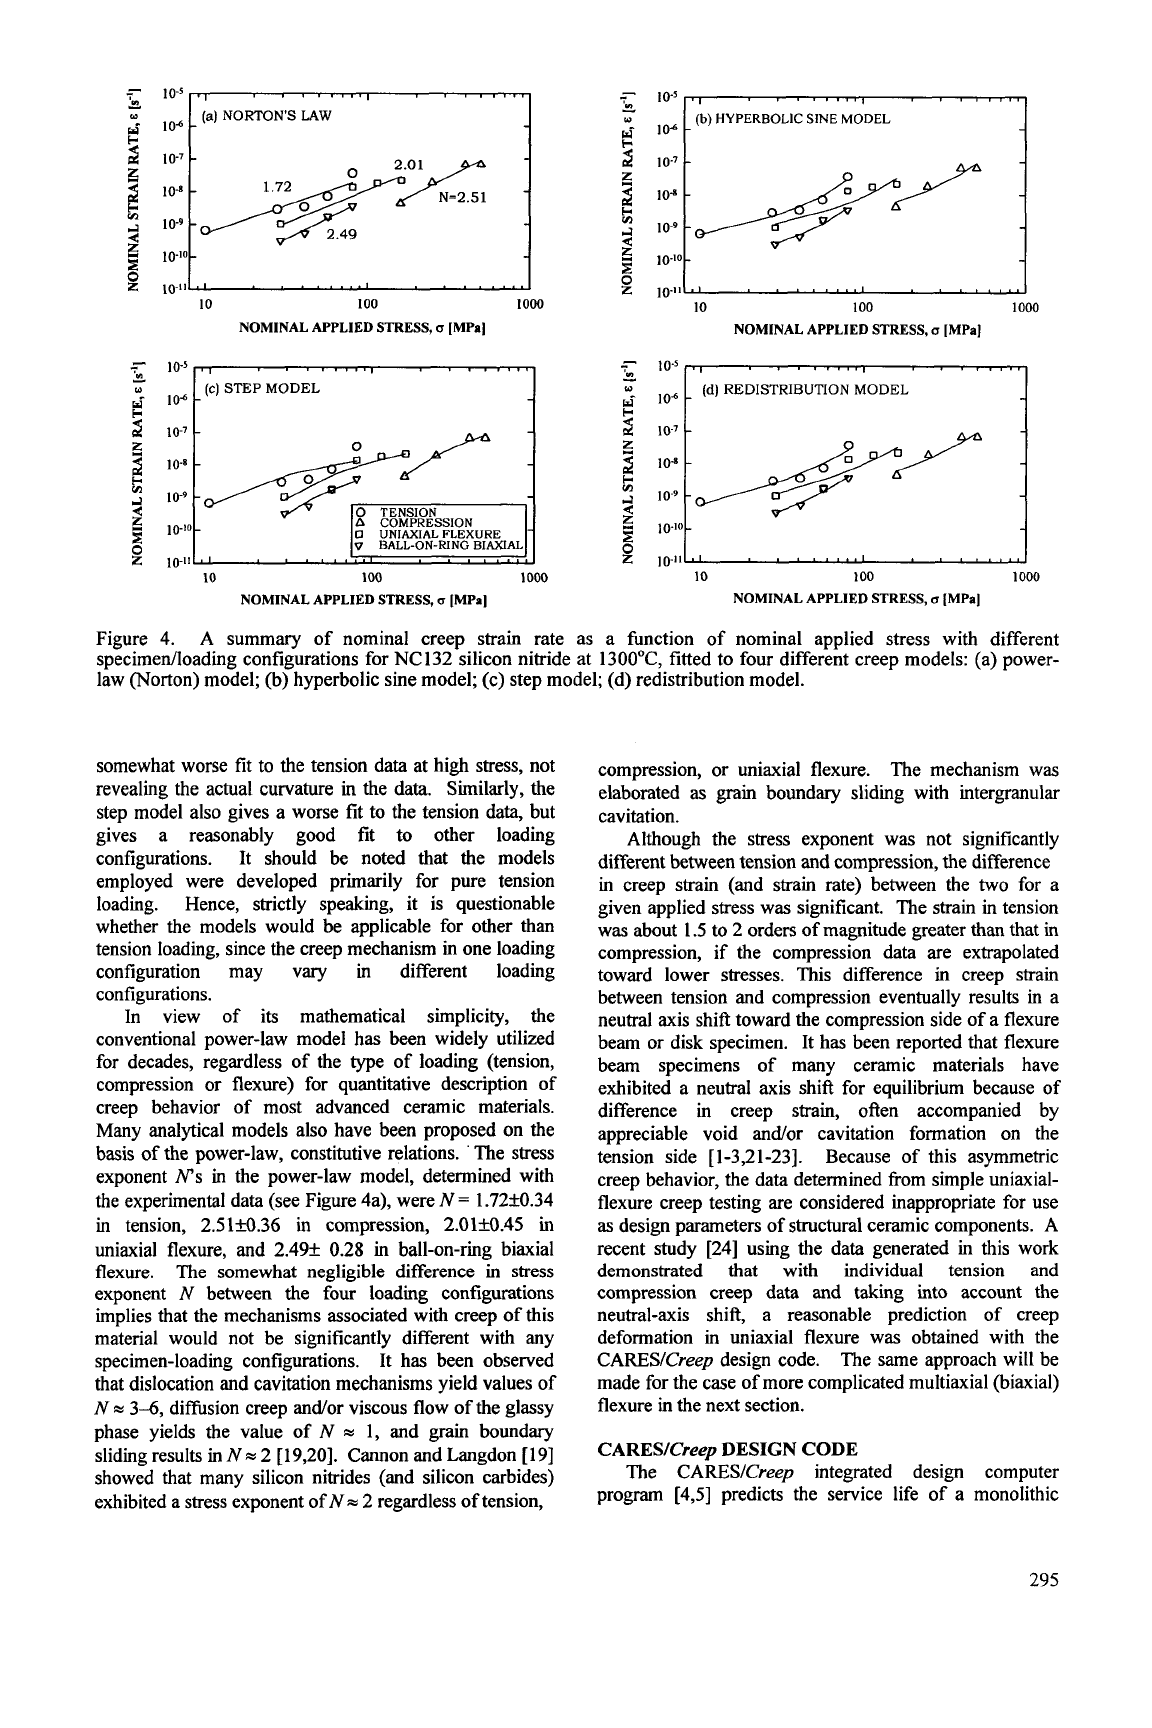
4.
A summarv of nominal creeD strain rate as a function of nominal amlied stress with different
specimedloading confi&rations for NC 132*silicon nitride at 13OO0C, fitted to four differ&t creep models: (a) power-
law (Norton) model;
(b)
hyperbolic sine model; (c) step model; (d) redistribution model.
somewhat worse fit to the tension data at high stress, not
revealing the actual curvature in the data.
Similarly, the
step model also gives a worse
fit
to
the tension data, but
gives a reasonably good fit to other loading
configurations. It should be noted that the models
employed were developed primarily for pure tension
loading. Hence, strictly speaking, it is questionable
whether the models would be applicable for other than
tension loading, since the creep mechanism in one loading
configuration may vary in different loading
configurations.
In view of its mathematical simplicity, the
conventional power-law model has been widely utilized
for decades, regardless of the
type
of loading (tension,
compression
or
flexure) for quantitative description of
creep behavior of most advanced ceramic materials.
Many analytical models also have been proposed on the
basis
of
the power-law, constitutive relations.
'
The stress
exponent
IPS
in the power-law model, determined with
the experimental data (see Figure 4a), were
N
=
1.72k0.34
in tension, 2.51k0.36 in compression,
2.01M.45
in
uniaxial flexure, and
2.49f 0.28
in ball-on-ring biaxial
flexure.
The
somewhat negligible difference
in
stress
exponent
N
between the four loading configurations
implies that the mechanisms associated with creep of this
material would not be significantly different with any
specimen-loading configurations. It has been observed
that dislocation and cavitation mechanisms yield values
of
N
=
3-6, diffusion creep andor viscous flow of the glassy
phase yields the value of
N
=
1, and grain boundary
sliding results in
N
=
2
[
19,201. Cannon and Langdon
[
191
showed that many silicon nitrides (and silicon carbides)
exhibited a stress exponent of
N
=
2 regardless of tension,
compression, or uniaxial flexure.
The mechanism was
elaborated
as
grain boundary sliding with intergranular
cavitation.
Although the stress exponent was not significantly
different between tension and compression, the difference
in creep strain (and strain rate) between the two for a
given applied stress was significant. The strain in tension
was about 1.5 to 2 orders of magnitude greater than that in
compression, if the compression data are extrapolated
toward lower stresses. This difference in creep strain
between tension and compression eventually results in a
neutral axis shift toward the compression side of a flexure
beam or disk specimen. It has been reported that flexure
beam specimens of many ceramic materials have
exhibited a neutral axis shift for equilibrium because of
difference in creep strain, often accompanied by
appreciable void andor cavitation formation on the
tension side
[
1-3,21-231.
Because of this asymmetric
creep behavior, the data determined from simple uniaxial-
flexure creep testing are considered inappropriate for use
as
design parameters of structural ceramic components. A
recent study
[24]
using the data generated in this work
demonstrated that with individual tension and
compression creep data and taking into account the
neutral-axis shift, a reasonable prediction of creep
deformation in uniaxial flexure was obtained with the
CARESICreep design code. The same approach will be
made for the case of more complicated multiaxial (biaxial)
flexure in the next section.
CARESICreep DESIGN CODE
The CARESICreep integrated design computer
program [4,5] predicts the service life of a monolithic
295
ceramic component
as
a hction of component geometry
and loading conditions. The CARESICreep couples
commercially available finite element programs, with
design methodologies to account for creep rupture. The
code is divided into
two
separately executable modules,
CARESICWEST and CARESICreep, which perform:
(1)
calculation of parameters from experimental data using
laboratory specimens; and
(2)
damage evaluation of
thermo-mechanically loaded components, respectively.
Finite element heat transfer and nonlinear stress analyses
are used to determine the temperature and stress
distributions in the component. The creep life of a
component
is
discretized into short time steps, during
which the stress and strain distributions are assumed con-
stant. The damage is calculated for each time step based
on a modified Monkman-Grant creep rupture criterion.
Failure is assumed to occur when the normalized
accumulated damage at any point in the component is
greater than or equal to unity. The corresponding time
will be the creep rupture life for that component.
A schematic representation of the integrated design
process is shown in Figure
5 [5].
The CARESICreep
algorithm makes use of the nonlinear stress analysis
capabilities of the ANSYS finite element program. Before
building a model in ANSYS, the creep response of the
material must be
known.
An input file containing these
parameters is generated by the parameter estimation
module of CARESICRPEST. This module is written in
FORTRAN
77
and has
as
its input data
hm
creep tests.
After the parameter estimation and nonlinear analysis has
been completed, the second half of the CARESICreep
program may be
run.
This module is executed from
within the ANSYS program and is written in APDL
(ANSYS Parametric Design Language). APDL routines
usually take the form of an ANSYS macro which is a
sequence of ANSYS commands recorded on a file for
repeated use. By recording these commands on a macro,
they can be executed with one ANSYS command. When
this execution is completed, a damage map of the
component is displayed in the graphics window. This map
consists
of
a contour plot of the component's damage at
the time when failure has taken place, or at any design life.
The prediction of multiaxial creep deformation in
ball-on-ring biaxial flexure was made using the
CARESICreep code, on the basis of the tension and
compression creep data obtained. The fmite element
mesh used in this analysis is shown
in
Figure
6.
Parameter estimations were determined with the Norton-
Bailey laws.
The
result
of predictions
is
presented
in
Figure
7,
where both the predicted and experimental
displacements were plotted as a function of time at four
different levels of nominal applied stress. The prediction
somewhat underestimates the data. Notwithstanding the
discrepancy, the overall agreement in displacement
between the two seems to be reasonable, in view of
general observations that some degree of scatter in creep
deformation even at the same applied load has been
common in many ceramics. Figure
8
shows the
corresponding state of stress (or stress relaxation)
occurring in the biaxial disk specimen subjected to a
nominal applied stress of
28
MPa. Two different times
of t
=
0
and t
=
1000
h were considered. Note that the
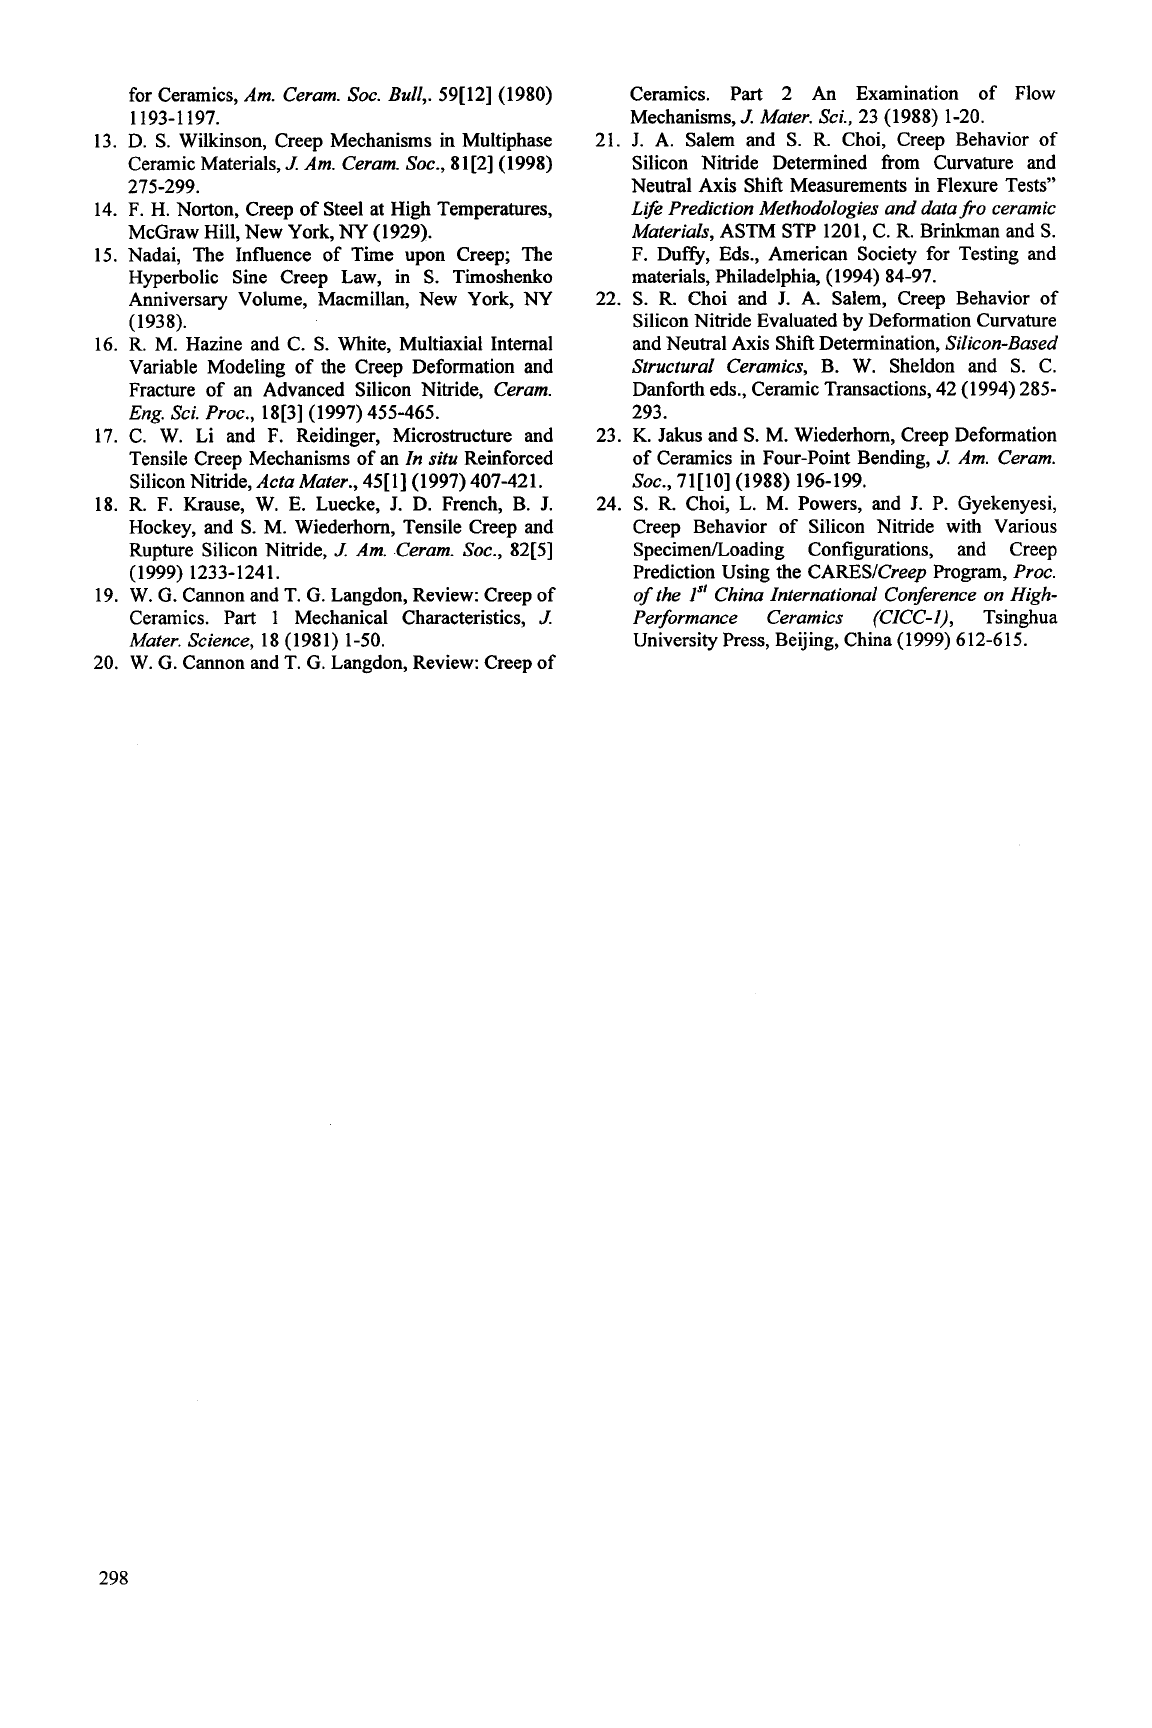
Figure
5.
Block diagram for the creep analysis of a
monolithic ceramic component using the CARESICreep
design code
Figure
6.
Fine element meshes employed in
CARESICreep predictions.
1500
I
I
,250
1
Multiaxial Stress State (ball-on-ring)
a
I000
I
-
Experiment
...
........
Prediction
750
500
250
0
I
81
MPa
I
41
0
500
lo00
1500
2000
2500
Time
(hr)
Figure
7.
CARESICreep predictions of creep
displacements for multiaxial stress state in ball-on-ring
flexure at five different nominal stresses. The
experimental data were included for comparison.
296
I
(a)
t
=
0
(b)
t
=
1000
hr
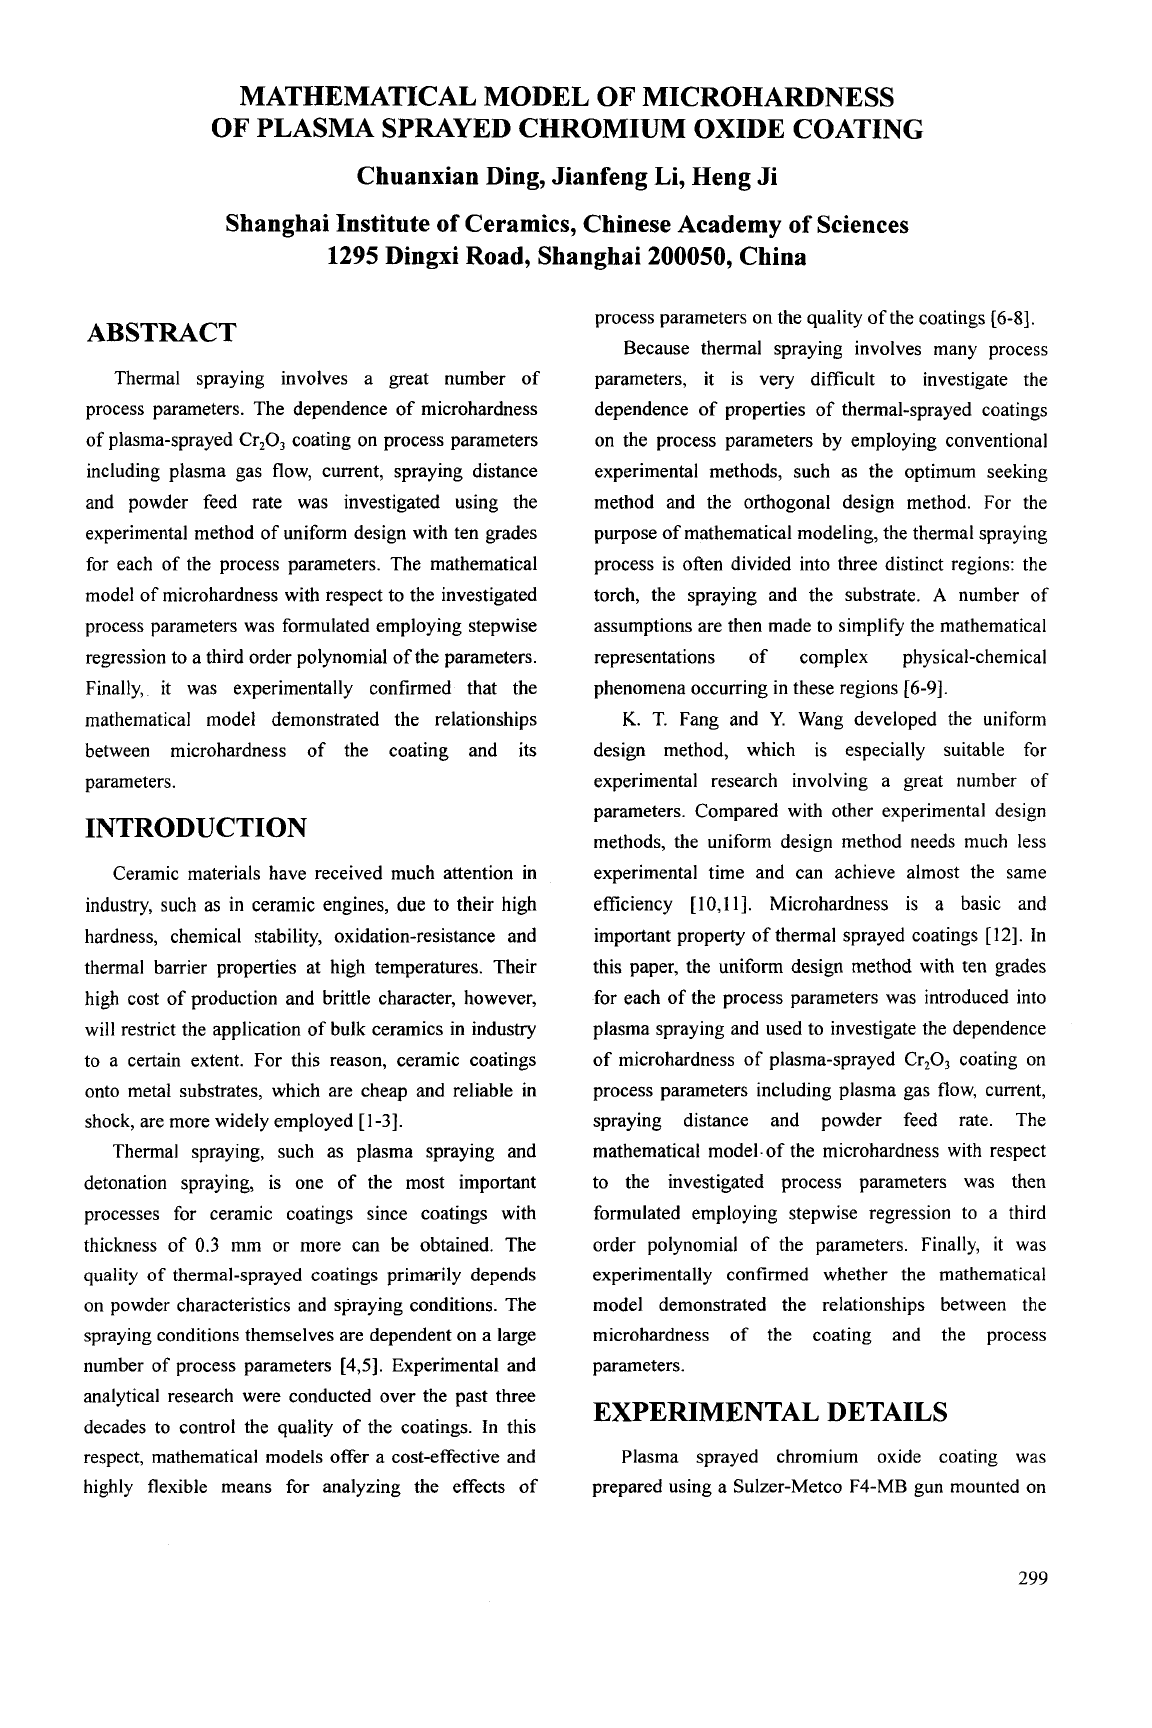
Figure 8. Change
in
the state of stress for the ball-on-
ring disk specimen from time t
=
0
to t
=
1000
hr.
The
nominal applied stress was 28 MPa. Note that the
neutral axis was shift toward the compression side at
1000hr.
neutral axis was shifted toward the compression side at
1000 h (with the redistribution of stresses), which is in
good agreement with frequent observations for uniaxial
flexure specimens of various advanced ceramics
[
1-3,2 1-
231. Generation of more extensive creep database as
well as subsequent verifications of the design code are
needed for better establishment of creep deformatiodife
assessment methodology.
CONCLUSIONS
Creep testing of a hot-pressed silicon nitride (NC 132
silicon nitride) was carried out using five different
specimen-loading configurations at 1300'C in air. The
specimen-loading configurations used included pure
tension, pure compression, four-point uniaxial
flexure, ball-on-ring biaxial flexure, and ring-on-ring
biaxial flexure. Except for compression loading, nominal
creep strain rate decreased gradually with time, resulting
in less-defined steady-state condition. The magnitude and
the rate of nominal creep
strain
for a given nominal
applied stress were greatest in tension, least in
compression, and intermediate in uniaxial and biaxial
flexure.
In
flexure loading, uniaxial flexure
was
greater
in
creep strain than biaxial flexure.
Four different creep models
-
power-law, hyperbolic
sine, step, and redistribution models
-
were applied to the
experimental data. All of the models gave a reasonable
data fit, unclear which would be most appropriate for the
NC 132 material. The conventional power-law model
showed an overall stress exponent
of
about
2
(ranging
from 1.7 to 2.5) irrespective of specimen-loading
configurations. Predictions of creep deformation in
response to multiaxial (biaxial) stress state, made utilizing
the
CARESICreep
design code, were in reasonable
agreement with the actual experimental data.
Acknowledgements
The authors are grateful to R. Pawlik for the
experimental work during the course of this study. This
work was sponsored in part by Strategic Research Fund
Program,
Glenn Research Center, National Administration
of Space and Aeronautics, Cleveland, Ohio.
REFERENCES
1.
2.
3.
4.
5.
6.
7.
8.
9.
10.
11.
12.
S.
M. Wiederhorn, D.
E.
Roberts, T.J. Chuang, and
L. Chuck, Damage-Enhanced Creep
in
a
Siliconized Silicon Carbide: Phenomenology,
J.
Am.
Ceram.
SOC.,
71[7] (1988) 602-608.
M.
K.
Ferber, M. G. Jenkins, and V. J. Tennery,
Comparison of Tension, Compression, and Flexure
Creep for Alumina and Silicon Nitride Ceramics,
Ceram. Eng. Sci. Proc.,
11[7-81 (1990) 1028-1045.
T. J. Chuang, Estimation of Power-Law Creep
Parameters from Bend Test Data,
J.
Muter.
Sci.,
21
0.
M. Jadaan, L. M. Powers, and J. P. Gyekenyesi,
Creep Life Prediction of Ceramic Components
Subjected to Transient Tensile and Compressive
Stress States, ASME Paper
#
97-GT-3 19
(1
977).
L. M. Powers,
0.
M. Jadaan, and J. P. Gyekenyesi,
Creep Life of Ceramic Components Using a Finite-
Element-Based Integrated Design Program, Trans.
of ASME
J.
Eng.
for Gas Turbines
&
Power,
120
G. D. Quinn and J. B. Quinn, Slow Crack Growth in
Hot-Pressed Silicon Nitride,
Fracture Mechanics
of
Ceramics,
vol. 6, R.C. Bradt, A. G. Evans, D.P.H.
Hasselman, and F.F. Lange, Eds., Plenum
Publishing Corp.,
NY
(1983) 603-635.
D. G. Miller et al., Brittle Materials Design, High
Temperature Gas Turbine Material Technology,
AMMRC CTR 76-32, Army Materials
&
Mechanics
Research Center, Watertown,
MA
(1976).
R.
K.
Govila, Ceramic Life Prediction Parameters,
AMMRC TR 80-18, Army Materials
&
Mechanics
Research Center, Watertown, MA
(1
980).
S.
R. Choi and F. A. Holland, Silicon Nitride Creep
under Various Specimen-Loading Configurations,
NASA
TM
210026-0, National Aeronautics
&
Space Administration, Glenn Research Center,
Cleveland, OH (2000).
ASTM C 1291, Standard Test Method for Elevated
Temperature Tensile Creep Strain, Creep Strain
Rate, and Creep Time-to-Failure for Advanced
Monolithic Ceramics,
Annual
Book
of
ASTM
Standards,
vol. 15.01, American Society for Testing
&
Materials, Philadelphia, PA (2000).
J.
M.
Birch, B. Wilshire, D.J.R. Owen, and D.
Shantaram, The Influence
of
Stress Distribution on
the Deformation and Fracture Behavior of Ceramic
Materials under Compression Creep Conditions,
J.
Muter.
Sci.,
11 (1976) 1817-1825.
D.
K.
Shetty, A. R. Rosenfield, P. McGuire, G.
K.
Bansal, and W. H. Duckworth, Biaxial Flexure Test
(1986) 165-175.
(1998) 162-171.
297
for Ceramics,
Am.
Ceram.
Soc.
Bull,.
59[12] (1980)
13. D.
S.
Wilkinson, Creep Mechanisms in Multiphase
Ceramic Materials,
J.
Am.
Ceram.
SOC.,
8 1 [2] (1998)
14. F. H. Norton, Creep of Steel at High Temperatures,
McGraw Hill, New York,
NY
(1929).
15. Nadai, The Influence of Time upon Creep; The
Hyperbolic Sine Creep Law,
in
S.
Timoshenko
Anniversary Volume, Macmillan, New York,
NY
(1938).
16. R. M. Hazine and C.
S.
White, Multiaxial Internal
Variable Modeling of the Creep Deformation and
Fracture of an Advanced Silicon Nitride,
Ceram.
Eng. Sci. Proc.,
18[3] (1997) 455-465.
17. C. W. Li and F. Reidinger, Microstructure and
Tensile Creep Mechanisms of
an
In
situ
Reinforced
Silicon Nitride,
Acta Muter.,
45[ 11 (1997) 407-421.
18. R. F. Krause, W. E. Luecke, J. D. French, B. J.
Hockey, and
S.
M. Wiederhorn, Tensile Creep and
Rupture Silicon Nitride,
J.
Am.
Ceram.
SOC.,
82[5]
19. W. G. Cannon and T. G. Langdon, Review: Creep of
Ceramics. Part 1 Mechanical Characteristics,
J.
Muter. Science,
18 (1981) 1-50.
20. W. G. Cannon and T. G. Langdon, Review: Creep of
1193-1 197.
275-299.
(1999) 1233-1241.
Ceramics. Part
2
An Examination of Flow
Mechanisms,
J.
Muter. Sci.,
23 (1988) 1-20.
21. J. A. Salem and
S.
R. Choi, Creep Behavior of
Silicon Nitride Determined from Curvature and
Neutral Axis Shift Measurements in Flexure Tests"
Lge Prediction Methodologies and data
35.0
ceramic
Materials,
ASTM
STP
1201, C. R. Brinkman and
S.
F.
Duffy,
Eds., American Society for Testing and
materials, Philadelphia, (1 994) 84-97.
22.
S.
R. Choi and
J.
A. Salem, Creep Behavior of
Silicon Nitride Evaluated by Deformation Curvature
and Neutral Axis Shift Determination,
Silicon-Based
Structural Ceramics,
B. W. Sheldon and
S.
C.
Danforth eds., Ceramic Transactions, 42 (1994) 285-
293.
23.
K.
Jakus and
S.
M. Wiederhorn, Creep Deformation
of Ceramics in Four-Point Bending,
J.
Am.
Ceram.
24.
S.
R. Choi,
L.
M. Powers, and J. P. Gyekenyesi,
Creep Behavior of Silicon Nitride with Various
SpecimenLoading Configurations, and Creep
Prediction Using the
CARESICreep
Program,
Proc.
of the
I"
China International Conference on High-
Performance Ceramics
(CICC-I),
Tsinghua
University Press, Beijing, China (1999) 612-615.
SOC.,
71[10] (1988) 196-199.
298
MATHEMATICAL MODEL
OF
MICROHARDNESS
OF
PLASMA SPRAYED CHROMIUM OXIDE COATING
Chuanxian Ding, Jianfeng Li, Heng Ji
Shanghai Institute of Ceramics, Chinese Academy
of
Sciences
1295 Dingxi Road, Shanghai
200050,
China
ABSTRACT
Thermal spraying involves
a
great number of
process parameters. The dependence of microhardness
of
plasma-sprayed Cr,O, coating on process parameters
including plasma gas flow, current, spraying distance
and powder feed rate was investigated using the
experimental method of uniform design with ten grades
for each of the process parameters. The mathematical
model of microhardness with respect to the investigated
process parameters was formulated employing stepwise
regression to a third order polynomial of the parameters.
Finally, it was experimentally confirmed that the
mathematical model demonstrated the relationships
between microhardness of the coating and its
parameters.
INTRODUCTION
Ceramic materials have received much attention in
industry, such as in ceramic engines, due to their high
hardness, chemical stability, oxidation-resistance and
thermal barrier properties at high temperatures. Their
high cost
of
production and brittle character, however,
will restrict the application of bulk ceramics in industry
to a certain extent. For this reason, ceramic coatings
onto metal substrates, which are cheap and reliable in
shock, are more widely employed
[
1-31.
Thermal spraying, such as plasma spraying and
detonation spraying, is one of the most important
processes for ceramic coatings since coatings with
thickness of
0.3
mm or more can be obtained. The
quality of thermal-sprayed coatings primarily depends
on powder characteristics and spraying conditions. The
spraying conditions themselves are dependent on
a
large
number of process parameters [4,5]. Experimental and
analytical research were conducted over the past three
decades to control the quality of the coatings. In this
respect, mathematical models offer
a
cost-effective and
highly flexible means for analyzing the effects of
process parameters on the quality of the coatings
[6-81.
Because thermal spraying involves many process
parameters, it
is
very difficult to investigate the
dependence
of
properties of thermal-sprayed coatings
on the process parameters by employing conventional
experimental methods, such as the optimum seeking
method and the orthogonal design method. For the
purpose of mathematical modeling, the thermal spraying
process is often divided into three distinct regions: the
torch, the spraying and the substrate.
A
number of
assumptions are then made to simplify the mathematical
representations of complex physical-chemical
phenomena occurring in these regions
[6-91.
K.
T.
Fang and
Y.
Wang developed the uniform
design method, which is especially suitable for
experimental research involving a great number of
parameters. Compared with other experimental design
methods, the uniform design method needs much less
experimental time and can achieve almost the same
efficiency
[10,11].
Microhardness is a basic and
important property of thermal sprayed coatings
[12].
In
this paper, the uniform design method with ten grades
for each of the process parameters was introduced into
plasma spraying and used to investigate the dependence
of microhardness of plasma-sprayed Cr,03 coating on
process parameters including plasma gas flow, current,
spraying distance and powder feed rate. The
mathematical model. of the microhardness with respect
to the investigated process parameters was then
formulated employing stepwise regression to a third
order polynomial of the parameters. Finally, it was
experimentally confirmed whether the mathematical
model demonstrated the relationships between the
microhardness of the coating and the process
parameters.
EXPERIMENTAL DETAILS
Plasma sprayed chromium oxide coating was
prepared using a Sulzer-Metco F4-MB gun mounted on
299
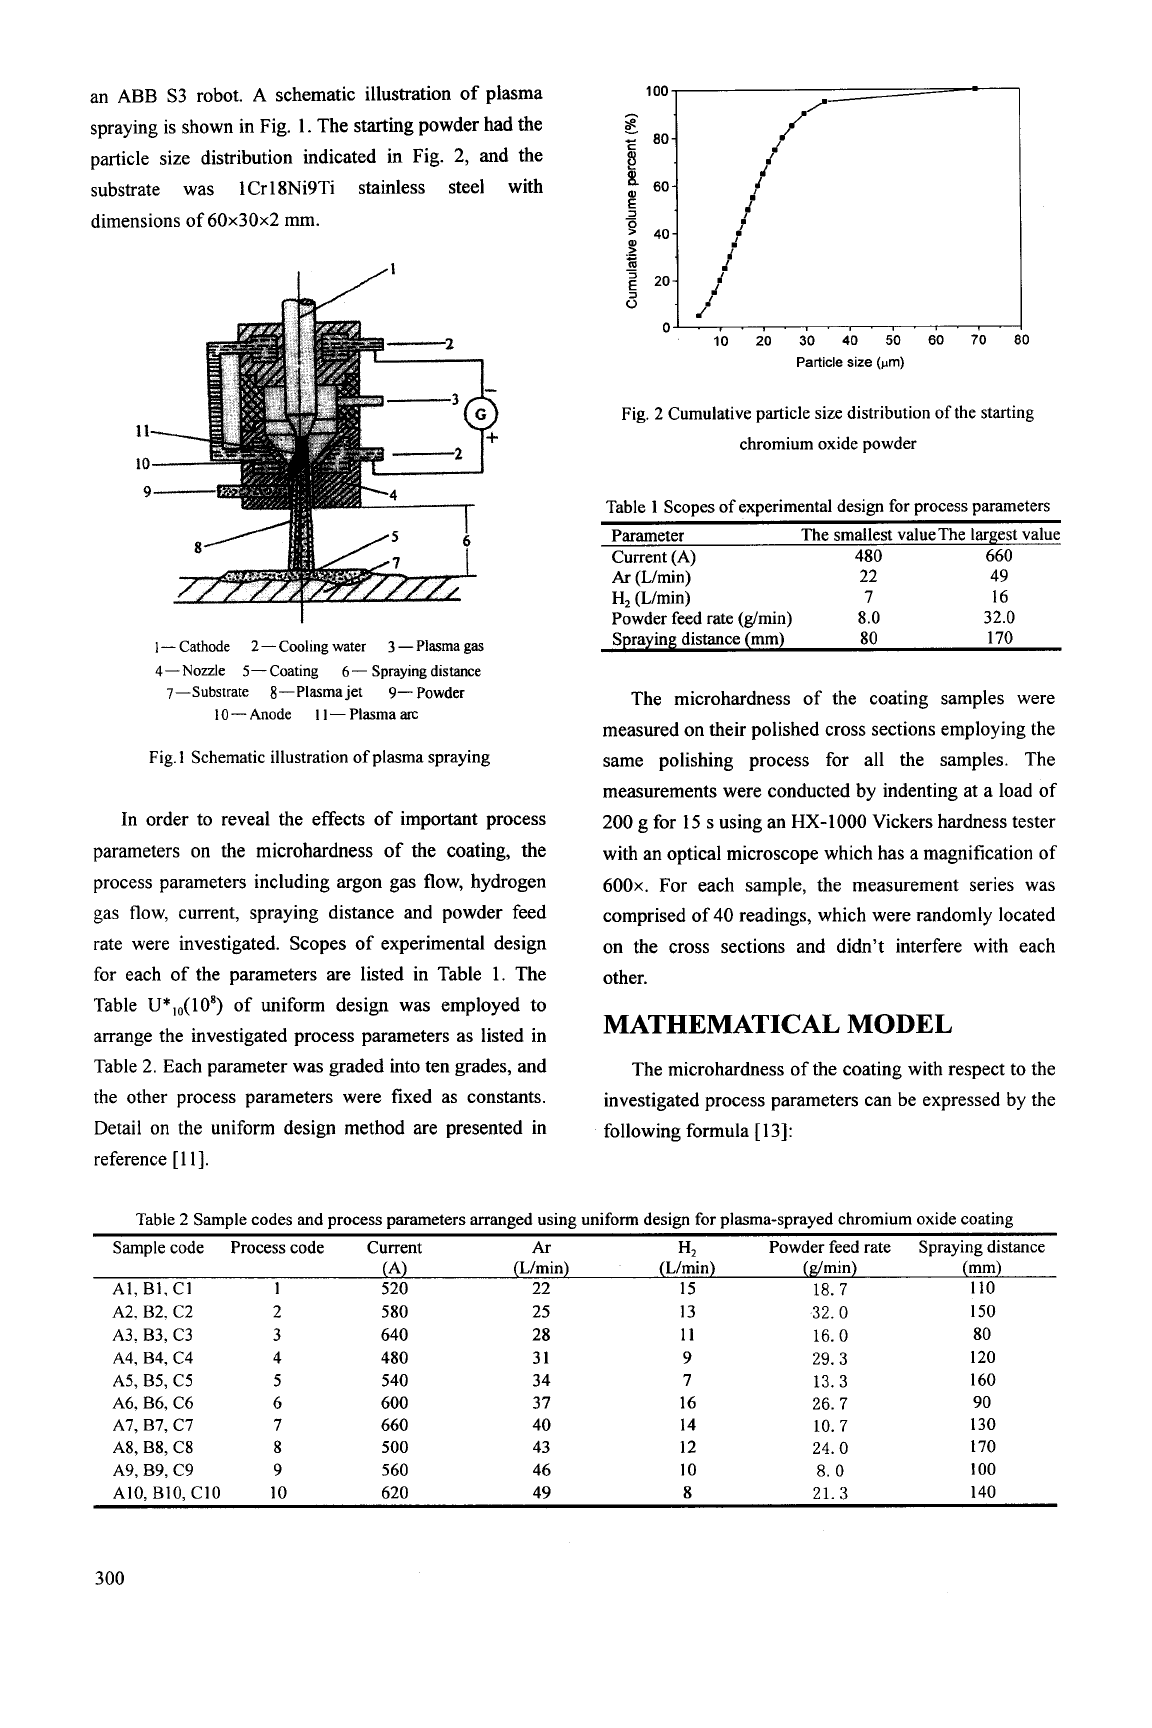
an
ABB
S3
robot.
A
schematic illustration of plasma
spraying is shown in Fig.
1.
The starting powder had the
particle size distribution indicated in Fig.
2,
and the
substrate was
1
Cr 18Ni9Ti stainless steel with
dimensions of
60x30~2
mm.
1
-
Cathode
2
-Cooling
water
3
-Plasma
gas
4-Nozzle
5-
Coating
6-
Spraying
distance
7-Substrate
8-Plasma jet
9-
Powder
10
-Anode
I
1
-
Plasma
an:
Fig.
1
Schematic illustration of plasma spraying
In order to reveal the effects of important process
parameters on the microhardness of the coating, the
process parameters including argon gas flow, hydrogen
gas flow, current, spraying distance and powder feed
rate were investigated. Scopes of experimental design
for each of the parameters are listed in Table 1. The
Table U*,,(108) of uniform design was employed to
arrange the investigated process parameters as listed in
Table
2.
Each parameter was graded into ten grades, and
the other process parameters were fixed as constants.
Detail on the uniform design method are presented in
reference
[
111.
10
20
30
40
50
60
70
80
Particle
size
(pm)
Fig. 2 Cumulative particle size distribution of the starting
chromium oxide powder
Table 1 Scopes of experimental design for process parameters
Parameter
Current
(A)
480 660
H,
(L/min)
7 16
Powder feed rate (g/min) 8.0 32.0
Spraying distance (mm) 80 170
The smallest valueThe largest value
Ar
(L/min) 22 49
The microhardness of the coating samples were
measured on their polished cross sections employing the
same polishing process for all the samples. The
measurements were conducted by indenting at a load of
200
g for
15
s
using an
HX-1000
Vickers hardness tester
with an optical microscope which has a magnification of
600x.
For each sample, the measurement series was
comprised of
40
readings, which were randomly located
on the cross sections and didn’t interfere with each
other.
MATHEMATICAL MODEL
The microhardness of the coating with respect to the
investigated process parameters can be expressed by the
following formula
[
131:
Table 2 Sample codes and process parameters arranged using uniform design for plasma-sprayed chromium oxide coating
Sample code Process code Current
Ar
H*
Powder feed rate Spraying distance
(A)
(L/min) (L/min) (g/min) (mm)
Al, B1, C1
1
520 22 15
18.
7
110
A2. B2. C2 2 580 25 13 32.
0
150
A3. B3, C3 3 640 28 11
16.
0
80
A4, B4, C4 4 480 31 9
29.
3 120
AS, B5, C5
5
540 34 7
13.
3
160
A6. B6, C6 6
600
37 16 26.
7
90
A7, B7,
C7
7 660 40 14
10.
7
130
A8, B8, C8
8
500 43 12
24.0
170
A10, B10, C10 10 620 49
8
21.3 140
A9, B9, C9 9 560 46
10
8.
0
100
300
5
55
where F(x,, x2
,...,
XJ
is the microhardness, x,, x2,
...,
x5
stand for current, argon gas flow, hydrogen
gas
flow,
powder feed rate and spraying distance respectively;
and m is the order of polynomial for the investigated
parameters.
Once the microhardness of the coating samples are
obtained with respect to the investigated process
parameters, one can formulate the mathematical model
by regressing the experimental results to the above
formula. However, two aspects must be considered.
On the one hand, thermal-sprayed coatings may
present inhomgeneities, pores andor anistropic
properties [12]. As a result, measured microhardness
data values typically appear rather scattered, and must
be evaluated employing statistical estimation procedures.
In the present study, assuming that the microhardness
data values obtained for the coating samples follow the
normal distribution, estimated means and confidence
intervals were calculated with the standard deviation
and sample size [13]. For each process code, an
experimental microhardness value was obtained by
taking the mean of the overlap of the two
95%
confidence intervals which were the closest to each
other among the three samples.
On the other hand, the number of process codes, 10,
in
Table
2
is too small and it is impossible to regress the
experimental results directly to the formula (1)
polynomial with an order more than 1.
So
the elements
in formula (1) must be sifted to reject the elements
which affect the microhardness negligibly and only
retain those which significantly affect the microhardness
for formulating the mathematical model. The methods
available to sift the elements include the best subset
regression, the backward elimination procedure and
stepwise regression [13]. In this study, stepwise
regression was used to model the experimental results of
the uniform design method.
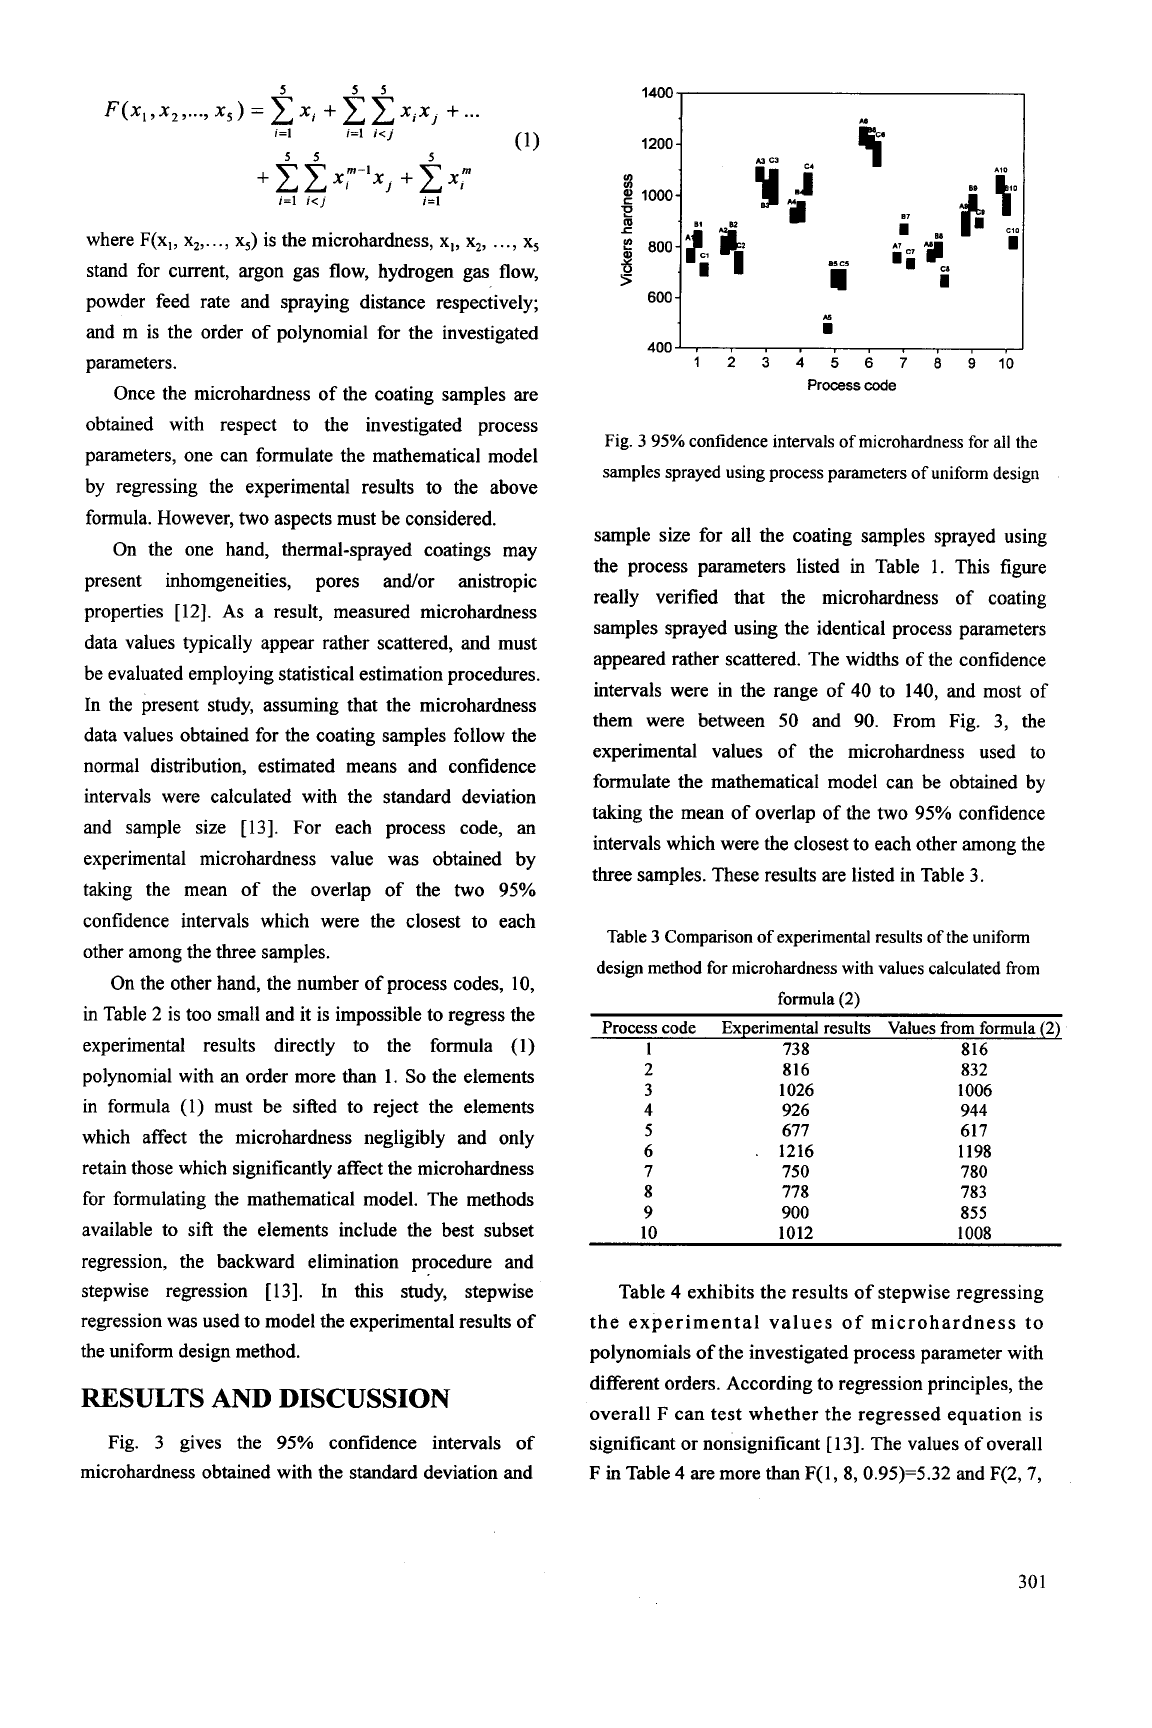
RESULTS
AND
DISCUSSION
Fig. 3 gives the 95% confidence intervals of
microhardness obtained with the standard deviation and
A5
I
4OOJr
I
I
I
, ,
,
, , ,
12
3
4
5
6
7 8
9
10
Process
code
Fig.
3 95%
confidence intervals of microhardness for all the
samples sprayed using process parameters of uniform design
sample size for all the coating samples sprayed using
the process parameters listed in Table 1. This figure
really verified that the microhardness of coating
samples sprayed using the identical process parameters
appeared rather scattered. The widths of the confidence
intervals were in the range of
40 to 140, and most of
them were between 50 and
90.
From Fig. 3, the
experimental values of the microhardness used to
formulate the mathematical model can be obtained by
taking the mean of overlap of the two
95%
confidence
intervals which were the closest to each other among the
three samples. These results are listed in Table 3.
Table
3
Comparison of experimental results of the uniform
design method for microhardness with values calculated from
formula
(2)
Process code Experimental results Values from formula
(2)
1
738 816
816
1026
926
677
1216
750
778
900
832
1006
944
617
1198
780
783
855
Table
4
exhibits the results of stepwise regressing
the experimental values of microhardness to
polynomials of the investigated process parameter with
different orders. According to regression principles, the
overall F can test whether the regressed equation is
significant or nonsignificant
[
131. The values
of
overall
F
in
Table
4
are more than F( 1,
8,
0.95)=5.32 and F(2,7,
301